HAL Id: hal-00495960
https://hal.archives-ouvertes.fr/hal-00495960
Submitted on 12 Jul 2010
HAL is a multi-disciplinary open access
archive for the deposit and dissemination of
sci-entific research documents, whether they are
pub-lished or not. The documents may come from
teaching and research institutions in France or
abroad, or from public or private research centers.
L’archive ouverte pluridisciplinaire HAL, est
destinée au dépôt et à la diffusion de documents
scientifiques de niveau recherche, publiés ou non,
émanant des établissements d’enseignement et de
recherche français ou étrangers, des laboratoires
publics ou privés.
A Subjective Study of Visibility Thresholds for wavelet
domain watermarking
Florent Autrusseau, Sylvain David, Vinod Pankajakshan
To cite this version:
Florent Autrusseau, Sylvain David, Vinod Pankajakshan. A Subjective Study of Visibility Thresholds
for wavelet domain watermarking. International Conference on Image Processing, Sep 2010, Hong
Kong SAR China. pp.201-204. �hal-00495960�
Cover Page
1) Title of the paper:
A SUBJECTIVE STUDY OF VISIBILITY THRESHOLDS FOR WAVELET
DOMAIN WATERMARKING
2) authors’ affiliation and address:
IRCCyN-IVC, (UMR CNRS 6597), Polytech' Nantes
Rue Christian Pauc, La Chantrerie, 44306 NANTES, France.
Tel : 02.40.68.30.52
Fax : 02.40.68.32.32
3) e_mail address:
[email protected]
4) Conference & Publisher information:
IEEE ICIP 2010
http://www.icip2010.org/
http://www.ieee.org/
5) bibtex entry:
@conference{ICIP2010_WavJND,
author = {F. Autrusseau and S. David and Vinod Pankajakshan},
title = {A Subjective Study of Visibility Thresholds for
wavelet domain watermarking},
booktitle = {IEEE International Conference on Image
Processing, ICIP'2010},
year = {2010}
}
A SUBJECTIVE STUDY OF VISIBILITY THRESHOLDS FOR WAVELET DOMAIN
WATERMARKING
Florent Autrusseau, Sylvain David, Vinod Pankajakshan
IRCCyN lab., University of Nantes
Rue Christian Pauc, 44306 Nantes, France
ABSTRACT
Ensuring watermark invisibility in digital images is a chal-lenging task. Most watermarking techniques empirically ad-just a strength parameter in order to reach the best trade-off between invisibility and robustness. A target PSNR value is typically set in order to reach a defined quality level. Some watermarking techniques exploit local activity to increase the watermark strength in some specific images areas (edges, tex-tures). In this work we study the visibility thresholds for wavelet domain multiplicative embedding using a watermark-ing oriented subjective experiment protocol. Thirty four ob-servers were enrolled for a subjective experiment, and had to adjust the watermark strength in order to best define the visibility threshold for watermarking distortions. Three wa-termark embedding equations were tested in various wavelet sub-bands , and the optimal equation maximizing robustness was derived for every sub-band.
1. INTRODUCTION
In digital watermarking, various embedding domains like the DFT, DCT and DWT have been exploited for watermark in-sertion. Every embedding domain presents some advantages and drawbacks with respect to the most common watermark-ing requirements: invisibility, robustness and security . In par-ticular, the wavelet domain has been a popular choice for wa-termark embedding, thanks to its multiresolution capabilities, a rather good Human Visual System modeling (HVS), and spatio-frequency localization. Effectively, most watermark-ing techniques empirically adjust the embeddwatermark-ing strength in order to reach the best trade-off between invisibility, robust-ness and security. Basic HVS modeling for watermarking ap-plications include luminance sensitivity, frequency sensitiv-ity, and edge sensitivity [1]. The work in [2] also exploits con-trast masking and the Watson distance for optimized Quan-tization Index Modulation (QIM) watermarking. The Noise Visibility Function (NVF) is commonly used to weight the watermark in the image areas having a higher perceptual em-bedding capacity [3]. The NVF basically uses the local vari-ance as a weighting parameter. Pioneer works on image
adap-The authors exploited Watson’s works on luminance sensi-tivity and contrast masking. They proposed two watermark-ing techniques operatwatermark-ing either in the DWT domain or in the DCT domain. The watermark was weighted with a Just No-ticeable Difference (JND) model and additively embedded in the transformed coefficients. Again, in these embedding tech-niques (either DCT or DWT based), the watermark energy was concentrated onto the high activity image areas (mostly edges and textures).
The work presented in this paper focuses on the water-mark invisibility in wavelet domain embedding. There are two major differences between the previously cited water-marking techniques and the proposed work: 1) most wa-termarking schemes avoid embedding the watermark in the smooth areas of the image, as it supposedly can’t stand any noise, in this work, we experimentally study the possibility of embedding a noise like watermark in smooth areas, and 2) in most of the cited works, some HVS features are con-sidered in order to optimally embed the watermark in the image, whereas in this work, we experimentally determine the visibility threshold in wavelet sub-bands. Furthermore, as most of the subjective quality experiment procedures in the literature are designed for assessing coding distortions, we hereby setup a new subjective protocol which is particularly adapted to visibility threshold detection in watermarking.
Finally, in this work, we explore the appropriateness of using various watermarking embedding formulas. To the best of our knowledge, most (if not all) watermarking techniques use a single embedding equation, whatever frequency range is being watermarked (wavelet sub-band level for instance) and whatever is the wavelet coefficient value range. We hereby study the invisibility versus robustness trade-off in various wavelet sub-bands and using different watermark embedding equations.
This paper is structured as follows: Section 2 presents the embedding technique being used during the subjective test, Section 3 gives details on the experiment itself, we analyse the subjective data in Section 4. In section 5 we evaluate the performances of the watermarking technique for various em-bedding equations and frequency bands. We finally conclude
2. EMBEDDING EQUATIONS
The goal of this work is to study the visibility thresholds in wavelet-domain watermarking using different embedding methods. The most commonly used wavelet-domain water-mark scheme is the multiplicative embedding [5], in which the wavelet coefficients are modified as:
Yi,j(m, n) = Xi,j(m, n) + a · |Xi,j(m, n)| · Wi,j(m, n) (1)
where Xi,j(m, n), Wi,j(m, n) and Yi,j(m, n) are
respec-tively the (m, n) location wavelet coefficient at sub-band (i, j) for the host image, a zero mean, unit variance Gaussian distributed watermark and the marked image. The watermark strength, a, is usually determined empirically based on a target PSNR. We modified Equation 1 as:
Yi,j(m, n) = Xi,j(m, n)+a·|Xi,j(m, n)|k·Wi,j(m, n) (2)
so that the watermark energy is spread differently along the edges depending on the parameterk. Three embedding equa-tions are considered here, withk = {1, 2, 0.5}. The com-monly used linear embedding scenario(k = 1), as well as a square function(k = 2) in order to further enhance the water-mark strength in high amplitude wavelet coefficients (such as in [6]). Finally, the square root function (k = 0.5) increases the strength for low amplitude wavelet coefficients.
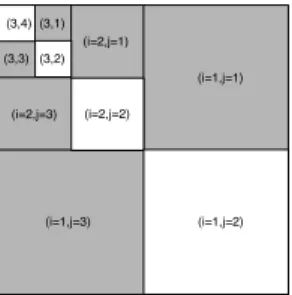
(i=1,j=1) (i=1,j=2) (i=1,j=3) (i=2,j=1) (i=2,j=3) (3,1) (3,2) (3,3) (3,4) (i=2,j=2)
Fig. 1. Wavelet indexes used in Equation 2
A three level decomposition using CDF 9/7 bi-orthogonal wavelet is considered for watermark embedding. As the watermarks embedded in the diagonal sub-bands are more susceptible to lossy compression, those sub-bands are not considered in this study. The wavelet sub-bands used for watermark embedding are shown in gray shade in Figure 1.
3. SUBJECTIVE EXPERIMENT
Several experimental protocols are available for subjective quality assessment, see [7] for a brief description of stan-dard experiments. In this study, we propose a new subjec-tive protocol which is particularly suited for watermark visi-bility threshold detection. A subjective experiment1 was set
1Source code: http://www.irccyn.ec-nantes.fr/~autrusse/jnd/
under normalized viewing conditions according to the ITU-R BT.500-11 recommendations. The display monitor was an iMac with a1920 × 1080 resolution, 50Hz, its minimum and maximum luminance were respectively0.26 cd/m2 and
213 cd/m2. Thirty four observers with normal or corrected
to normal acuity and normal colour vision were enrolled for the experiment. Since the subjective experiments are time consuming and tedious for the observers, some choices were made about the number of distortions and the number of in-put images in order to reduce the experiment duration. Five colour images of size768 × 512 pixels, chosen from the Ko-dak image database2were used in the experiment. The images
were watermarked using the3 embedding equations in the 6 selected wavelet sub-bands independently. For every trial, the observers had to stare at the watermarked images, displayed at a distance of six times the image height. The observers were asked to modify thea parameter in Equation 2, in or-der to adjust the watermark strength just below the visibil-ity threshold. The “up” and “down” arrows on the keyboard were used to increase/decreasea, and once the threshold set, the observers had to validate this selection with the “return” key. The initial value fora was set to 0.00002 and the incre-ment/decrement step was two (any stroke on the arrows mul-tiplies or divides the coefficient by 2). Thirty images were displayed per session and the average session duration was about 20 minutes. Twelve observers collected thea parame-ter for equationk = 1, 12 observers collected a for k = 2, and the remaining 10 observers collected thea parameter for equationk = 0.5. Using five input images watermarked in six wavelet sub-bands with three different embedding equations we have overall collected1020 a parameters.
4. SUBJECTIVE RESULTS ANALYSIS
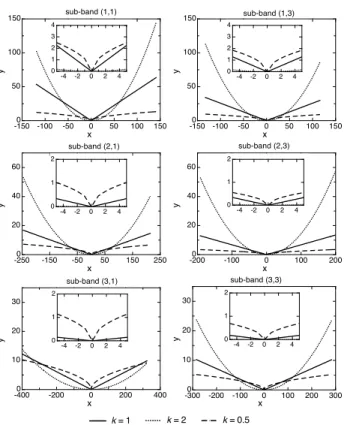
For each watermarked image and each embedding sub-band, thea parameters given by the observers are averaged to get ¯a, which will be used in the following analysis. The watermark embedding at the visibility threshold for 6 wavelet sub-bands are plotted in Figures 2 and 3 for the “plane” and “farm” im-ages respectively. The 3 rows of plots respectively represent high, middle and low frequency embedding. The insets in Figures 2 and 3 represents a zoom at the center of the plot. The x-axis is the wavelet sub-band coefficient, and the y-axis is the watermark weighting function !¯a × |Xi,j(m, n)|k".
The higher is the curve, the stronger is the watermark. Evidently, the lower gets the watermark frequency, the lower is the embedding strength. In Fig. 2, the¯a parameters do not differ much across orientations of a given level and in Fig. 3,a significantly differs across orientations. This is¯ because the “farm” image has many high contrast horizontal edges, introducing larger wavelet coefficients in orientation 1, consequently, the magnitude of the¯a parameter is restricted
-1500 -100 -50 0 50 100 150 50 100 150 x y sub-band (1,1) -4 -2 0 2 4 0 1 2 3 4 -1500 -100 -50 0 50 100 150 50 100 150 x y -4 -2 0 2 4 0 1 2 3 4 sub-band (1,3) -2500 -150 -50 50 150 250 20 40 60 x y -4 -2 0 2 4 0 1 2 sub-band (2,1) x -2000 -100 0 100 200 20 40 60 -4 -2 0 2 4 0 1 2 y sub-band (2,3) -4000 -200 0 200 400 10 20 30 x y -4 -2 0 2 4 0 1 2 sub-band (3,1) -3000 -200 -100 0 100 200 300 10 20 30 x y sub-band (3,3) -4 -2 0 2 4 0 1 2 k = 1 k = 2 k = 0.5
Fig. 2. Optimal watermark embedding depending on the three considered equations for image “plane”
by such high amplitude wavelet coefficients. Furthermore, we can notice on Figures 2 and 3 that the optimal choice of the embedding equation strongly depends on the embedding frequency. In lower frequency sub-bands (Level 3), using k = 0.5 can achieve a quite strong watermark embedding, whereas for high and mid-frequency (Levels 1 and 2), using k = 1 or 2 provides overall stronger watermarks. However, we can notice in the insets that for very low wavelets coeffi-cients (having better robustness) usingk = 0.5 always pro-vides stronger watermarks. An important observation from Figures 2 and 3 is that none of the 3 embedding equations is optimal by itself, and thus, combining the three equations might improve the watermark embedding.
Effectively, each equation reaches the visibility threshold in a certain range of wavelets coefficients. A stronger embed-ding is obtained usingk = 0.5 in the lowest wavelet coeffi-cients, then,k = 1 reaches the visibility threshold for higher coefficients, and usingk = 2 embeds stronger watermarks for highest coefficients. During the subjective experiment, it was observed that while increasing the watermark strengtha, the visibility threshold was reached in distinct parts of the image depending on the embedding equation. Whenk = 1 or 2, the distortion first appeared on the image edges (having a higher energy in the wavelet sub-band), whereas fork = 0.5, the
-1500 -100 -50 0 50 100 150 40 80 120 x y sub-band (1,1) -4 -2 0 2 4 0 1 2 3 4 -1500 -100 -50 0 50 100 150 40 80 120 x y sub-band (1,3) -4 -2 0 2 4 0 1 2 3 4 -3000 -200 -100 0 100 200 300 20 40 60 80 100 x y sub-band (2,1) -4 0 4 0 1 2 -3000 -200 -100 0 100 200 300 20 40 60 80 100 x y sub-band (2,3) -4 -2 0 2 4 0 1 2 -400 -300 -200 -1000 0 100 200 300 400 10 20 30 40 50 x y sub-band (3,1) -4 -2 0 2 4 0 1 2 -3000 -200 -100 0 100 200 300 10 20 30 40 50 x y sub-band (3,3) -4 -2 0 2 4 0 1 2 k = 1 k = 2 k = 0.5
Fig. 3. Optimal watermark embedding depending on the three considered equations for image “farm”
5. PERFORMANCES EVALUATION
From the subjective experiment, we have collected the ¯a parameters from the invisibility point of view. We now com-pare the robustness performances of different embedding equations to identify the optimal one in each sub-band. A set of 90 watermarked images was generated using Equa-tion 2 with the ¯a parameters. This work did not intend to provide an efficient watermarking technique, but rather to study the behavior of watermark embedding formulae at the visibility threshold. We thus used a simple non-blind detection technique, computing the correlation coefficient be-tween( ˜Yi,j(m, n) − Xi,j(m, n)) and Wi,j(m,n), ˜Yi,j(m, n)
being the marked (and possibly distorted) wavelet sub-band. The detection threshold for each embedding equation in every wavelet sub-band was chosen as four times the maximum cor-relation coefficient corresponding to 200 wrong watermarks. The robustness performance was tested against JPG compres-sion (quality factor from 70 to 10), JPEG 2000 (0.5bpp to 0.04bpp), Gaussian noise addition (with variances ranging from 0.001 to 0.011), and various filtering methods (sharp-ening, Gaussian and median filtering). Figure 4 shows the correlation coefficients for the 35 tested attacks. The three curves stands for average high frequency bands (bands (1,1) and (1,3) in Fig. 1 represented with a solid line), medium
low frequency bands (bands (3,1) and (3,3) in dotted line) and are averaged across the 5 input images. The thin horizontal lines represent the detection thresholds.
2 4 6 8 10 12 14 16 18 20 22 24 26 28 30 32 34 0.0 0.1 0.2 0.3 0.4 0.5 0.6 0.7 0.8 Attack index JPEG 2000 coding
JPEG coding Noise addition Filtering
HF watermarks (Level 1) MF watermarks (Level 2) LF watermarks (Level 3) HF detection threshold MF detection threshold LF detection threshold
Fig. 4. Correlation coefficients against 35 attacks (k = 0.5) Due to space limitations, we only present the average de-tection performances within every frequency level. Percent-ages of correct detection are plotted on Fig. 5, which shows the detection performance for each of the three equations, and for every wavelet level . It can be observed that the square root embedding has the best robustness performance in all the lev-els, although the analysis of the subjective data showed over-all a lower watermark strength in this scenario (Section 4). In particular, its performance is significantly better in the lowest frequency (level 3). Usingk = 0.5 actually embeds stronger watermarks in the low amplitude wavelet coefficients (see in-sets in Figures 2 and 3). Some attacks, such as coding or fil-tering, would more strongly modify the image edges, and thus a watermark embedded in the smooth areas, although of quite weak strength, might be more robust. Finally, it is interesting to notice that for all the embedding equations, the robustness decreases as the watermark embedding frequency decreases. This is probably because of the selected images, which have a quite low frequency content, and thus have a weak energy in the lowest wavelet levels, thereby limiting the embedding strength in such a frequency range.
6. CONCLUSION
A subjective protocol was proposed and tested for wavelet domain embedding. The observers were asked to modulate the watermark strength independently in 6 wavelet sub-bands. They were instructed to set the watermark strength just below the visibility threshold. The experiment showed that using a square root embedding equation provided better robustness for all wavelet levels. Although usingk = 0.5 presented a lower watermark strength during the subjective experiment its robustness performances are actually due to the smooth area embedding of this technique. In future works, we will try to
Level 1 Level 2 Level 3 0 10 20 30 40 50 60 70 80 90 100 k = 1 k = 2 k = 0.5
Fig. 5. Percentage of correct detection (against 35 attacks) for the three tested embedding equations
mathematically model thea coefficient of the weighting func-tion, so as to design a wavelet domain JND mask. We will furthermore study a possible combination of the three embed-ding equations in order to optimize the watermark strength in the whole wavelet coefficient range.
7. REFERENCES
[1] H. Qi, D. Zheng, and J. Zhao, “Human visual system based adaptive digital image watermarking,” Signal Pro-cessing, vol. 88, no. 1, pp. 174–188, 2008.
[2] Q. Li and I. J. Cox, “Using perceptual models to im-prove fidelity and provide resistance to valumetric scaling for quantization index modulation watermarking,” IEEE Trans. on Information Forensics and Security, vol. 2 (2), pp. 127–139, 2007.
[3] S. Voloshynovskiy, A. Herrigel, N. Baumgaertner, and T. Pun, “A stochastic approach to content adaptive digital image watermarking,” in Proc. of the 3rd Intl. Workshop on Information Hiding, 2000, pp. 211–236.
[4] C. I. Podilchuk and W. Zeng, “Image adaptive water-marking using visual models,” IEEE Journal on Selected Areas in Comm., vol. 16, (4), pp. 525–539, 1998. [5] I.J. Cox, J. Kilian, F.T. Leighton, and T. Shamoon,
“Secure spread spectrum watermarking for multimedia,” IEEE Trans. on Image Proc., pp. 1673–87, 1997, 6(12). [6] X. Xia, C. G. Boncelet, and G. R. Arce, “Wavelet
trans-form based watermark for digital images,” Optics Ex-press, vol. 3(12), pp. 497–511, 1998.
[7] P. Le Callet, F. Autrusseau, and P. Campisi, Multimedia Forensics and Security, chapter IX, pp. 164–193, Idea Group Publishing, 2008.