Any correspondence concerning this service should be sent to the repository administrator:
[email protected]
O
pen
A
rchive
T
oulouse
A
rchive
O
uverte (
OATAO
)
OATAO is an open access repository that collects the work of Toulouse researchers
and makes it freely available over the web where possible.
This is a publisher-deposited version published in:
http://oatao.univ-toulouse.fr/
Eprints ID: 4760
To link to this article:
DOI:10.1063/1.3463400URL:
http://dx.doi.org/10.1063/1.3463400To cite this version:
Sendova, Mariana and Flahaut, Emmanuel and Hartsfield, Thomas ( 2010) Temperature dependence of Raman scattering in filled double-walled carbonTemperature dependence of Raman scattering in filled double-walled
carbon nanotubes
Mariana Sendova,1,a兲Emmanuel Flahaut,2,3and Thomas Hartsfield1
1
New College of Florida, Sarasota, Florida 34243, USA
2
Université de Toulouse, UPS, INP, Institut Carnot Cirimat, 118, route de Narbonne, F-31062 Toulouse Cedex 9, France
3
CNRS, Institut Carnot Cirimat, F-31062 Toulouse, France
共Received 7 May 2010; accepted 14 June 2010; published online 20 August 2010兲
Four types of filled double-walled carbon nanotubes 共DWNTs兲 共Se@DWNT; Te@DWNT;
HgTe@DWNT; and PbI2@ DWNT兲 have been studied by high-resolution transmission electron
microscopy and micro-Raman spectroscopy in the temperature interval from 80 to 700 K employing
785 nm excitation wavelength. The temperature dependence of the dominant bands 共D-band,
G-band, and the 共2D兲-band兲 are analyzed in terms of the model developed by Klemens, Hart,
Agraval, Lax, and Cowley and extended by Balkanski for anharmonic decay of optical phonons. The quasiharmonic frequencies and the anharmonicity constants were obtained from the temperature dependences of the analyzed Raman bands. The findings were compared to analogous study for empty DWNTs. The strength of the van der Waals interaction between the guest material and the carbon nanotube共CNT兲 estimated through the quasiharmonic frequencies was found to decrease in
the following order: Se@DWNT; Te@DWNT; PbI2@ DWNT, and HgTe@DWNT. In agreement
with this, the anharmonicity due to the phonon–phonon interactions was found to decrease in the same order. © 2010 American Institute of Physics.关doi:10.1063/1.3463400兴
I. INTRODUCTION
The synthesis of monodimensional nanocrystals is com-plex due to the lack of stability of such structures. One way to stabilize them is to prepare them within a container, such as a carbon nanotubes共CNTs兲 due to their inner diameter in the nanometer range, as well as their good chemical and thermal stability. The question which we attempt to answer with this study is what are the forces between the carbon atoms of the CNT walls and the atoms of the filling material. The aim of this work is to use temperature controlled micro-Raman spectroscopy to investigate how the presence of fill-ing materials can modify the optical phonons decay mecha-nisms due to the additional van der Waals interactions between the nanotube walls and the guest materials. Earlier studies have revealed that the space available within CNT along with the van der Waals interactions with the tube walls may play an important role on the crystal structure of the confined material, especially in the case of narrow
double-walled carbon nanotube 共DWNT兲 where materials are often
found in amorphous state even if they crystallize in single-walled CNT 共SWNTs兲 of similar inner diameter.1,2 In this
work we report the filling of DWNT by Se, Te, PbI2, and
HgTe using a capillary effect technique with melted filling materials, and their characterization by micro-Raman spec-troscopy in the temperature range between 80 and 700 K.
II. EXPERIMENTAL
DWNT were synthesized by catalytic chemical vapor deposition as described in a previous paper.3They were filled
using a high filling yield capillary wetting technique.1
DWNT were mixed and gently ground together with the cor-responding compound or element using a mortar and pestle 共PbI2powder, 99.999% purity, Aldrich; Se powder, 99.999%
purity, Aldrich; Te powder, 99.999% purity, Strem Chemi-cals; and HgTe powder, 99.9% purity, Strem Chemicals兲. The mixture was vacuum-sealed in a quartz ampoule which was heated in a programmed furnace at 5 K min−1 to a
tempera-ture higher than the melting point of the filling material
关PbI2: 723 K 共MP=681 K兲; Se: 573 K 共MP=494 K兲; Te:
843 K 共MP=722 K兲; and HgTe: 1000 K 共MP=943 K兲兴
with a dwell at this temperature共PbI2: 5 h; Se: 24 h; Te: 10
h; and HgTe: 6 h兲 followed by cooling first ⬃100 K below the melting point at 0.1 K/min and then to room temperature at 1 K/min. In the case of PbI2 共Ref.1兲 and Se,4the excess
filling material contaminating the outside of the DWNT could be removed by washing at room temperature for a few minutes 共PbI2: 6M NaOH; Se: concentration HNO3兲. In the case of Te共Ref.5兲 and HgTe, because of the impossibility to
dissolve them due to their very low solubility in acids, excess material located around the DWNT could not be removed. In most cases, the filling yield was roughly estimated to be ⬃50%, straight from high resolution transmission electron
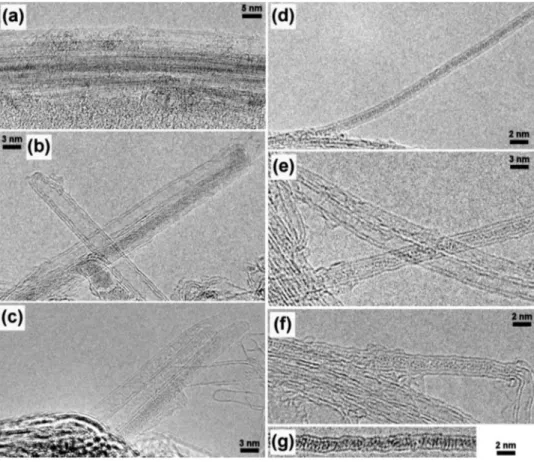
microscopy 共HRTEM兲 observation. Figure 1 shows typical
HRTEM images of the HgTe@DWNT sample of both bundles and individual nanotubes关Figs.1共b兲,1共d兲, and1共f兲兴, mostly filled along the whole observed length.
Raman spectra were acquired using a Leica DMLP mi-croscope coupled to a Raman system manufactured by Kai-ser Optical Systems Inc. The RamanRxn1™ analyzer
incor-porates the thermoelectrically 共TE兲-cooled charge coupled
device detector for maximum sensitivity, Invictus™ near in-frared共NIR兲 semiconductor laser with wavelength of 785 nm
a兲Electronic mail: [email protected].
共1.58 eV兲, and holographic grating to provide fast, simulta-neous full spectral collection of Raman data. The spectral resolution in this Raman system is about 5 cm−1. The laser
spot diameter on the sample was 10 m.
The power density was maintained at 13 W/m2.
Heating effects from the laser irradiation were considered negligible for 785 nm excitation wavelength at this power
density level.6The samples were heated in a Linkam THMS
600 heating stage in static air from 80 to 700 K. At each data point, the sample was left to thermalize for 15 min. Extreme care was taken to assure identical position of the laser spot at each temperature point. All spectra were normalized to the peak intensity of the strongest band in the spectra共G-band兲. All the numerical manipulations of the spectra were
per-formed withGRAMS/AL7.02共Thermo Electron Corporation兲
andORIGINPRO共Origin Laboratory Corporation兲 software. III. RESULTS AND DISCUSSION
From the field emission gun scanning electron micro-scope images3of raw nanotube powders, and taking into ac-count the average length of the nanotubes, it was estimated that under the Raman microscope objective the sample from which the spectra were collected consisted of approximately 300 DWNTs. From HRTEM DWNT diameter distribution study conducted earlier3 it was estimated that the studied samples had approximately the following composition in
terms of tube diameter for the inner tubes: 共nanotubes
number/diameter兲 15/0.5 nm; ⬇110/1.0 nm; ⬇120/1.5 nm; ⬇45/2.0 nm; and for the outer tubes: ⬇10/1.0 nm; ⬇60/1.5
nm; ⬇120/2.0 nm, ⬇110/2.5 nm. The energy of the
excita-tion photons used in our experiment is 1.58 eV. According to
the Kataura plot7 SWNTs in resonance at this excitation
wavelength are those with diameters between 0.9 nm and 2.0
nm giving rise to radial breading modes 共RBMs兲 between
120 and 300 cm−1. The two dominant RBM bands in all of
the CNTs used in this study are at 115 and 264 cm−1, which
are in good agreement with the Raman shifts predicted for 0.94 and 1.63 nm semiconducting CNTs, in agreement with the E33s and E22s electronic transitions.
The G-band is the most intense Raman spectral feature
共1550–1600兲 cm−1. It is a result of tangential C–C bond
stretching. Symmetry assignments of four Lorentzian
components of the G-band 关⬃1549共E
2
−兲, ⬃1567共G−兲,
⬃1590共G+兲, and ⬃1607共E
2
+兲兴 cm−1 of single
semiconduct-ing SWNT have been reported.8For comparative reasons, we analyzed the G-band of the DWNT powder samples by fit-ting it with the minimum number of Lorentzian line shapes, in this case four, in the range from 1500 to 1660 cm−1.
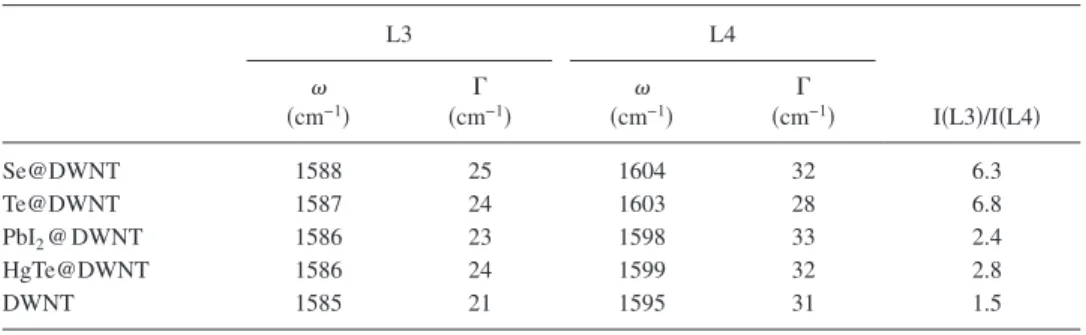
Fig-ure 2compares the quality of the fit of the G-band at 80 K The four components are labeled L1 to L4 in order of in-creasing Raman shift. The dominant Lorentzian line shapes from the G-band are L3 and L4. The integral intensity of L3, I共L3兲 is between 50% and 60% of the overall integral inten-sity of the G-band, I共G兲. L3 might have contributions from the graphitelike 共1580 cm−1兲 line and from the G+ mode.
I共L4兲 is between 10% and 30% of I共G兲. Each one of the other two components, L1 and L2, has less than 10% contribution. Position,, full width at half maximum共FWHM兲 ⌫, and the ratio of I共L3兲/I共L4兲 for each type of filled DWNTs are sum-marized in Table I. The uncertainty from the fitting
proce-FIG. 1. HRTEM images of the HgTe@DWNT sample of both bundles and individual nanotubes.
dure in determining the peak position of the most intense
components is not more than 1 cm−1. The main component,
L3, in the G-band does not exhibit change in the FWHM depending on the filling material, Table I. The main differ-ence between the filled DWNT G-band at 80 K is in the L4, L3 intensity ratio, and their separation. It seems that accord-ing to these two criteria the samples can be divided into two groups: Se@DWNT and Te@DWNT being in one group with L3 L4 peak separation of around 16 cm−1and integral
intensity ratio around 6; and PbI2@ DWNT and
HgTe@DWNT constituting another group characterized by smaller separation around 12 cm−1and integral intensity
ra-tio of around 3. As compared to the empty DWNT samples
which have a L3 L4 peak separation of around 10 cm−1and
I共L3兲/I共L4兲 is only 1.5. According to previous publications8
E+2
mode which in our case can be associated with L4, is coming mostly from nanotubes with high chiral angles. L4 decreases in relative intensity from the empty DWNT to Se@DWNT. This might be interpreted as an indication of chirality 共or electronic density of states兲 induced change from the presence of the filling material, caused by the tube-filling material van der Waals interaction. DWNTs which have been in resonance with the excitation photons in the empty DWNT are not in resonance once the filling atoms were introduced. From the band fit it can be suggested that
that the dominant G-band component 共L3兲 in the
Se@DWNT is upshifted by 3 cm−1 as a result of the Se
atoms inside the tubes. Similar blueshift was experimentally
detected of the G band 共1064 nm excitation line兲 and
re-ported for SWNT intercalated by electron acceptors 共S, Se, and Te兲.9
The upshift caused of the rest of the filling materi-als is smaller that 3 cm−1.
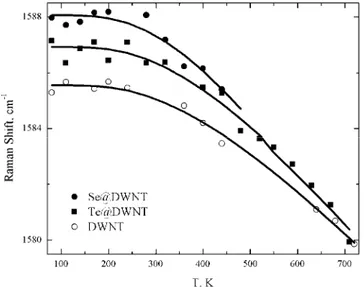
The Lorentzian components parameters acquired from the best 80 K G-band fit were used as initial conditions for every G-band fitting procedure applied for each sample at higher temperatures. As a result, for each filled DWNT sample obtained positions of the dominant G-band compo-nent are plotted as a function of temperature. In Fig. 3 the data are presented for the Se@DWNT, Te@DWNT, and compared to the empty DWNT.
In general, two main effects contribute to the phonon shift: purely thermal effect共/T兲Vand volume related
ef-fect due to lattice expansion共/V兲T共V/T兲P. The thermal
expansion coefficient of the tube diameter and lattice con-stant for SWNT is very small and is experimentally deter-mined by x-ray diffraction studies to be of the order of
0 0.2 L1 L2 L4 0.4 0.6 0.8 1 L3 a 0 0.2 0.4 0.6 0.8 1 b L1 L2 L3 L4
Intens
ity,
a.u.
0 0.2 0.4 0.6 0.8 1 1500 1550 1600 1650 c L1 L2 L4 L3Raman shift, cm
-1FIG. 2. G-band at 80 K fitted by four Lorentzian line shapes 共a兲 Se@DWNT;共b兲 PbI2@ DWNT; and共c兲 empty DWNT.
TABLE I. Position and FWHM of the L3 and L4 components of the G-band and their integral intensity ratio and 80 K. L3 L4 I共L3兲/I共L4兲 共cm−1兲 共cm⌫−1兲 共cm−1兲 共cm⌫−1兲 Se@DWNT 1588 25 1604 32 6.3 Te@DWNT 1587 24 1603 28 6.8 PbI2@ DWNT 1586 23 1598 33 2.4 HgTe@DWNT 1586 24 1599 32 2.8 DWNT 1585 21 1595 31 1.5
0.15⫻10−5 l/K and 0.75⫻10−5 l/K, respectively, between 300 and 950 K.10Therefore, the pure thermal effect, but not the volume expansion effect determined the temperature co-efficients of the DWNT Raman bands.11,12 The temperature
dependences of the frequency shift,⍀共T兲 of the L3
compo-nent of the G-band, as well as the D- and 共2D兲-bands, are
analyzed in terms of the model developed by Klemens,13
Hart et al.,14 and Cowley15and extended by Balkanski16 for anharmonic decay of optical phonons. The optical mode fre-quencies of the D-and G-bands approximately corresponds to Debye temperatures of 1870 K and 2280 K, respectively. Consequently, the occupation number for the equivalent har-monic oscillator is less than one for the temperature range of
our investigation 共80 to 700 K兲. Therefore, our
consider-ations are always in the quantum mechanical limit of a clas-sical harmonic oscillator. Also shown in Fig. 3 are the
nu-merical fits to the data 共solid curve兲 specified by the
expression reflecting the contributions of the three-phonon processes共cubic anharmonicity兲,16to the frequency shift
⍀共T兲 =0+ C
冋
1 +2
ex− 1,
册
共1兲where x =ប0/2kBT if simple Klemens13 approximation is
applied; kBis the Boltzman constant;ois a fitting parameter
corresponding to the quasiharmonic frequency of the phonon
mode, and C is a fitting parameter related to the real part of
the phonon’s self energy. The values for o and C for the
filled and empty DWNT are listed in TableII. The variations in the anharmonicity constant between the samples are not significant. The quasiharmonic frequency, however is always higher than the quasiharmonic frequency of empty DWNT. The highest shift is observed in the Raman spectra of Se@DWNT.
Raman D-band of the CNTs at around 1300 cm−1 is
at-tributed to the bond-angle disorder in the graphitic layers induced by linking with sp3carbon atoms as a result of
scat-tering in the presence of in-plane defects. The 2D-band 共G
⬘
-band in some references兲 at around 2600 cm−1 is theovertone of the D-band.11D- and 2D-bands are not selective to the CNT diameter. Moreover, 2D-band is the second most intense feature in the DWNT Raman spectra after the G-band, and is observed even when the D-band is absent共in crystalline graphite兲. The D-band can be fitted with a single
Lorentzian line shape 共FWHM of around 60 cm−1兲 in the
range from 1220 to 1380 cm−1. The 2D-band can be fitted
with a single Lorentzian line shape in the range from 2450 to
2700 cm−1 with a FWHM of around 70 cm−1. The integral
intensity ratio of the D- and G-bands, I共D兲/I共G兲, is not more than 0.2. In the same time I共2D兲/I共G兲 varies between 0.8 and 1.0. According to earlier studies of graphene layers Raman spectroscopy can clearly distinguish a single layer, from a bilayer from few 共less than 5兲 layers.17 Apparently, the 2D band is very sensitive to the stacking order of the graphene layers which is controlled by weak van der Waals forces
共0.9% of the sp2 carbon–carbon bond in the plane of the
graphene18兲. In the same time, DWNT Raman spectra show a sharp 2D peak similar to that measured for graphene. There-fore, an inference can be made that the 2D-band can serve as an indicator for the strength of the van der Waals interactions between the nanotubes walls and the filling materials in case of filled DWNTs.
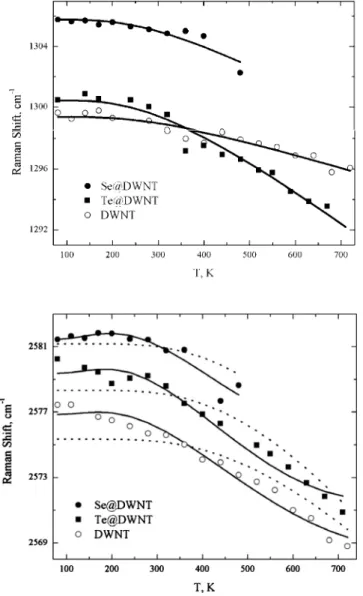
The temperature dependence of the D- and 2D-bands of
filled and empty DWNT is presented in Fig.4. The D-band
temperature data are fit well using the cubic anharmonicity only, Eq. 共1兲, see Fig. 4共a兲. The two fitting parameters ob-tained from each data set are summarized for all filling
ma-terials and compared with empty DWNT in TableII. On the
other hand 2D band temperature dependence data sets can be fit well only if in addition to the cubic anharmonicity a
quar-tic anharmonicity 共four-phonon process兲 is taken into
ac-count, as earlier justified theoretically for the optical phonons
FIG. 3. Temperature dependence of L3 component of the G-band. The sym-bols represent the experimental data and the solid lines are the fit using Eq. 共1兲.
TABLE II. Fitting parameters of the temperature dependence data of the L3 component of the G-band, Eq.共1兲; D-band, Eq.共1兲; and 2D-band, Eq.共2兲.
L3共G-band兲 D-band 2D-band
0 共cm−1兲 C⫾1 共cm−1兲 0 共cm−1兲 C 共cm−1兲 C 共cm−1兲 D 共cm−1兲 Se@DWNT 1602 ⫺14 1314 −9⫾1 −28.0⫾0.6 5.0⫾0.4 Te@DWNT 1600 ⫺13 1312 −11⫾1 −26.5⫾0.4 4.5⫾0.2 PbI2@ DWNT 1598 ⫺12 1310 −8.0⫾0.5 −21.5⫾0.5 3.0⫾0.2 HgTe@DWNT 1601 ⫺15 1307 −6.0⫾0.5 −19.5⫾0.5 3.5⫾0.2 DWNT 1596 ⫺11 1305 −6.0⫾0.5 −19.5⫾0.5 3.0⫾0.5
of Silicon by Balkanski et al.16 Figure 4共b兲 shows the nu-merical fits to the data共solid curves兲 specified by the expres-sion reflecting the contributions of the three-phonon 共cubic anharmonicity兲 and four-phonon processes 共quartic anharmo-nicity兲 to the frequency shift16 applied to the second order band ⍀共T兲 = 20+ 2C
冋
1 + 2 ex− 1册
+ 2D冋
1 + 3 ey− 1+ 3 共ey− 1兲2册
, 共2兲where x, o, and C are explained above, y =ប0/3kBT, if
simple Klemens13approximation for a quartic anharmonicity, and D is a third fitting parameter corresponding to the con-tribution of the quartic anharmonicity. In the above expres-sion,o, C, and D can be associated with either one of the two identical optical phonons contributing to the second or-der 2D band. The values of the fitting parameters for each curve are listed in TableII. The ratio D/C is less than one, in
accordance to the expectation that the four-phonon processes have less contribution compared to the three-phonon pro-cesses. For the fitting procedure of the temperature depen-dence of the 2D band the quasiharmonic frequency obtained from the temperature dependence of the D-band fit was used and fixed. Therefore, again there were only two fitting pa-rameters, the anharmonicity constants C and D.
In all data sets there is a well expressed tendency for the filled DWNT to have larger anharmonicity constants in com-parison to the empty DWNT sample. In agreement with the G-band study, the quasiharmonic frequencies listed in Table
IIare smallest for the empty DWNT共1305 cm−1兲 and largest
for the Se@DWNT 共1314 cm−1兲. In addition, up to 40%
increase in the absolute value of the cubic anharmonicity parameter is observed, suggesting substantially stronger con-tribution to the nanotube phonon decay due to the phonon– phonon interaction between the nanotubes and the filling ma-terial. It is evident that more pronounced anharmonicity is accompanied by a larger quasiharmonic frequency of the specific phonon mode. All parameters are compared to those of empty DWNTs.
In order to estimate the relative strength of the van der Waals interaction between the tube walls and the filling ma-terial we considered a simple one dimensional arrangement of two masses共one being the carbon atom, mc, from the tube
wall, and the other being the atom from the filling material, mf兲 connected with three Hooke’s springs.
19
Each spring constant is proportional to the corresponding bond strength. The spring connected to mcrepresents the C–C bond in the
CNT; the middle spring, k2, represents the interaction be-tween the tube wall and the filling material, and finally, the third spring, k3 represents the bond in the filling material.
Solving the equations of motions for the two masses and finding the normal modes of the system, o, allowed us to express the relative strength of the middle spring, a2= k2/k1
as a2=
冉
02 0DWNT 2 − 1冊
⫻冉
02 0DWNT 2 b − a3冊
冉
0 2 0DWNT2 − 1冊
+冉
0 2 0DWNT2 b − a3冊
, 共3兲 where0DWNT2 = k1/mc; a3= k3/k1; and b = mf/mc.Furthermore, taking into account that
冉
02 0DWNT 2 − 1冊
Ⰶ冉
02 0DWNT 2 b − a3冊
.Equation共3兲can be further approximated to a simple expres-sion that can be used for a relative estimate of the strength of interaction between the tube wall and the filling material
a2⬇
02−0DWNT2 0DWNT2
. 共4兲
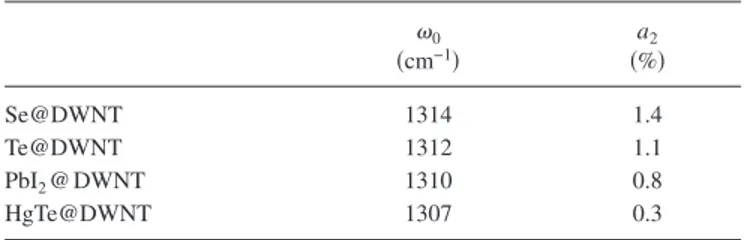
Substituting the quasiharmonic frequencies found from the temperature fit for each filling material,0共see TableII兲,
and using the quasiharmonic frequency obtained for the
empty DWNT 0DWNT= 1305 cm−1, the relative bond
strength between the nanotubes wall and the filling material
FIG. 4. 共a兲 Temperature dependence of the D-band. The symbols represent the experimental data and the solid lines are the fit using Eq.共1兲.共b兲 Tem-perature dependence the 2D-band. The symbols represent the experimental data and the solid lines are the fit using Eq.共2兲, the dashed line represent the fit using Eq.共1兲.
is estimated. The results are summarized in Table III. It can be seen that van der Waals interaction between the Se and Te and the tube walls is stronger than the interaction between the graphene layers in graphite. On the other hand, it appears that HgTe interaction is considerably weaker.
The experimental data reported in this study support strongly the theoretical models20 utilizing the equation of motion method where the phonon Green s function for the nanotube has been calculated taking into account of the phonon–phonon interaction and the electron–phonon interac-tion within the random phase approximainterac-tion. It was estab-lished that stronger phonon–phonon interaction between the localized phonon of the filling material and nanotubes would lead to higher frequency shift in the main resonance mode of the nanotubes.
IV. CONCLUSION
Systematic comparative experimental study共80–700 K兲
of the most prominent Raman bands of Se@DWNT,
Te@DWNT, PbI2@ DWNT, and HgTe@DWNT in powder
form was carried out. The G-band and D-band temperature shifts are satisfactory described with cubic anharmonicity only. The interactions between the filling material and the tube walls have been shown not to be important for the G-band Raman spectra. The 2D-band temperature depen-dence can be fit only if in addition to the cubic anharmonic-ity, a quartic anharmonicity is included. In addition, the an-harmonicity analysis of the temperature data allowed us to determine the quasiharmonic frequency for the disorder in-duced Raman mode which we used to estimate the relative strength of interaction between the CNT walls and the filling materials. The interaction decreases in the following order:
Se@DWNT; Te@DWNT; PbI2@ DWNT, and
HgTe@DWNT. It was established that the anharmonicity pa-rameters of the D- and 2D-bands decrease in the same order too. The 2D band proved to be the most sensitive indicator for the presence and the type of the filling material in the Raman spectrum of DWNTs.
ACKNOWLEDGMENTS
M.S. wants to thank Professor H. Sendov and Professor G. Ruppeiner for the helpful discussions. E.F. thanks Dr. J. Sloan and L. Datas for the HRTEM. The work is done with the ARL financial support under Grant No. W911NF-09-2-0004.
1E. Flahaut, J. Sloan, S. Friedrichs, A. I. Kirkland, K. S. Coleman, V. C.
Williams, N. Hanson, J. L. Hutchison, and M. L. H. Green,Chem. Mater.
18, 2059共2006兲.
2R. Carter, J. Sloan, A. I. Kirkland, R. R. Meyer, P. J. D. Lindan, G. Lin,
M. L. H. Green, A. Vlandas, J. L. Hutchison, and J. Harding,Phys. Rev. Lett.96, 215501共2006兲.
3E. Flahaut, R. Bacsa, A. Peigney, and Ch. Laurent, Chem. Commun.
共Cambridge兲2003, 1442.
4M. Sendova, L. Datas, and E. Flahaut,J. Appl. Phys.105, 094312共2009兲. 5M. Sendova and E. Flahaut,J. Appl. Phys.103, 024311共2008兲. 6A. Bassil, P. Puech, L. Tubery, W. Bacsa, and E. Flahaut,Appl. Phys. Lett.
88, 173113共2006兲.
7http://www.photon.t.u-tokyo.ac.jp/~maruyama/kataura/kataura.html 8A. Jorio, A. G. Souza Filho, G. Dresselhaus, M. S. Dresselhaus, A. K.
Swan, M. S. Unlü, B. B. Goldberg, M. A. Pimenta, J. H. Hafner, C. M. Lieber, and R. Saito,Phys. Rev. B65, 155412共2002兲.
9M. V. Chernysheva, E. A. Kiseleva, N. I. Verbitskiia, A. A. Eliseev, A. V.
Lukashin, Y. D. Tretyakov, S. V. Savilov, N. A. Kiselev, O. M. Zhigalina, A. S. Kumskov, A. V. Krestinin, and J. L. Hutchison,Physica E 共Amster-dam兲40, 2283共2008兲.
10Y. Maniwa, R. Fujiwara, H. Kira, H. Tou, H. Kataura, S. Suzuki, Y.
Achiba, E. Nishibori, M. Takata, M. Sakata, A. Fujiwara, and H. Sue-matsu,Phys. Rev. B64, 241402共R兲 共2001兲.
11M. S. Dresselhaus and P. C. Eklund,Adv. Phys.49, 705共2000兲. 12L. Ci, Z. Zhou, L. Song, X. Yan, D. Liu, H. Yuan, Y. Gao, J Wang, L. Liu,
W. Zhou, G Wang, and S. Xie,Appl. Phys. Lett.82, 3098共2003兲.
13P. G. Klemens,Phys. Rev.148, 845共1966兲.
14T. R. Hart, R. L. Aggarwal, and B. Lax,Phys. Rev. B1, 638共1970兲. 15R. A. Cowley, J. Phys.共Paris兲 26, 659 共1965兲.
16M. Balkanski, R. F. Wallis, and E. Haro,Phys. Rev. B28, 1928共1983兲. 17A. C. Ferrari, J. C. Meyer, V. Scardaci, C. Casiraghi, M. Lazzeri, F. Mauri,
S. Piscanec, D. Jiang, K. S. Novoselov, S. Roth, and A. K. Geim,Phys. Rev. Lett.97, 187401共2006兲.
18M. Schabel and J. L. Martins,Phys. Rev. B46, 7185共1992兲. 19To be published.
20S. M. Bose, S. N. Behera, S. N. Sarangi, and P. Entel,Physica B351, 129
共2004兲. TABLE III. Quasiharmonic frequency and estimated relative strength of the
van der Waals interaction for each material as percent from the C–C bond in the plane of a grapheme sheet
0 共cm−1兲 a2 共%兲 Se@DWNT 1314 1.4 Te@DWNT 1312 1.1 PbI2@ DWNT 1310 0.8 HgTe@DWNT 1307 0.3