Biological Journal of the Linnean Society, 2018, XX, 1–16. With 6 figures.
*Corresponding author. Johan.Michaux@uliege.be
Genetic structure of a European forest species, the
edible dormouse (Glis glis): a consequence of past
anthropogenic forest fragmentation?
J. R. MICHAUX
1,2,, H. HÜRNER
1, B. KRYSTUFEK
3, M. SARÀ
4, A. RIBAS
5, T. RUCH
6,
V. VEKHNIK
7and S. RENAUD
81
Conservation Genetics Laboratory, Institut de Botanique, Chemin de la Vallée, 4, 4000 Liège, Belgium
2CIRAD/INRA UMR117 ASTRE, Campus International de Baillarguet, 34398 Montpellier Cedex 5,
France
3
Slovenian Museum of Natural History, Presernova 20, SI-1000 Ljubljana, Slovenia
4Dipartimento STEBICEF, Via Archirafi, 18-90123 Palermo, Italy
5
Museu de Granollers-Ciències Naturals C/Francesc Macià, 51 08402 Granollers, Spain
6
Institute for Cell Biology and Neuroscience, Johann Wolfgang-Goethe Universität Frankfurt am Main,
AK NCR, Siesmayerstr. 70, D-60054 Frankfurt am Main, Germany
7
445362 Zhiguli State Nature Reserve, Bakhilova Polyana Village, Samara Oblast, Russia
8Laboratoire de Biométrie et Biologie Evolutive, UMR 5558, Université Lyon 1, CNRS, 69622
Villeurbanne, France
Received 17 July 2018; revised 8 October 2018; accepted for publication 8 October 2018
The genetic structure of forest animal species may allow the spatial dynamics of the forests themselves to be tracked. Two scales of change are commonly discussed: changes in forest distribution during the Quaternary, due to glacial/ interglacial cycles, and current fragmentation related to habitat destruction. However, anthropogenic changes in forest distribution may have started well before the Quaternary, causing fragmentation at an intermediate time scale that is seldom considered. To explore the relative role of these processes, the genetic structure of a forest species with narrow ecological preferences, the edible dormouse (Glis glis), was investigated in a set of samples covering a large part of its Palaearctic distribution. Strong and complex geographical structure was revealed from the use of microsatellite markers. This structure suggests that fragmentation occurred in several steps, progressively splitting the ancestral population into peripheral isolated ones. The fact that this structure postdates post-glacial recolonization, together with dating based on microsatellite data, supports the hypothesis that the differentiation was recent, starting around 9000 years ago, and took place stepwise, possibly up to Medieval times. This complements a classic phylogeographical interpretation based on the effect of past climate change, and supports the role of anthropogenic deforestation as a trigger of recent intraspecific differentiation.
ADDITIONAL KEYWORDS: ABC analysis – early anthropogenic deforestation – forest fragmentation – Gliridae – global change – phylogeography.
INTRODUCTION
Anthropogenic changes to the Earth’s biosphere are now so great and so rapid that the concept of a new geological epoch, the Anthropocene, has been proposed. Its start is commonly attributed to the first increase
of atmospheric CO2 and CH4 concentrations during the 1800s above previous long-term stable values, a view that emphasizes the role of recent anthropogenic changes related to industrialization. Yet, defined by strong human impact on the environment, the Anthropocene might actually have started thousands of years ago (Ruddiman, 2003) as a result of the spread of agriculture and technological innovations in farming that resulted in massive deforestation in several 1.5 1.10 1.15 1.20 1.25 1.30 1.35 1.40 1.45 1.50 1.52 1.54 1.55 1.60 1.65 1.70 1.75 1.80 1.85 1.90 1.95 1.100 1.104
areas (Fairservis, 1971; Hugues, 1975; Thirgood, 1981;
Simmons, 1996).
The impact of humans on the natural fauna might thus be much older than is usually considered when focusing on the effects of industrialization (Martin, 2005) and recent habitat destruction (although these actions are also of great concern because they are ongoing). There is increasing evidence that current habitat fragmentation is strongly affecting the genetic structure of animal populations (Gerlach & Musolf, 2000; Kyle & Strobeck, 2001; Wang & Schreiber, 2001;
Hirota et al., 2004; Keller et al., 2004). In contrast, the potential impact of more ancient anthropogenic changes on the patterns of geographical differentiation o f E u r o p e a n w i l d s p e c i e s r e m a i n s l a r g e l y undocumented. The impact of deforestation (which encompasses habitat loss and fragmentation) can be assumed to be particularly strong for forest animals. Studies on such species could help to decipher the timing and processes relating animal differentiation to anthropogenic changes, although it is often difficult to distinguish between natural climate change and human-induced deforestation.
The edible dormouse (Glis glis) is a good candidate for such a study. Although occasionally gathering food in environments such as orchards (Carpaneto and Cristaldi, 1995), the species relies heavily on food and shelter in mature deciduous woodlands with mast-seeding trees such as beeches (Fagus spp.), oaks (Quercus spp.) and sweet chestnut (Castanea sativa) (Ruf et al., 2006). It is a selective feeder, concentrating on the most nutritious food sources available (Holisova, 1968;
Gigirey & Rey, 1999; Hürner & Michaux, 2009). These specific trophic requirements limit its occurrence to high-diversity environments that provide a continuity of adequate food supplies throughout the year. It may even skip reproduction in years of low food availability (Bieber & Ruf, 2009; Krystufek, 2010, Marteau & Sarà 2015). The edible dormouse is also a gregarious animal with large patch requirements and high habitat fidelity (see Krystufek, 2010). Together, these narrow ecological preferences make it highly sensitive to habitat fragmentation (Mortelliti et al., 2008). Its large distribution area (Fig. 1), from the Baltic Sea in the north to the Mediterranean peninsulas (including Sicily) to the south, and from the Iberian region to the west to Russia and the Black Sea and Caspian coasts to the east (Krystufek, 2010), provides the opportunity to trace on a large geographical scale the potential impact of forest habitat structure on the evolutionary dynamics of the species.
Traditional phylogeographical interpretation would predict a differentiation during glacial/interglacial cycles, leading to the establishment of several main lineages in refuge areas, such as the Mediterranean peninsulas, more than 15 000 years ago. It is from these
refuge areas that populations would have recolonized Northern Europe after the last glacial maximum (see
Taberlet et al., 1998; Hewitt, 1999; Michaux et al., 2003, 2005; Boston et al., 2015).
The phylogeographical structure of the edible dormouse has been assessed by analysis based on
mitochondrial DNA (mtDNA) variation (Hürner
et al., 2010; Naderi et al., 2014). This has revealed several endemic lineages at the southern fringe of its distribution, corresponding to refuge areas, and a recent post-glacial recolonization of most of Eurasia from a single Mediterranean refugium located in the Iberian region or in northern Italy. This led to a very low level of genetic diversity throughout most of the recolonized area. However, the use of detailed molecular markers such as microsatellites may reveal the existence of more recent events.
Using microsatellites on samples covering the whole distribution area of the edible dormouse (Fig. 1), we characterized its genetic structure with the aim to identify (1) whether finer genetic structure can be seen, post-dating the post-glacial recolonization traced by mitochondrial markers, and (2) the main drivers and the timing of such late differentiation (if any).
MATERIAL AND METHODS
SampleSand dna analySiSTissue samples from 395 edible dormice from 47 sampling localities distributed throughout the geographical range of the species were analysed (Supporting Information, Table S1; Fig. 1). These specimens were obtained from collaborators, museums and our own fieldwork. In Belgium, where this species is protected by law, hair samples were collected non-invasively under the authorization of the Ministry of the Environment. All samples used were recent tissue specimens stored in ethanol except for the Hungarian samples which were dried hairs. DNA was isolated using the Qiagen DNeasy Tissue kit following the manufacturer’s instructions. Samples were subject to genotyping at ten microsatellite loci using the multiplex sets defined by Hürner et al. (2009). PCR conditions were as reported by Hürner et al. (2009). Amplified DNA was analysed for length variations on an automated monocapillary ABI PRISM 310 Genetic Analyser (Applied Biosystems) using GENEMAPPER v.4.0 software (Applied Biosystems). To avoid rate errors, the dried hairs were analysed following the methods used for degraded DNA and the ‘multitube’ approach proposed by Taberlet et al. (1996), which requires that three positive PCRs are obtained for each locus and sample to be considered correct. MICRO-CHECKER 2.2.3 (Van Oosterhout et al., 2004) 2.5 2.10 2.15 2.20 2.25 2.30 2.35 2.40 2.45 2.50 2.55 2.56 2.60 2.65 2.70 2.75 2.80 2.85 2.90 2.95 2.100 2.105 2.110 2.111 2.112
was used to detect stutter errors and to estimate the proportion of null alleles at each locus. Genotypes were then corrected accordingly. This method revealed no error rates for the Hungarian samples. Tests for linkage disequilibrium (104 permutations) were also
performed using ARLEQUIN v.3.1, adjusting for multiple tests using sequential Bonferroni correction.
CluSteranalySiS
We applied two complementary Bayesian clustering algorithms, namely STRUCTURE v.2.3.3. (Pritchard
et al., 2000) and GENELAND v.4.0.3 (Guillot et al., 2012), to infer population structure (i.e. the number of clusters, K) and to assign individuals to clusters probabilistically based on each multilocus genotype and, for GENELAND, on each spatial origin. These two approaches assume that populations are panmictic units with distinct allele frequencies.
The estimation procedure consisted of runs using trial values of the number of populations (K) and then comparing the estimated log probability of the data under each K. For STRUCTURE, we conducted a series of independent runs with different proposals for K, testing all values from 1 to 15. Each run used 5 × 10⁶ iterations after a burn-in of 5 × 10⁵, utilizing
a model allowing for admixture and correlated allele frequencies. To ensure convergence of the Markov chain Monte Carlo (MCMC) procedure, we used ten replicates for each value of K and then checked the results visually for consistency. Generally, the number of distinct populations (K) is estimated from the model of K that maximizes the probability of the data, lnP(D), but for complex population structures a modal value of lnP(D) may not be apparent (Rosenberg et al., 2002). In such instances, the value of K at the beginning of a ‘plateau’ of estimates of lnP(D) may be selected as this is the smallest value of K that captures the major Figure 1. Map of sampling localities across the entire distribution range of the edible dormouse. Open circles: sampling localities (codes are given in Supporting Information, Table S1). The shaded zone corresponds to the distribution area of the species (after Krystufek, 2010).
3.5 3.10 3.15 3.20 3.25 3.30 3.35 3.40 3.45 3.50 3.55 3.56 3.60 3.65 3.70 3.75 3.80 3.85 3.90 3.95 3.100 3.105 3.110 3.111 3.112
structure in the data set (Pritchard & Wen, 2003). We also used the ΔK method (Evanno et al., 2005)
implemented with STRUCTURE HARVESTER (Earl
& vonHoldt, 2012) to find the most likely value of K present in the dataset.
The second algorithm, implemented in GENELAND 4.0.3, differs from that of Pritchard et al. (2000)
mainly by explicitly taking into account the spatial dependence of individuals expected for a species whose range is much larger than the average inter-generation movement of individuals. This model assumes no admixture and aims to infer and locate genetic discontinuities between populations in space from individual geo-referenced multilocus genotypes, while taking into account uncertainty in the location of sampled individuals (Guillot et al., 2012). All the parameters (including K) are co-estimated simultaneously by the MCMC algorithm. To optimize estimation of the parameters, a two-step procedure was applied: a first run to infer K and a second run with K fixed at the modal value to estimate the other parameters (mainly assignment of individuals to the inferred populations). The first step was replicated ten times to check for convergence, allowing K to vary from 1 to 15 clusters and using run parameters as follows: 106 MCMC iterations, maximum rate of Poisson
process fixed at 700, maximum number of nuclei in the Poisson–Voronoi tessellation fixed at 500, and an uncertainty associated with the spatial coordinates of 1 km. We used the Dirichlet model of allelic frequencies as this has been demonstrated to perform better than the alternative model (Guillot et al., 2005). We inferred the number of clusters (K) from the modal value of K for these ten runs, and then ran the MCMC procedure again 100 times with K fixed for this value, 1 × 10⁶
MCMC iterations and the other modelling options unchanged. We calculated the mean logarithm of the posterior probability of the data (PPD) for each of the 100 runs and selected the ten runs with the highest PPD. These ten runs were then post-processed (with a burn-in of 3 × 10⁴ iterations) to obtain posterior
probabilities of population membership for each individual.
A visual output of the STRUCTURE and GENELAND results was generated using DISTRUCT (Rosenberg, 2004).
differentiationbetweenpopulationS To determine the level of genetic differentiation at microsatellite loci, Fst (Weir & Cockerham, 1984) values among inferred clusters were calculated. A significance test was performed for Fst values after 104 permutations in ARLEQUIN v.3.1 (Excoffier et al., 2005). To depict the overall relationship among all inferred clusters, we applied derived pairwise values of
Fst to construct a neighbour-joining (NJ) tree with the program NEIGHBOUR in PHYLIP (Felsenstein, 2004). Moreover, to confirm the NJ tree obtained using Fst values, we used the program POPULATIONS 1.2.31 (Langella, 1999) using different genetic distances, the Da index (Nei et al, 1983) and the standard genetic distance Ds index (Nei, 1987). Takezaki & Nei (2008)
suggest using these indices when constructing phylogenetic trees from microsatellite data.
GenetiCdiverSityamonGCluSterSand bottleneCkanalySiS
Allelic richness (Rs) corrected for differences in sample size (fewer than ten samples), observed (Ho) and expected (He) heterozygosity and Fis values were calculated within each inferred cluster using FSTAT v.2.9.3 (Goudet, 2001). The significance of Fis values was assessed by comparing the observed values against distributions obtained by randomization (103 times) and adjusting for multiple tests using
Bonferroni correction.
iSolationbydiStanCeanalySeS
Isolation by distance (IBD) among the identified clusters was tested by comparing pairwise geographical distance (log-transformed) with pairwise genetic distances, estimated as Fst/(1 − Fst) and Rst/ (1 − Rst) using ARLEQUIN and SPAGeDI 1.3 (Hardy & Veekemans, 2002), respectively. IBD was calculated to assess whether genetic differentiation was distributed according to geographical distance.
teStinGalternativeSCenarioSby abC
modellinG
Approximate Bayesian computation (ABC) analyses are useful when investigating complex population genetics patterns based on microsatellite markers (e.g.
Bryja et al., 2010; Sunnåker et al., 2013; Ali et al., 2014;
Olafsson et al., 2014).
A set of different logical scenarios was therefore created (Supporting Information, Fig. S1) and tested using the ABC procedure (Beaumont et al., 2002) in DIYABC v.2.0 (Cornuet et al., 2008, 2014). This analysis allowed us to determine potential relationships among different clusters, which were then interpreted as populations (Fig. S1), and to estimate the timing of their differentiation.
To test alternative sequences of divergence of the different clusters, 17 scenarios were constructed. The first three were based on the topology obtained based on Fst values, and Da and Ds genetic distances. The fourth scenario was constructed according to the progressive relationships among STRUCTURE clusters from the hypothesis of K = 2 to K = 12. 4.5 4.10 4.15 4.20 4.25 4.30 4.35 4.40 4.45 4.50 4.55 4.56 4.60 4.65 4.70 4.75 4.80 4.85 4.90 4.95 4.100 4.105 4.110 4.111 4.112
Thirteen further scenarios were built by rearrangement of branches with the ‘Fst’ scenario (as depicted in Fig. S1) used as a ‘template’, which was modified according to the geographical proximity of the different populations as well as the biology of the species.
For each of these 17 scenarios, 5 × 10⁵ datasets were
simulated to build a reference table. To check if the combination of scenarios and previous distributions of their parameters was able to generate datasets similar to the one observed, a principal components analysis (PCA) was performed on the first 10 000 simulated datasets of the reference table in the space of summary statistics. The reference table was produced and recorded during the first step of ABC analyses. Each row of this table corresponds to a simulated dataset and contains the parameter values used to simulate the dataset and summary statistics computed based on the simulated dataset. Parameter values are drawn from previous distributions (Cornuet et al., 2008). The summary statistics used were based on Fst values, mean numbers of alleles and mean genetic diversity. To determine the most likely scenario among the 17 tested scenarios, normalized Euclidean distances between each simulated dataset of the reference table and the observed dataset were then computed and the 1% closest simulated datasets were used to estimate the relative posterior probability (with 95% confidence intervals) of each scenario based on logistic regression. The most likely scenario had the highest posterior probability and non-overlapping 95% confidence intervals. Finally, the posterior density distributions of the effective population size of each population as well as the split times between them were estimated from the most likely scenario. Power analyses were used to evaluate the level of confidence.
We estimated type-I and type-II errors following
Cornuet et al. (2010), by simulating 500 pseudo-observed datasets displaying properties similar to the observed dataset under the best scenario, and we computed the proportion of cases in which this scenario did not display the highest posterior probability. We estimated the false positive error rate (type-II error) by simulating 500 pseudo-observed datasets under each alternative scenario and computed the proportion of cases in which the scenario with the highest posterior probability was incorrectly selected as the most likely.
The prior distributions of parameters (effective population size, timing of events, chosen mutation model parameters for the microsatellites) used in
the ABC analyses are summarized in Table S2.
These parameters were chosen according to previous studies on Glis (Hürner et al., 2010) as well as general mutation rates for microsatellite markers observed in rodents (Dietrich et al., 1992). Broad intervals were chosen for each parameter, so that uncertainties in
these parameters would not affect the output of the analysis. To estimate the timing of differentiation events, we considered one generation per year, as generally considered for this species (Gazárková & Adamik, 2016).
multivariateanalySiSofmiCroSatellitedata As an alternative means to visualize the relationships among populations, a multivariate analysis was performed on the microsatellite data. A principal coordinates analysis (PCoA) on microsatellite-based distances between individuals was used to extract synthetic axes explaining most of the total variation, without any a priori assumption regarding the structure of the data (Jombart et al., 2009). The analysis was performed using the R package ade4 (Dray & Dufour, 2007).
RESULTS
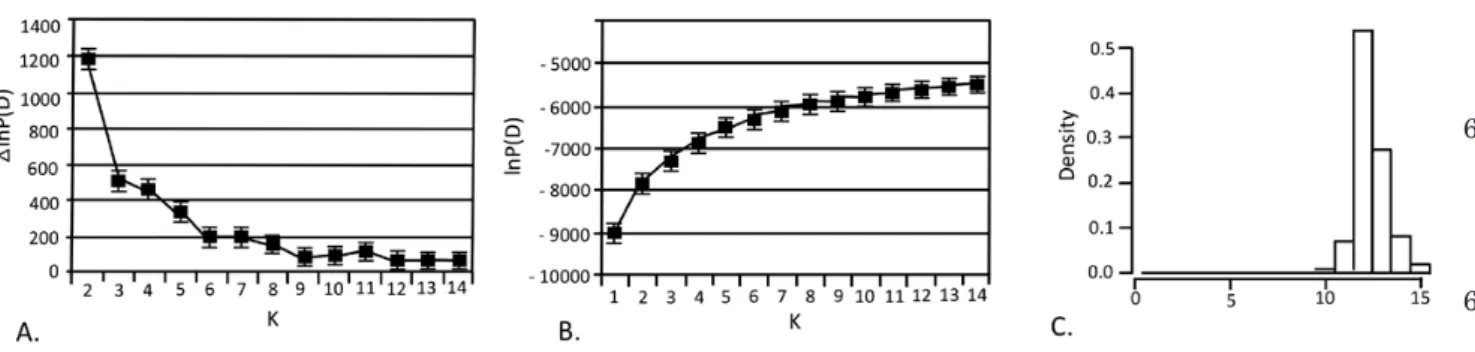
CluSterinGanalySiSUsing STRUCTURE, the increase in likelihood when
K (number of clusters) increases showed several
important steps at K = 2, K = 5, K = 8 and K = 11 (ΔK method, Evanno et al., 2005) (Fig. 2A). This suggests that the populations are hierarchically partitioned into several clusters of genetically similar populations. However, when considering the probability of successive partitions of the data when K increases (Fig. 2B), the estimated likelihood increases progressively and smoothly without reaching a clear plateau. This suggests a complex structure, although on this basis alone it is difficult to select a value of K capturing the major structure in the data, a problem exemplified by the fact that the assignments of the studied specimens when K was varied from 8 to 12 were often unclear (data not shown). The results of GENELAND, which considers the geographical locations of the samples, revealed a clearer picture. Indeed, posterior distributions of the estimated number of inferred clusters across ten replicates displayed a clear mode at K = 12 (Fig. 2C). The probability of membership of all specimens to these 12 clusters was obtained with DISTRUCT based on the highest-probability run (of ten) at that value of K (Fig. 3A). All individuals within each locality had a proportion of assignment to the inferred cluster of 100%, indicating that these results are robust. The geographical distribution of the mean probability per geographical area (Fig. 3B) showed that each cluster includes a set of geographically close populations. The 12 groups of populations corresponding to an individualized genetic cluster are: (1) North-Western Balkans (NWBa: Slovenia, 5.5 5.10 5.15 5.20 5.25 5.30 5.35 5.40 5.45 5.50 5.55 5.56 5.60 5.65 5.70 5.75 5.80 5.85 5.90 5.95 5.100 5.105 5.110 5.111 5.112
Figure 3. A, partitioning of the population structure of the edible dormouse for the modal solution K = 12, based on GENELAND analysis of the microsatellite data. Each individual is represented by a thin vertical line divided into K coloured segments representing the probability of membership of this individual to the K clusters. The different colours represent the different geographical groups emerging from the analysis. Individuals are arranged based on their country of origin and are sorted with increasing latitude. B, geographical representation of the outcomes for 12 genetic clusters (K = 12).
Figure 2. Estimation of the number of populations based on microsatellite data, analysed by STRUCTURE and GENELAND. A, differential variation of the probability of partitions into K and K + 1 clusters (Evanno et al., 2005) obtained with STRUCTURE. Variation is calculated as ∆(lnP(D) = lnP(D)k+1 − lnP(D)k. B, probability of successive partitions of the data into an increasing number of clusters obtained with STRUCTURE. Probability [lnP(D)] is estimated as the mean of ten replicated runs. For both A and B, the variance estimate is represented, which was calculated after five independent runs, using STRUCTURE HARVESTER. C, posterior distributions of the estimated number of inferred clusters across ten replicates obtained with GENELAND, displaying a clear mode at K = 12.
6.5 6.10 6.15 6.20 6.25 6.30 6.35 6.40 6.45 6.50 6.55 6.56 6.60 6.65 6.70 6.75 6.80 6.85 6.90 6.95 6.100 6.105 6.110 6.111 6.112
north-eastern Italy, Croatia), (2) Belgium (BEL), (3) Italian peninsula (IT: north-western, central and southern Italy, Sardinia), (4) Balkans (BAL: Bosnia and Montenegro), (5) Southern Italy (CAL: Calabria), (6) Sicily and Aeolian Islands (SIC), (7) Eastern Europe (EEur: Russia and Latvia), (8) Germany (GER), (9) Northern Spain and French Pyrenees (PYR), (10) Western Central Europe (WCEur: south-east France/ Switzerland), (11) Central Europe (CEur: Hungary, Czech Republic) and (12) South-Eastern areas (SEar: Turkey and Macedonia).
One exception to this geographical congruence emerged, between the genetically identified clusters and the sets of populations: the United Kingdom group (UK) appeared to be associated with the Italian peninsula group IT. This apparent geographical inconsistency is related to the recent artificial introduction of the edible dormouse to Great Britain. Hence, UK samples were not included in subsequent analyses.
differentiationbetweenpopulationS Divergence between populations was estimated first by Fst values (Table S3). All pairwise Fst values were significantly different from zero, indicating that the clusters represented differentiated populations. The highest Fst values were recorded in pairwise comparisons involving northern peripheral populations: Russia/Latvia (EEur: mean Fst = 0.58), Belgium (BEL) (mean Fst = 0.56) and Germany (GER) (mean Fst = 0.45).
NJ analysis (Fig. 4A) based on Fst values provided an assessment of the hierarchical organization of the 12 clusters.
Different genetic groups were resolved. The first included populations from the Mediterranean area: Italian Peninsula (IT, CAL), Sicily (SIC), Balkans (BAL) and South Eastern areas (SEar). The Central European populations (CEur) appeared to be relatively closely related to this group. A set of populations clustered close together at the centre of the tree: North-Western Balkans (NWBa), Western Central Europe (WCEur) and Pyrenees (PYR). The remaining populations diverged from this central group of populations with longer branches: Belgium (BEL) branching close to Pyrenees (PYR) and Western Central Europe (WCEur) populations; Germany (GER)
Figure 4. Phylogenetic relationships between the 12 genetic clusters of edible dormice, estimated by different phylogenetic methods. A, neighbour-joining tree based on pairwise Fst values. B, neighbour-joining tree using the Da
genetic distances index. C, neighbour-joining tree using the standard Ds genetic distance index. Colours are the same as in Figure 3. Values at the nodes in B and C correspond to bootstrap support values calculated with the program POPULATIONS. 7.5 7.10 7.15 7.20 7.25 7.30 7.35 7.40 7.45 7.50 7.55 7.56 7.60 7.65 7.70 7.75 7.80 7.85 7.90 7.95 7.100 7.105 7.110 7.111 7.112
branching together with the North-Western Balkans (NWBa); and Eastern Europe (EEur) comprising a group on its own.
The NJ trees obtained based on Da and Ds distances provided two further topologies, which showed many common features with the Fst-based pattern, but also some noticeable discrepancies. The tree based on Da distances (Fig. 4B) provided clearer support for the association of the westernmost populations (PYR, WCeur, BEL). On this basis, the Mediterranean cluster was split into two clades, one including only animals from the Italian Peninsula (IT and CAL) and the other including apparently disjoint populations (SIC, BAL and EEur). The German (GER) population was associated with the Central European one (CEur). NWBa again appeared close to the centre of the tree. Finally, the tree based on Ds distances (Fig. 4C) was quite similar to that obtained based on Da distances. The Western clade (WEur, PYR and BEL) again emerged and NWBa was close to the centre of the tree as in other topologies; GER was associated with CEur as seen based on Ds distances. Discrepancies were mostly found regarding Southern Europe, with some similarities to the Fst tree and others to the Dst tree. IT and BAL appeared isolated but branched close to the North Western Balkan (NWBa) population. CAL, SIC, EEur and SEar clustered within a clade corresponding to the Southern and Eastern fringe of the geographical range. However, bootstrap values characterizing these last nodes were low and the difference among the trees should be taken with caution.
iSolationbydiStanCe
IBD was not detected among the 12 populations using both Fst and Rst values (R2 = 0.11, P = 0.36; and
R2 = 0.10, P = 0.29, respectively). This suggests that
despite the geographical coherence of the clusters of populations, the genetic structure observed in our dataset cannot be explained merely by geographical distance, but rather corresponds to patches of interconnected populations isolated from each other.
GenetiCdiverSitywithinpopulationS Expected and observed heterozygosity and Fis values were estimated for all populations except Sardinia, which was too poorly sampled (N = 2, Table S1). The majority of the sampled populations conformed to Hardy–Weinberg (HW) equilibrium at most of the loci after sequential Bonferroni correction. The locus/population combinations that were not in HW equilibrium (heterozygote deficiency) were not specific to a particular population or locus. We therefore decided to maintain all of the loci in further analyses. There was no evidence of linkage disequilibrium after
Bonferroni correction. These results confirm that our dataset is compatible with the clustering approach, the assumptions of which require that clusters are sampled from discrete genetic units at HW and linkage equilibrium.
Mean allelic richness (Rs) ranged from 1.8 for BEL to 6 for SIC (Table 1). Average observed heterozygosity within populations varied from 0.14 to 0.63 and expected heterozygosity within populations from 0.18 to 0.75 (Table 1).
multivariateanalySiSofthemiCroSatellite data
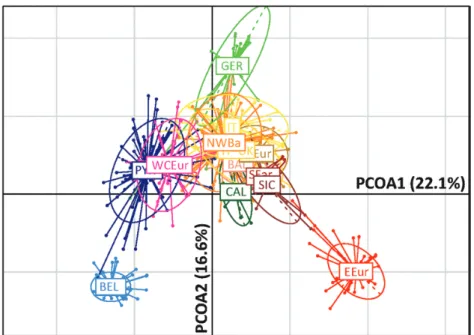
Peripheral populations (BEL, GER and EEur) appeared to be the most divergent on the two principal axes of the PCoA, in total representing more than 38% of the variance (Fig. 5). Furthermore, along the first axis, a gradient emerged contrasting the western (PYR, WCEur and BEL) and eastern groups (EEur as the most extreme; SEar, CAL, SIC and, to a lesser extent, BAL). Geographically intermediate locations were also intermediate along the first PCoA axis (IT close to the UK, CEur and NWBa populations). Overall, the structure that emerged was similar to those retrieved from Fst, Da and Ds distances, but there was differentiation of peripheral populations.
populationhiStoryinferredby abC analySiS The Bayesian approach allowed us to make inferences regarding the reconstruction of population history based on several steps. First, a PCA performed on the first 10 000 simulated datasets of the reference table in the space of summary statistics revealed Table 1. Estimates of multilocus genetic variation for all groups comprising five or more individuals
Group N Rs Ho He Fis BEL 70 1.8 0.18 0.18 0.199 PYR 70 3.6 0.37 0.51 0.283 WCEur 30 3.4 0.45 0.51 0.111 GER 26 2.6 0.23 0.33 0.367 EEur 65 2.2 0.14 0.19 0.255 CEur 10 3.7 0.43 0.56 0.234 CAL 7 5.1 0.51 0.64 0.304 BAL 8 3.6 0.40 0.42 0.059 UK 11 3.4 0.56 0.57 0.122 NWBa 59 3.6 0.41 0.45 0.165 SEar 5 2.0 0.26 0.27 0.012 SIC 19 6.0 0.48 0.75 0.358
N, number of specimens per group; Rs, allelic richness corrected for
sample size; Ho, observed heterozygosity; He, expected heterozygosity; Fis, inbreeding coefficient.
8.5 8.10 8.15 8.20 8.25 8.30 8.35 8.40 8.45 8.50 8.55 8.56 8.60 8.65 8.70 8.75 8.80 8.85 8.90 8.95 8.100 8.105 8.110 8.111 8.112
that the observed dataset was encompassed by simulated datasets, indicating that our model was able to produce datasets similar to the one observed (Fig. S2). The final step of our Bayesian approach was a set of logistic regressions, which were performed on the closest 1% of the simulated datasets. This allowed us to unambiguously distinguish the most likely of the tested scenarios. The observed topology based on Ds distances (i.e. scenario 3 in Fig. 4C) was statistically the most robust, supported by posterior probabilities three times higher than the second ranked scenario, based on Da distances (Ds-based topology: P = 0.579 ± 0.322–0.669 vs. Da-based topology: P = 0.212 ± 0.197–0.265) whereas all other topologies had a P-value < 0.05. (Supporting Information, Fig. S3). Power analyses based on test datasets simulated under the 17 scenarios indicated that, given the size and polymorphism of the dataset, the method has high power to distinguish between the competing scenarios tested. More precisely, we estimated the performance of the analysis: of the thousands of pseudo-observed datasets generated using scenario 3, 46.4% were correctly identified as having been generated under this model. A moderate proportion (10.2%) were incorrectly attributed under scenario 2. The type-II error rate was low for the datasets generated under most scenarios (Table S4).
These results provide estimates of the periods of differentiation (Table S5) that would have led to the present genetic structure of the edible dormouse
(Fig. 6A). Although these estimates should be considered with caution given that the population of origin may not have been panmictic, as postulated in our analyses, they do suggest four successive periods of differentiation, all clearly after the last Ice Age, which corroborates the results obtained with mtDNA (Hürner et al., 2010). These periods are: (1) an initial step of differentiation, at the beginning of
the Holocene (around 9000 years ago), separating four ancestral stocks approximately corresponding to South and East Europe, Balkans, Northern Central Europe, and Central to Western Europe (Fig. 6B);
(2) a succeeding split of these ancestral stocks between 6000 and 7000 years ago, especially affecting North Western Balkans (NWBa) and Eastern areas;
(3) a third phase of differentiation during the Neolithic (between 5000 and 4000 years ago), which drove the separation among (i) populations from Calabria (CAL) and Sicily (SIC), (ii) populations from Germany (GER) and Central Europe (CEur), and (iii) populations from continental Italy (IT) and the Western European clade; and
(4) finally the last period of differentiation during Medieval times (between the 5th and 11th
centuries AD), driving the separation of the Western European group [Belgium (BEL), Pyrenees (PYR), West Central Europe (WCEur)]. Figure 5. Between-group dispersion of the microsatellite data, represented on the first two axes of a PCoA. Ellipses summarize the variation within each of the geographical groups of edible dormice (based on GENELAND analysis, K = 12). The colour code is as for Figures 3 and 4.
9.5 9.10 9.15 9.20 9.25 9.30 9.35 9.40 9.45 9.50 9.55 9.56 9.60 9.65 9.70 9.75 9.80 9.85 9.90 9.95 9.100 9.105 9.110 9.111 9.112
DISCUSSION
The present study represents the most thorough research on the population genetics of the edible dormouse. Previous analyses based on mtDNA (Hürner
et al., 2010; Naderi et al., 2014) have shown a Europe-wide genetic homogeneity for the species, except at the southern fringe of its distribution (Italian peninsula, Sicily, the Balkans, the Middle East, Iran), locations characterized by a slightly higher genetic diversity and which perhaps acted as refuges for this species. Results suggest that Quaternary glaciations led to the differentiation of multiple lineages within this species, as in other rodents such as the hazel dormouse (Muscardinus avellanarius; Mouton et al., 2012, 2016), woodmice (Michaux et al., 2003, 2005; Herman et al., 2017) and bank voles (Deffontaine et al., 2005; Filipi
et al., 2015), but that only lineage contributed to the post-glacial recolonization of the rest of Europe.
Microsatellite markers, having a higher evolutionary rate than mtDNA, have the potential to provide evidence of more recent and precise diversification events. Indeed, beyond the genetic homogeneity within the edible dormouse in most of Europe shown by mtDNA analysis, the present analysis revealed a recent complex evolutionary history. Even allowing for the methodological limits for the estimates of divergence time, the microsatellite results support the hypothesis that the basal divergence between
the Western, Central and Eastern European groups occurred well after the last glacial maximum (22 000– 15 000 years BP) (Fig. 6A; Table 2). Accordingly, we propose the following scenario of genetic differentiation of the edible dormouse populations in Europe. First, an initial split of the main lineages took place during the mid-Holocene (between 9000 and 8000 years BP); second, differentiation in the South-Eastern region between 7000 and 6000 years ago; third a further split in different regions of Europe, including Central and South-Western Europe, occurring between 5000 and 4000 years ago; and finally, a phase of local divergence within Western European regions as late as Medieval times (1500–900 years BP).
The edible dormouse is a thermophilous rodent that is highly dependent on mature deciduous woodlands. As such, it was presumably severely affected by the climatic fluctuations of the Quaternary that drove it from its preferred habitat into a few refugia, namely the classic European refuge areas (Sommer & Nadachowski, 2006) – Iberia, Italian peninsula, the Balkans and the Hyrcanian region – and led to the differentiation of mtDNA lineages (Hürner et al., 2010; Naderi et al., 2014). These southern lineages, however, did not contribute to the recolonization of most of Europe or even Eurasia. Rather, recolonization occurred from a single refuge in the Iberian region or northern Italy, where most mtDNA diversity occurs Figure 6. A, representation of the best scenario corresponding to the neighbour-joining (NJ) tree obtained with Ds values and validated using ABC analyses. Split times corresponding to the mean values of the posterior probabilities (see Table 2) are given at each node. The grey colour corresponds to the first period of diversification (8500–9000 years BP), pink to the second one (6000–7000 years BP), blue to the third one (4000–5000 years BP) and red to the last period of differentiation (900–1500 years BP). B, representation on a European map of the best scenario of splitting events between populations (corresponding to the NJ tree based on Ds values). The four main genetic groups, which differentiated during the first period of diversification (8500–9000 years BP), are represented as shaded rectangles in A and shaded polygons with the same colours in B. The names of the studied populations are also given (BEL, PYR, WCeur, GER, EEur, NWBa, CEur, IT, CAL, SIC, EEur, BAL). Colours are as for Figures 3 and 4.
10.5 10.10 10.15 10.20 10.25 10.30 10.35 10.40 10.45 10.50 10.55 10.56 10.60 10.65 10.70 10.75 10.80 10.85 10.90 10.95 10.100 10.105 10.110 10.111 10.112
today and where those haplotypes characterizing all northern European populations (mtDNA lineage 3) are present (Hürner et al., 2010). In agreement with this, fossil evidence of edible dormice has been recorded in the Iberian Peninsula for the last glacial maximum (Sommer & Nadachowski, 2006). The edible dormouse shows low dispersal and is specialist feeder that is strongly adapted to temperate forests and is temporally and spatially dependent on seed-mast crops (Bieber, 1998; Scinski & Borowski, 2008; Bieber & Ruf, 2009). This specialization may have made it prone to random extinction in an unstable environment such as that of northern Europe at the end of the last glacial maximum, explaining its absence during the coldest periods from almost all regions (Sommer and Nadachowski, 2006).
The timing of differentiation (between 9000 and 4000 years BP) between the southern groups (IT, CAL, BAL, NWBa) based on microsatellite data, as well as their very weak genetic differentiation based on microsatellite markers (see PCoA), however, contradicts with the persistence in these areas of mtDNA genetic lineages inherited during glacial/ interglacial cycles (Hürner et al., 2010).
While the haploid nature and uniparental transmission of mtDNA can contribute to stronger genetic drift at local or regional geographical scales, these results could also be explained in part by female philopatry (Weber et al., 2018) and male-mediated dispersal. Indeed, this can explain the strong structure of female-linked markers, while differentiation of biparentally transmitted loci is homogenized by male-mediated gene flow (Fahey et al., 2014). Therefore, genetic exchange might have occurred among the southern populations soon after the last glacial maximum, blurring the signal of glacial/interglacial structure at the nuclear level, but still maintaining the high mtDNA genetic structure observed in these populations, especially given that mtDNA markers evolve much more slowly than microsatellites. Hence, despite the high Fst values, the observed interpopulation differentiation is quite recent.
CurrentGenetiCStruCtureoftheedible dormouSe: aConSequenCeofearlyhuman
deforeStation?
A striking feature emerging from our results is that all phases of fragmentation between populations of the edible dormouse clearly postdated the last ice age, ranging up to the mid-Holocene and Medieval times. This agrees with the Europe-wide homogeneity evidenced by more slowly evolving markers (mtDNA), which suggest range expansion after the last glacial maximum (Hürner et al., 2010). The relative effects of climate change and human impact on vegetation during the Holocene are difficult to disentangle (Jalut
et al., 2009; Marquer et al., 2017). Climate might have been the primary driver of vegetation changes at the beginning of the Holocene (Jalut et al., 2009; Marquer
et al., 2017), but later, human impact progressively increased (Roberts et al., 2018).
Hence, climate change might at first have favoured an expanded range of the edible dormouse, since the area of forest in Europe was at a maximum during the mid-Holocene thermal optimum (Roberts et al., 2018). Thereafter, the effects of climate change and human activity became intermingled, with increasing human impacts during the Late Holocene (Marquer et al., 2017; Roberts et al., 2018). In particular, the phases of population splits occurring after ~5000 years BP correspond roughly to periods when land use became a major driver of vegetation change (Marquer et al., 2017). Because deciduous forests, the preferred habitat of the edible dormouse, were often associated with land that was suitable for conversion to agriculture (Roberts et al., 2018), they were especially impacted by this increase in human land use.
Human impacts on the distribution of forest occurred in different phases. The Neolithic in Europe, corresponding to the transition from hunter-gatherers to the first farmers, spread from the Near East into south-eastern Europe as early as ~9500 years BP and progressed northward and westward along the Mediterranean coast and across the continent (Danubian stream), a process completed on the continent by 7500–7000 years BP (Zohary & Hopf, 1993; Tresset & Vigne 2011). Splits among edible dormouse populations started around 9000 years BP in south-east Europe, progressing thereafter westward and northward, and these were more complex in areas such as the Balkans, which were affected early during the Neolithic. Overall, this suggests that the isolation of different populations of edible dormice and their progressive genetic differentiation might have been due to a combination of climate change, especially for the early differentiation events, and increasing human impact on the landscape, starting soon after the Neolithic switch to farming practices.
The latest phase of differentiation, corresponding to a split of Western European populations, seems to have occurred during Medieval times, a period known for intense deforestation related to monastic activity (Gimpel, 1976; Dubois, 1989; Bechmann, 1990). Together, the divergence time estimates suggest that early anthropogenic impact might have severely affected the distribution of the edible dormouse. This is corroborated by fossil records for Iberia, which show continuous occupation after its recolonization following the last glacial maximum, but its disappearance as a result of anthropogenic change during the Bronze Age, ~3000 years ago (Cuenca-Bescos et al., 2009). A similarly recent structuring of populations of edible dormice has 11.5 11.10 11.15 11.20 11.25 11.30 11.35 11.40 11.45 11.50 11.55 11.56 11.60 11.65 11.70 11.75 11.80 11.85 11.90 11.95 11.100 11.105 11.110 11.111 11.112
been suggested to have occurred along the Black Sea coast in relation to partly anthropogenic fragmentation of forest habitats (Helvaci et al., 2012).
If confirmed, this dynamic population differentiation linked to forest fragmentation is probably ongoing, as shown by the congruence between the distribution of population clusters of the edible doormouse and areas with remnant patches of primary forests in Europe (Sabatini et al., 2018). The rarity of such preserved habitats may contribute strongly to the rarity of the edible dormouse in the northern part of its distribution, where it is of conservation concern. Three effects may have contributed to the low genetic diversity in these remaining populations: low initial diversity related to post-glacial recolonization from a single source population in peripheral environments; a location at the leading edge of the expansion, which may also explain the lower genetic diversity compared to other populations; and the creation of forest fragments that probably shrank over time in highly populated areas such as Belgium and Germany. Restricted gene flow between populations possibly promoted genetic drift and led to high genetic differentiation among populations (previously unsuspected). However, this fragmentation increased inbreeding, with an associated loss of genetic diversity, reducing the capacity of small, isolated populations to adapt to environmental change (Saccheri et al., 1998; Frankham et al., 2002).
iSlandS: SinkorhotSpotSofdiverSity? Insular populations would appear to be particularly sensitive to extinction and, hence, to be less likely than continental counterparts to survive in the long term, as their genetic diversity is generally lower (Frankham, 1997). Nevertheless, two insular populations included here (Sicily and Great Britain) displayed surprisingly high genetic diversity (Table 1), suggesting unique evolutionary histories for these populations of dormice. The role of human activities is clear for the English population, which comprises specimens that were deliberately introduced at the beginning of the 20th century (Morris, 1997). In
contrast to previous hypotheses, which suggested the origin of this population in Central Europe (Hungary, Germany or Switzerland) (Harris & Yalden, 2008), our results suggest strongly that the origin of these animals is continental Italy. As this last region is considered the main glacial refugium for the species and as it is characterized by having a high level of genetic diversity, it is not surprising that the British population also appears to be genetically diverse.
In Sicily, a high level of genetic diversity is preserved in various species of mammals, and more generally among vertebrates and invertebrates, despite its isolation from the continent (e.g. Michaux et al., 1998,
2003; Nieberding et al., 2006; Stöck et al., 2008). This unique phylogeographical history is related to the Mediterranean Sea, which (1) buffered the impact of the last ice age and allowed the island to play a role as a refugium during the last ice age, and (2) impeded the invasion of many competitors and predators to the island (Michaux et al., 2002). Moreover, for a small rodent like the edible dormouse, the large area of Sicily would be enough to sustain important population sizes and maintain a high level of genetic diversity.
CONCLUSION
The significant role of early human activity on wild fauna has long been appreciated, especially with regard to extinctions of emblematic species such as those belonging to the Pleistocene megafauna (Alroy, 2001; Roberts et al., 2001), but also extinctions of less emblematic taxa of small rodents (Vigne & Valladas, 1996), and even microevolutionary adaptive processes in response to anthropogneic environmental perturbations (Bochaton et al., 2017). The present study further suggests a discrete but decisive early anthropogenic impact on modern faunas, namely of early human-driven deforestation on the genetic structure of a forest species. Increasing evidence indicates that humans strongly impacted their environment much earlier than currently accepted, being responsible in the early Holocene for an increased greenhouse effect (see
Ruddiman, 2003, 2007, 2011) and for distinct landscape modifications (Kaplan et al., 2010; Klein Goldewijk
et al., 2010). The present study suggests another aspect of this ancient anthropogenic impact on wildlife, namely profound changes in the population structure of some mammals, such as the edible dormouse. How this species will be affected by current environmental change remains of debate. Our results emphasize that conservation measures for this species should target connections between areas of deciduous forest to limit the impact of forest fragmentation. However, the edible dormouse may benefit from modern social, political and agricultural trends that are favouring the reforestation of European landscapes (Moreira & Russo, 2007; Sitzia
et al., 2010; Garcia-Feced et al., 2011).
ACKNOWLEDGMENTS
We are grateful to Alec de Selliers de Morenville for financial support that enabled the creation of the bank of microsatellites. We are grateful to the many people who assisted with this study by providing edible dormouse samples from throughout Europe: P. Adamik, A. Arrizabalaga, S. Bertolino, P. Gauberville, R. Libois, P. Morris and P. Vogel as well as P. Chevret 12.5 12.10 12.15 12.20 12.25 12.30 12.35 12.40 12.45 12.50 12.55 12.56 12.60 12.65 12.70 12.75 12.80 12.85 12.90 12.95 12.100 12.105 12.110 12.111 12.112
for numerous discussions. H.H. was supported by a Belgian research fellowship from the FRIA (Fonds pour la Formation et la Recherche dans l’Industrie et dans l’Agriculture) and J.R.M. from the FNRS (Mandat ‘Directeur de Recherches’, Fonds National pour la Recherche Scientifique) and financial grants of the Belgian FNRS (crédits aux chercheurs to J.R.M.), and M.S. from the project supported by the Italian Ministry of Education, University and Research: PRIN 2010/2011 - 20108TZKHC “Climate change and animal populations: predictive models for mammals and birds”. V.A. Vekhnik was funded by a regional grant of the Russian Foundation for Basic Research for Samara oblast according to the research project N 17-44-630288. B.K. acknowledges financial support from the Slovenian Research Agency (research core funding no. P1-0255).
REFERENCES
Ali S, Gladieux P, Leconte M, Gautier A, Justesen AF, Hovmøller MS, Enjalbert J, de Vallavieille-Pope C. 2014. Origin, migration routes and worldwide population genetic structure of the wheat yellow rust pathogen Puccinia striiformis f.sp. tritici. PLoS One 10: e1003903.
Alroy J. 2001. A multispecies overkill simulation of the end-Pleistocene megafaunal mass extinction. Science 292: 1893–1896.
Beaumont MA, Zhang W, Balding DJ. 2002. Approximate Bayesian computation in population genetics. Genetics 162: 2025–2035.
Bechmann R. 1990. Trees and man: the forest in the middle ages. New York: Paragon House.
Bieber C. 1998. Population dynamics, sexual activity, and reproduction failure in the fat dormouse (Myoxus glis). Journal of Zoology 244: 223–229.
Bieber C, Ruf T. 2009. Habitat differences affect life history tactics of a pulsed resource consumer, the edible dormouse (Glis glis). Population Ecology 51: 481–492.
Bochaton C, Bailon S, Herrel A, Grouard S, Ineich I, Tresset A, Cornette A. 2017. Human impacts reduce morphological diversity in an insular species of lizard. Proceedings of the Royal Society B: Biological Sciences 284: 20170921.
Boston ESM, Montgomery I, Hynes WR, Prodöhl PA. 2015. New insights on postglacial colonization in western Europe: the phylogeography of the Leisler’s bat (Nyctalus leisleri). Proceedings of the Royal Society B: Biological Sciences 282: 20142605. Bryja J, Smith C, Konečný A, Reichard M. 2010.
Range-wide population genetic structure of the European bitterling (Rhodeus amarus) based on microsatellite and mitochondrial DNA analysis. Molecular Ecology 19: 4708–4722.
Carpaneto GM, Cristaldi M. 1995. Dormice and man: a review of past and present relations. Hystrix 6: 303–330. Cornuet JM, Pudlo P, Veyssier J, Dehne-Garcia A,
Gautier M, Leblois R, Marin JM, Estoup A. 2014.
DIYABC v2.0: a software to make approximate Bayesian computation inferences about population history using single nucleotide polymorphism, DNA sequence and microsatellite data. Bioinformatics 30: 1187–1189.
Cornuet JM, Ravigné V, Estoup A. 2010. Inference on population history and model checking using DNA sequence and microsatellite data with the software DIYABC (v1.0). BMC Bioinformatics 11: 401.
Cornuet JM, Santos F, Beaumont MA, Robert CP, Marin JM, Balding DJ, Guillemaud T, Estoup A. 2008. Inferring population history with DIY ABC: a user-friendly approach to approximate Bayesian computation. Bioinformatics 24: 2713–2719.
Cuenca-Bescos G, Straus LG, Moralez MRG. 2009. The reconstruction of past environments through small mammals: from the Mousterian to the Bronze Age in El Miron Cave (Cantabria, Spain). Journal of Archaeological Science 36: 947–955.
Deffontaine V, Libois R, Kotlík P, Sommer R, Nieberding C, Paradis E, Searle JB, Michaux JR. 2005. Beyond the Mediterranean peninsulas: evidence of central European glacial refugia for a temperate forest mammal species, the bank vole (Clethrionomys glareolus). Molecular Ecology 14: 1727–1739.
Dietrich W, Katz H, Lincoln SE, Shin HS, Friedman J, Dracopoli NC, Lander ES. 1992. A genetic map of the mouse suitable for typing intraspecific crosses. Genetics 131: 423–447. Dray S, Dufour AB. 2007. The ade4 package: implementing
the duality diagram for ecologists. Journal of Statistical Software 22: 1–20.
Dubois JJ. 1989. Espaces et milieux forestiers dans le Nord de la France. Vol. 2. Étude de biogéographie historique. Thèse d’État, Université Paris-I Panthéon-Sorbonne.
Earl DA, vonHoldt BM. 2012. Structure Harvester: a website and program for visualizing STRUCTURE output and implementing the Evanno method. Conservation Genetics Research 4: 359–361.
Evanno G, Regnaut S, Goudet J. 2005. Detecting the number of clusters of individuals using the software STRUCTURE: a simulation study. Molecular Ecology 14: 2611–2620. Excoffier L, Laval G, Schneider S. 2005. Arlequin (version
3.0): an integrated software package for population genetics data analysis. Evolutionary Bioinformatics Online 1: 47–50. Fahey AL, Ricklefs RE, Dewoody JA. 2014. DNA-based approaches for evaluating historical demography in terrestrial vertebrates. Biological Journal of the Linnean Society 112: 367–386.
Fairservis WA Jr. 1971. The roots of ancient India. New York: MacMillan.
Felsenstein J. 2004. PHYLIP (Phylogeny inference package), Version 3.6. Available at: http://evolution.genetics. washington.edu/phylip.html.
Filipi K, Marková S, Searle JB, Kotlík P. 2015. Mitogenomic phylogenetics of the bank vole Clethrionomys glareolus, a model system for studying end-glacial colonization of Europe. Molecular Phylogenetics and Evolution 82: 245–257. Frankham R. 1997. Do island populations have less genetic
variation than mainland populations? Heredity 78: 311–327.
13.5 13.10 13.15 13.20 13.25 13.30 13.35 13.40 13.45 13.50 13.55 13.56 13.60 13.65 13.70 13.75 13.80 13.85 13.90 13.95 13.100 13.105 13.110 13.111 13.112
Frankham R, Ballou JD, Briscoe DA. 2002. Introduction to conservation genetics. New York: Cambridge University Press. Garcia-Feced C, Saura S, Elena-Rossello R. 2011. Improving landscape connectivity in forest districts: a two-stage process for prioritizing agricultural patches for restoration. Forest Ecology and Management 261: 154–161. Gazárková AH, Adamik P. 2016. Timing of breeding and
second litters in edible dormouse (Glis glis). Folia Zoologica 65: 165–168.
Gerlach G, Musolf K. 2000. Fragmentation of landscape as a cause for genetic subdivision in bank voles. Conservation Biology 14: 1066–1074.
Gigirey A, Rey JM. 1999. Faecal analysis of the edible dormouse (Glis glis) in the northwest Iberian Peninsula. Zeitschrift für Säugetierkunde 64: 376–379.
Gimpel J. 1976. The medieval machine: the industrial revolution of the middle ages. New York: Penguin Books. Goudet J. 2001. FSTAT: a program to estimate and test gene
diversities and fixation indices (version 2.9.3). Available at: http://www2.unil.ch/popgen/softwares/Fstat.htm.
Guillot G, Estoup A, Mortier F, Cosson JF. 2005. A spatial statistical model for landscape genetics. Genetics 170: 1261–1280.
Guillot G, Renaud S, Ledevin R, Michaux J, Claude J. 2012. A unifying model for the analysis of phenotypic, genetic, and geographic data. Systematic Biology 61: 897–911. Hardy OJ, Vekemans X. 2002. SPAGeDi: a versatile computer
program to analyse spatial genetic structure at the individual or population levels. Molecular Ecology Notes 2: 618–620. Harris S, Yalden DW. 2008. Mammals of the British Isles:
handbook, 4th edn. Southampton: The Mammal Society. Helvaci Z, Renaud S, Ledevin R, Adriaens D, Michaux JR,
Çolak R, Kankiliç T, Kandemir I, Yiğit N, Çolak E. 2012. Morphometric and genetic structure of the edible dormouse (Glis glis): a consequence of forest fragmentation in Turkey. Biological Journal of the Linnean Society 107: 611–623. Herman JS, Jóhannesdóttir F, Jones EP, McDevitt AD,
Michaux JR, White TA, Wójcik JM, Searle JB. 2017. Post-glacial colonization of Europe by the wood mouse, Apodemus sylvaticus: evidence of a northern refugium and dispersal with humans. Biological Journal of the Linnean Society 120: 313–332.
Hewitt GM. 1999. Post-glacial re-colonization of European biota. Biological Journal of the Linnean Society 68: 87–112. Hirota T, Hirohata T, Mashima H, Satoh T, Obara Y. 2004.
Population structure of the large Japanese field mouse, Apodemus speciosus (Rodentia: Muridae), in suburban landscape, based on mitochondrial D-loop sequences. Molecular Ecology 13: 3275–3282.
Holisova V. 1968. Notes on the food of edible dormice (Gliridae). Zoologické Listy 17: 109–114.
Hugues JD. 1975. Ecology in ancient civilizations. Albequerque: University of New Mexico Press.
Hürner H, Krystufek B, Sarà M, Ribas A, Ruch T, Sommer R, Ivashkina V, Michaux JR. 2010. Mitochondrial phylogeography of the edible dormouse (Glis glis) in the Western palaearctic region. Journal of Mammalogy 91: 233–242. Hürner H, Martin JF, Ribas A, Arrizabalaga A, Michaux JR.
2009. Isolation, characterization and PCR multiplexing of
polymorphic microsatellite markers in the edible dormouse, Glis glis. Molecular Ecology Resources 9: 885–887.
Hürner H, Michaux JR. 2009. Ecology of the edible dormouse (Glis glis) in a Western edge population in Southern Belgium. Vie et Milieu 59: 243–250.
Jalut G, Deboudat JJ, Fontugne M, Otto T. 2009. Holocene circum-Mediterranean vegetation changes: cl i m a t e f o r c i n g a n d h u m a n i m p a c t . Q u a t e r n a r y International 200: 4–18.
Jombart T, Pontier D, Dufour AB. 2009. Genetic markers in the playground of multivariate analysis. Heredity 102: 330–341.
Kaplan JO, Krumhardt KM, Ellis EC, Ruddiman WF, Lemmen C, Goldewijk KK. 2010. Holocen carbon emissions as a result of anthropogenic land cover change. Holocene Special Issue 21: 775–791.
Keller I, Nentwig W, Largiader CR. 2004. Recent habitat fragmentation due to roads can lead to significant genetic differentiation in an abundant flightless ground beetle. Molecular Ecology 13: 2983–2994.
Klein Goldewijk K, Beusen A, van drecht G, de Vos M. 2010. The HYDE 3.1 spatially explicit database of human-induced global land-use change over the past 12,000 years. Global Ecology and Biogeography 20: 73–86.
Krystufek B. 2010. Glis glis (Rodentia: Gliridae). Mammalian Species 48: 195–206.
Kyle CJ, Strobeck C. 2001. Genetic structure of North American wolverine (Gulo gulo) populations. Molecular Ecology 10: 337–347.
Langella O. 1999. Populations, Ver. 1.2.30. a population genetic software. CNRS UPR9034. Available at: http://bioinformatics. org/~tryphon/ populations/.
M a r q u e r L , G a i l l a r d M - J , S u g i t a S , Po s k a A , Trondman A-K, Mazier F, Nielsen AB, Fyfe RM, Jönsson AM, Smith B, Kaplan JO, Alenius T, Birks HJB, Bjune AE, Christiansen J, Dodson J, Edwards KJ, Giesecke T, Herzschuh U, Kangur M, Koff T, Latałowa M, Lechterbeck J, Olofsson J, Seppä H. 2017. Quantifying the effects of land use and climate on Holocene vegetation in Europe. Quaternary Science Reviews 171: 20–37.
Marteau M, Sarà M. 2015. Habitat preferences of edible dormouse, Glis glis italicus: implications for the management of arboreal mammals in Mediterranean forests. Folia Zoologica 64: 136–150.
Martin PS. 2005. Twilight of the Mammoths: ice age extinctions and the rewilding of America. Berkeley: University of California Press.
Michaux JR, Goüy de Bellocq J, Morand S. 2002. Body size increase in insular rodent populations: a role for predators? Global Ecology and Biogeography 11: 427–436
Michaux JR, Libois R, Filippucci MG. 2005. So close and so different: comparative phylogeography of two closely related rodent species (Apodemus flavicollis and A. sylvaticus) in the Western Palearctic region. Heredity 94: 52–63.
Michaux JR, Magnanou E, Paradis E, Nieberding C, Libois R. 2003. Mitochondrial phylogeography of the Woodmouse (Apodemus sylvaticus) in the Western Palearctic region. Molecular Ecology 12: 685–697.
14.5 14.10 14.15 14.20 14.25 14.30 14.35 14.40 14.45 14.50 14.55 14.56 14.60 14.65 14.70 14.75 14.80 14.85 14.90 14.95 14.100 14.105 14.110 14.111 14.112
Michaux JR, Sara M, Libois RM, Matagne R. 1998. Is the woodmouse (Apodemus sylvaticus) of Sicily really a “separate” species? Belgian Journal of Zoology 128: 211–214. Mondol S, Bruford MW, Ramakrishnan U. 2013. Demographic loss, genetic structure and the conservation implications for Indian tigers. Proceedings of the Royal Society B 280: 20130496.
Moreira F, Russo D. 2007. Modelling the impact of agricultural abandonment and wildfires on vertebrate diversity in Mediterranean Europe. Landscape Ecology 22: 1461–1476. Morris P. 1997. A review of the fat dormouse (Glis glis) in
Britain. Natura Croatica 6: 163–176.
Mortelliti A, Sanzo GS, Boitani L. 2008. Species’ surrogacy for conservation planning: caveats from comparing the response of three arboreal rodents to habitat loss and fragmentation. Biodiversity and Conservation 18: 1131–1145. Mouton A, Krystufek B, Maurizio S, Randi E, Amori G,
Rimvydas J, Grill A, Aloise G, Mortelliti A, Panchetti F, Michaux JR. 2012. Mitochondrial DNA reveals a complex phylogeographic structure of the common dormouse, Muscardinus avellanarius (Rodentia: Gliridae), in Europe. Biological Journal of the Linnean Society 105: 648–664 Mouton A, Mortelliti A, Grill A, Sara M, Krystufek B,
Juškaitis R, Latinne A, Amori G, Randi E, Büchner S, Schulz B, Ehlers S, Lang J, Adamik P, Verbeylen G, Dorenbosch M, Trout R, Elmeros M, Aloise G, Mazzoti S, Matur F, Poitevin F, Michaux JR. 2016. Evolutionary history and species delimitations: a case study of the hazel dormouse, Muscardinus avellanarius. Conservation Genetics 18: 181–196. Naderi G, Kaboli M, Koren T, Karami M, Zupan S,
Rezaei HR, Krystufek B. 2014. Mitochondrial evidence uncovers a refugium for the fat dormouse (Glis glis Linnaeus, 1766) in Hyrcanian forests of northern Iran. Mammalian Biology 79: 202–207.
Nei M. 1987. Molecular evolutionary genetics. New York: Columbia University Press.
Nei M, Tajima F, Tateno Y. 1983. Accuracy of estimated phylogenetic trees from molecular data. II. Gene frequency data. Journal of Molecular Evolution 19: 153–170.
Nieberding C, Libois R, Morand S, Michaux JR. 2006. Parasites and the island syndrome: the colonisation of the Western Mediterranean islands by Heligmosomoides polygyrus (Dujardin, 1845). Journal of Biogeography 10: 1365–1376. Olafsson K, Pampoulie C, Hjorleifsdottir S, Gudjonsson S,
Hreggvidsson GO. 2014. Present-day genetic structure of Atlantic salmon (Salmo salar) in Icelandic rivers and ice-cap retreat models. PLoS ONE 9: e86809.
Petruso D, Sarà M, Surdi G, Masini F. 2011. Le faune a mammiferi della Sicilia tra il Tardoglaciale e l’Olocene. Biogeographia 30: 27–39.
Pritchard JK, Stephens M, Donnelly P. 2000. Inference of population structure using multilocus genotype data. Genetics 155: 945–959.
Pritchard JK, Wen W. 2003. Documentation for STRUCTURE software: Version 2. Available at: http://pritch.bsd.uchicago.edu. Roberts N, Fyfe RM, Woodbridge J, Gaillard MJ,
Davis BAS, Kaplan JO, Marquer L, Mazier F, Nielsen AB, Sugita S, Trondman AK, Leydet M. 2018.
Europe’s lost forests: a pollen-based synthesis for the last 11,000 years. Scientific Reports 8: 716.
Roberts RG, Flannery TF, Ayliffe LK, Yoshida H, Olley JM, Prideaux GJ, Laslett GM, Baynes A, Smith MA, Jones R, Smith BL. 2001. New ages for the last Australian megafauna: continent-wide extinction about 46,000 years ago. Science 292: 1888–1892.
Rosenberg NA. 2004. DISTRUCT: a program for the graphical display of population structure. Molecular Ecology Notes 4: 137–138.
Rosenberg NA, Pritchard JK, Weber JL, Cann HM, Kidd KK, Zhivotovsky LA, Feldman MW. 2002. Genetic structure of human populations. Science 298: 2381–2385. Ruddiman WF. 2003. The anthropogenic greenhouse
era began thousands of years ago. Climatic Change 61: 261–293.
Ruddiman WF. 2007. The early anthropogenic hypothesis: challenges and responses. Reviews of Geophysics 45: 1–37. Ruddiman WF. 2011. Can natural or anthropogenic
explanations of late-Holocene CO2 and CH4 increases be falsified? Holocene Special Issue 21: 865–879.
Ruf T, Fietz J, Schlund W, Bieber C. 2006. High survival in poor years: life history tactics adapted to mast seeding in the edible dormouse. Ecology 87: 372–381.
Sabatini FM, Burrascano S, Keeton WS, Levers C, Lindner M, Pötzschner F, Verkerk PJ, Bauhus J, Buchwald E, Chaskovsky O, Debaive N, Horváth F, Garbarino M, Grigoriadis N, Lombardi F, Duarte IM, Meyer P, Midteng R, Mikac S, Mikoláš M, Motta R, Mozgeris G, Nunes L, Panayotov M, Ódor P, Ruete A, Simovski B, JStillhard J, Svoboda M, Szwagrzyk J, Tikkanen OP, Volosyanchuk R, Vrska T, Zlatanov T, Kuemmerle T. 2018. Where are Europe’s last primary forests? Diversity and Distributions 24: 1426–1439.
Saccheri I, Kuussaari M, Kankare M, Vikman P, Fortelius W, Hanski I. 1998. Inbreeding and extinction in a butterfly metapopulation. Nature 392: 491–494.
Scinski M, Borowski Z. 2008. Spatial organization of the fat dormouse (Glis glis) in an oak–hornbeam forest during the mating and post-mating season. Mammalian Biology 73: 119–127
Simmons IG. 1996. Changing the face of the earth. Oxford: Blackwell.
Sitzia T, Semenzato P, Trentanovi G. 2010. Natural reforestation is changing spatial patterns of rural mountain and hill landscapes: a global overview. Forest Ecology and Management 259: 1354–1362.
Sommer R, Nadachowski A. 2006. Glacial refugia of mammals in Europe: evidence from fossil records. Mammal Review 36: 251–266.
Stöck M, Sicilia A, Belfiore NM, Buckley D, Lo Brutto S, Lo Valvo M, Arculeo M. 2008. Post-Messinian evolutionary relationships across the Sicilian channel: mitochondrial and nuclear markers link a new green toad from Sicily to African relatives. BMC Evolutionary Biology 8: 56.
Sunnåker M, Busetto AG, Numminen E, Corander J, Foll M, Dessimoz C. 2013. Approximate Bayesian computation. PLoS Computational Biology 9: e1002803.
15.5 15.10 15.15 15.20 15.25 15.30 15.35 15.40 15.45 15.50 15.55 15.56 15.60 15.65 15.70 15.75 15.80 15.85 15.90 15.95 15.100 15.105 15.110 15.111 15.112