*Corresponding author: Jiali Jiang, State Key Laboratory of Tree Genetics and Breeding, Research Institute of Wood Industry, Chinese Academy of Forestry, Beijing 100091, P. R. China; and Institute for Building Materials, ETH Zurich, 8093 Zurich, Switzerland, e-mail: [email protected]
Bachtiar Erik Valentine and Peter Niemz: Institute for Building Materials, ETH Zurich, 8093 Zurich, Switzerland
Jianxiong Lu: State Key Laboratory of Tree Genetics and Breeding, Research Institute of Wood Industry, Chinese Academy of Forestry, Beijing 100091, P. R. China
Jiali Jiang*, Bachtiar Erik Valentine, Jianxiong Lu and Peter Niemz
Time dependence of the orthotropic compression
Young’s moduli and Poisson’s ratios of Chinese fir
wood
DOI 10.1515/hf-2016-0001
Received January 3, 2016; accepted April 28, 2016; previously published online May 26, 2016
Abstract: The time dependency of the orthotropic
com-pliance for Chinese fir wood [Cunninghamia lanceolata
(Lamb.) Hook] has been investigated by performing
com-pressive creep experiments in all orthotropic directions.
Time evolution of the creep strain in the axial and lateral
directions was recorded by means of the digital image
correlation (DIC) technique, to determine the diagonal
and nondiagonal elements of the viscoelastic compliance
matrix. The results reveal the significant influence of time
on the mechanical behavior. The orthotropic nature of the
viscoelastic compliance is highlighted by the different time
dependency of the Young’s moduli and the Poisson’s ratios
obtained for the individual directions. Differences among
the time-dependent stress-strain relationship determined
at the 25, 50, and 75% stress levels indicate that the
vis-coelastic behavior of wood is also load-dependent. A
Pois-son’s ratio values, which are increasing with time in ν
LR,
ν
LT, ν
RT, ν
TR, and decreasing in ν
RLand ν
TL, demonstrate that
the creep strain is influenced by loading directions. The
substantially different time dependency of the
nondiago-nal elements of the compliance matrix further reveals the
orthotropic compliance asymmetry and emphasizes the
complexity of the viscoelastic character of wood.
Keywords: axial strain, Chinese fir wood, compressive
creep test, lateral strain, orthotropic viscoelasticity,
Poisson’s ratios, stress level, time dependence, Young’s
moduli
Introduction
Wood cell wall can be regarded as a two phase composite
of elastic highly organized fibrils of cellulose surrounded
by an amorphous and viscoelastic lignin-hemicellulose
matrix. This implies that its mechanical behavior depends
on both elastic and viscous (time-dependent) properties
(Schniewind and Barrett 1972; Lakes 2009). Wood is an
orthotropic and anisotropic material and its viscoelastic
properties are significantly influenced by grain
orienta-tions (Backman and Lindberg 2001; Mano 2002; Jiang and
Lu 2009; Ozyhar et al. 2013a). For a numerical simulation
of the time-dependent behavior of wood, viscoelastic
properties have to be known. Numerous investigations
have been carried out by considering the time-dependent
characteristics of wood and wood composites (Dlouha
et al. 2009; Engelund and Svensson 2011; Engelund and
Salmén 2012; Chang et al. 2013; Violaine et al. 2015).
Numerical implementations that take into account
the anisotropic viscoelastic nature of wood were also
addressed (Hanhijärvi 1995; Schmidt and Kaliske 2004;
Vidal-Sallé and Chassagne 2007; Taniguchi et al. 2010;
Hassani et al. 2015). Viscoelastic material properties are
generally determined either in creep or in stress
relaxa-tion experiments. In the present paper the focus is on the
creep behavior.
According to Hunt (1999), wood creep has three
com-ponents, which can be influential at the same time: (1)
Pure viscoelastic component (time-dependent creep),
is a time-dependent function of the material under
con-stant environmental conditions; (2) the mechano-sorptive
creep, which is associated with transient moisture content
(MC) changes under mechanical loading (Grossman 1976);
(3) pseudo creep and recovery phenomenon, which is
manifested during continued moisture cycling and it
becomes visible in the increased creep deflection during
desorption and decreased deflection during adsorption.
Though interaction among these components complicates
the situation, the individual components has to be
char-acterized to understand the time-dependent creep effects
(Ozyhar et al. 2013a).
A lot of investigations concentrated on the
experimen-tal determination and analytical expressions of the
mech-ano-sorptive creep (Mukudai and Yata 1988; Hunt 1989;
Toratti and Svensson 2000; Navi et al. 2002; Takahashi
et al. 2004, 2005, 2006; Dong et al. 2010; Kaboorani et al.
2013; Violaine et al. 2015). However, the pure visco elastic
creep is usually neglected in numerical models and
received much less attention compared to the
mechano-sorptive effects (Liu 1993). This component, however, is
needed not only for a full description of the
time-depend-ent material behavior under constant climatic conditions,
but also for the determination of the components
concern-ing the mechano-sorption, the pseudo creep, and
recov-ery (Hering and Niemz 2012).
According to Ozyhar et al. (2013a), the
determina-tion of the pure viscoelastic component is especially time
consuming. The separation of the pure viscoelastic and
mechano-sorptive creep component is difficult and the
experiments with this regard have to be performed under
strictly constant environmental conditions. Even small
fluctuations in MC lead to a merging of the two
compo-nents and aggravate a clear analysis. The pure viscoelastic
creep component were analyzed by Schniewind and
Barrett (1972), Hayashi et al. (1993), and Taniguchi et al.
(2010). Only a few studies focused on selected
time-dependent parameters. The elastic properties are
pre-sented as a full compliance matrix (Bucur and Archer
1984; Keunecke et al. 2008; Hering et al. 2012; Ozyhar
et al. 2012, 2013b,c), but the viscoelastic characterization
of the orthotropic compliance, including the time
func-tions for all compliance parameters, is only attempted by
Ozyhar et al. (2013a). Generally, the lack of knowledge of
the time-dependent behavior of the Poisson’s ratios
par-ticularly inhibits the determination of the nondiagonal
elements of the viscoelastic compliance matrix of wood.
Some reports proved experimentally that Poisson’s ratios
are time dependent (Schniewind and Barrett 1972;
Tanigu-chi and Ando 2010; TaniguTanigu-chi et al. 2010), but many
con-tradictory results caused confusion with this regard.
The intention of the present study is to investigate the
time-dependent pure creep behavior of wood within the
framework of linear viscoelasticity. Compressive creep
experiments should be performed on Chinese fir wood
in all orthotropic directions at three stress levels.
Time-dependent Young’s moduli and Poisson’s ratios will be
observed by digital image correlation (DIC) as a function
of time of the strain in the axial and lateral directions.
By determining the viscoelastic compliance matrix, the
following topics will be addressed: (1) The pure creep
behavior in the three orthotropic directions; (2) The time
function on the diagonal and nondiagonal elements of the
r=42 mm 11 mm 95 mm 14 mm R L T 28 mm 28 mm
Figure 1: Dog-bone shaped specimen for creep experiments. Figure represents a specimen with a high contrast random speckle pattern and the loading axis in the R direction (all dimensions in mm), [Ozyhar et al. (2013a)].
viscoelastic compliance matrix, including Young’s moduli
and Poisson’s ratios; (3) Influence of stress levels on the
pure creep behavior.
Materials and methods
Chinese fir [Cunninghamia lanceolata (Lamb.) Hook] plantation wood was tested. The average wood density, determined at 20°C and a rela-tive humidity (RH) of 65% amounted to 323 kg m-3 and the MC was
12.2%. The clear specimens were cut from the heartwood part of a same trunk. Intrinsic knots and defects were excluded.
Dog-bone shaped specimens, as displayed in Figure 1, were tested. The cuboid profile in the cross section of the specimen allows for the simultaneous measurement of lateral strains in two separate directions and is suitable to determine two Poisson’s ratios on one specimen. All specimens were conditioned in climatic chambers at 20°C and 65% RH within 6 weeks until equilibrium moisture content (EMC) was reached. Specimens with the same dimensions were pre-pared for all orthotropic directions: L- longitudinal, parallel to the grain direction, R- radial, perpendicular to the growth rings, T- tan-gential to the growth rings. The time consuming nature of the experi-mental setup inhibited testing a large number of specimens: the data were obtained from a total of 27 specimens for the orthotropic direc-tions L, R, and T and the stress levels of 25, 50, and 75%.
A high-contrast random dot texture (“speckle pattern”), as described in Keunecke et al. (2008), was sprayed on two adjacent sides of the waisted specimen section (11 × 14 mm2, Figure 1). An airbrush gun
(Harder & Steenbeck, Germany) and finely pigmented acrylic paint (Airbrush, Pro-color by NANSA, USA) was used to obtain very fine speckles with a high-resolution pattern. First, a white ground coat and then black speckles were applied, resulting in a speckle pattern of het-erogeneous gray values. These patterns are needed for the evaluation
of strains at the specimen surface during compression creep tests by means of the DIC software. Before creep testing, the specimens with speckle pattern were conditioned at 20°C and 65% RH for a period of 4 weeks, allowing for the equilibration of the painting effect.
The uniaxial compressive creep tests were carried out in a cli-matic room (20°C, 65% RH). A constant MC of the specimens was ensured by controlling the temperature and RH over the entire test duration, and the possible stress induced MC change due to cou-pling effects was neglected. To exclude mechano-sorptive effects, i.e. increased creep due to variations in MC during loading, experiments were performed on specimens previously preconditioned under test-ing conditions and reached the EMC state.
Instrument for creep experiments: Zwick Z010 testing machine (Zwick/Roell, Germany) with a 10 kN loading cell. The testing proce-dure consisted of the initial loading phase (displacement controlled test) and the creep phase (force controlled test under constant load). The first one was carried out with a constant loading rate of 0.05 mm min-1. The resulting loading time was dependent both on the loading
direction and the applied creep load level and varied between 210 and 390 s. The creep phase lasted for 24 h starting from the point when the predefined creep load was reached. The creep load applied was adjusted to the grain orientation directions. The load levels were set at 25, 50, and 75% of the yield stress (the stress at 0.2% plastic strain), respectively, for both the R and T directions. As for L direction, the load levels were set at 25, 50, and 75% of the ultimate stress (see Table 1).
A DIC technique (Vic-2D, Correlated Solutions, USA) was used to capture the strains during the creep experiments as suggested by Ozyhar et al. (2013a). It provides high measurement accuracy that allows for simultaneous capture of the axial and lateral strains, and therefore ensures the determination of both the Young’s moduli and the time-dependent Poisson’s ratios. A multiple camera system ( Schneider, Germany) with a resolution of 2048 × 2048 pixels was applied to capture the images needed for the strain evaluation. Two cameras enabled the simultaneous measurement of the lateral strains in two directions on one specimen, which therefore allowed the determination of two cor-responding Poisson’s ratios from one measurement.
Images were recorded with a pair of charge coupled device (CCD) digital cameras. Snapshots were taken every 3 min over the
Table 1: Creep load levels for Chinese fir wood in all orthotropic directions.
Stress levels
Creep load (MPa)
σL (Ultimate
stress: 26.2) σR (Yield stress: 3.0) σT (Yield stress: 2.3)
25% 6.5 0.8 0.6
50% 13.1 1.5 1.1
75% 19.5 2.2 1.7
L, longitudinal; R, radial; T, tangential.
creep experiments period, which gave a total of 480 images per camera for the creep phase and, depending on the preloading time, and additional 14–26 pictures for the loading phase (snapshots were taken every 15 s), which were required for the determination of the instantaneous Young’s moduli and Poisson’s ratios. The time evolu-tion of the strains was calculated by correlating the recorded images of the deformed pattern to that in the undeformed state, i.e. the first image taken just before the start of the loading phase. Per definition, the increasing strain values correspond to the elongation, and the decreasing values to the contraction of the specimen.
Viscoelastic compliance matrix: According to Ozyhar et al. (2013a), derived from the linear viscoelastic theory, the stress-strain relationship for wood under creep at constant environmental condi-tions can be written as
ε = 0σ +φ
total Ds (1 ( ))t (1)
Where εtotal is the total creep strain, D is the steady-state elastic 0s
compliance, σ is the stress and φ(t) is the time-dependent relative creep function expressed by the quotient of the creep εc(t) and the
elastic εel strain is λ ε φ ε = = -c 0 ( ) (1- ) ( ) t c el s t D e t D (2)
Where Dc is the creep compliance, λ is the delay time.
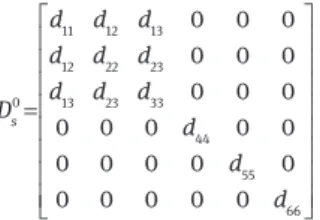
Based on the orthotropic material behavior assumed for wood (Bodig and Jayne 1982), the 0
s
D written in the matrix form becomes
11 12 13 12 22 23 0 13 23 33 44 55 66 0 0 0 0 0 0 0 0 0 0 0 0 0 0 0 0 0 0 0 0 0 0 0 0 s d d d d d d d d d D d d d = (3)
whereby the diagonal elements dii of the compliance matrix are
denoted as
-1 -1 -1 -1 -1 -1
11 L; 22 R; 33 T; 44 LR; 55 LT; 66 RT
d E d E d E d G d G d G= = = = = = (4)
and the nondiagonal elements dij (i≠j) as
12 22 21 11 13 33 31 11 23 33 32 22 - ; - ; - ; - ; - ; -LR RL LT TL RT TR d v d d v d d v d d v d d v d d v d = ⋅ = ⋅ = ⋅ = ⋅ = ⋅ = ⋅ (5)
where E, ν, and G are for the Young’s modulus, the Poisson’s ratio, and the shear modulus, respectively. The lower case indices indicate the L, R, and T directions, respectively. The symbols L-R, L-T, R-T, R-L, T-R and T-L are for the corresponding planes.
The creep behavior can be expressed according to Ormarsson et al. (2010) by the creep compliance matrix Dc
-1 -1 -1 -1 -1 -1 -1 -1 -1 -1 -1 -1 ( ) - ( ) - ( ) 0 0 0 - ( ) ( ) - ( ) 0 0 0 - ( ) - ( ) ( ) 0 0 0 ( ) 0 0 0 ( ) 0 0 0 0 0 0 ( ) 0 0 0 0 0 0 ( ) L L R LR LR T LT LT L RL RL R R T RT RT T TL TL R TR TR T T c LR LR LT LT RT RT E t E t E t E t E t E t E t E t E t D t G t G t G t φ ν φ ν φ ν φ φ ν φ ν φ ν φ φ φ φ φ = (6)
The instantaneous Young’s moduli Ei were defined by the effec-tive modulus obtained from the ratio of the change in stress Δσ to the strain-change Δε determined from the stress-strain diagram in the loading phase 0 0 ( ) ( ) i, with i i i E t E t σ i R,L,T t t ε ∆ = = ∈ ≤ ∆ (7)
where t0 is the end of loading phase and the beginning of creep phase.
The instantaneous Poisson’s ratios, given by the negative ratio of the passive (lateral) strain εi to the active (axial) strain εj at the time
t0, which were determined from the linear regression of the
passive-active strain diagram in the linear elastic range, by simultaneous measuring the strain in the axial and lateral directions during the loading phase: 0 0 ( ) ( ) - , i , , and with ij ij j v t v t ε i R L T i j t t ε = = ∈ ≠ ≤ (8)
The time-dependent Young’s modulus Ei (t) was obtained from the
time evolution of the creep strain in the loading direction εi(t) and the
creep stress σi given in Table 1.
0 ( ) with ( )i i i E t t t t σ ε = > (9)
The time-dependent Poisson’s ratios vij(t) were determined by meas-uring the strain in the axial and lateral directions as a function of time 0 ( ) ( ) - i( )with ij j t v t ε t t t ε = > (10)
In order to compare the time effect on the different Young’s moduli and Poisson’s ratios, the experimental values for E(t) and ν(t) determined on varying specimens were normalised according to
0 0
( ) ( )
( ) E t( ), ( ) v t( )
E t =E t ν t=v t (11)
Results and discussion
Time-dependent of the orthotropic Young’s
moduli
Table 2 summarises the instantaneous Young’s modulus
E(t
0) and the values determined after 24 h creep test E(t
24)
for the individual orthotropic directions at three stress
levels. The variability of results was calculated based
on the coefficient of variation (COV) obtained from the
average of three specimens for each test conditions. The
relatively higher values of error are due to the high natural
variability of the mechanical properties of wood (Bodig
and Jayne 1982).
To compare the time evolution of the Young’s moduli
within and between the individual orthotropic directions
and the values obtained at three stress levels, the
time-dependent moduli E(t) were normalised according to
Eq. (11). The results show that Young’s moduli exhibit a
decreasing trend with time and that the creep behavior
highly depends on the orthotropic direction and stress
levels (Figure 2). The normalised Young’s moduli ( )
E t
(clearly reveals that data in the R and T directions (E
R, E
T)
are decreasing with time to a significantly higher extent
than those in the L direction E
L. ( )
E t
R
is more affected
than
E t
T
( ).
Tracheids orientation in the L direction is
the reason for higher E
Ldata, and in the case of E
Rand E
Tthe data are proportional to the density (Keunecke et al.
2007; Gonçalves et al. 2011). Consequently, Chinese fir
wood with its low density shows a tendency to smaller
R and T stiffnesses and, therefore, larger differences are
seen between ( )
E t in longitudinal and transverse
direc-tions. One should keep in mind that in the dog-bone
shaped samples of the Chinese fir wood the earlywood
region within a growth ring was large, which was
prob-ably leading to the lower Young’s moduli in R direction
than that in T direction. Figure 2 also reveals that the time
effect highly depends on the stress level in all directions.
Increasing loading level deteriorated the Young’s moduli,
which decreased with time. The E
R(t) and E
T(t) data
indi-cate that the moduli determined at 75% stress level are
affected by the time by about twice as much as the moduli
obtained at the 25% stress level. A similar trend applies for
the E
L(t), even though not as pronounced as in the R and
T directions. The observed differences with this regard are
corroborated by the different time evolution of the axial
strain (Figure 3). The higher the stress level, the larger
axial strain is found in all directions.
Time-dependent of the Poisson’s ratio
Table 2 summarises the instantaneous Poisson’s ratios
ν(t
0) and the values determined after 24 h creep test ν(t
24) for
the individual orthotropic planes. Similar to the Young’s
moduli, there is a relatively high data scatter, which is
especially striking for the ν
RLand ν
TL, and which is
attrib-utable to the high natural variability of wood. A similar
high variability of the Poisson’s ratios was observed for
European beech wood (Hering et al. 2012; Ozyhar et al.
2012, 2013a). The results presented in Table 2 also indicate
that the data are independent of the stress level.
The normalized Poisson’s ratios ( )
v t are also time
dependent and this behavior strongly influenced by the
orthotropic direction and load level (Figure 4). The
Pois-son’s ratios of L-loaded specimens (ν
RLand ν
TL) are affected
by time to a much higher extent than those loaded in R
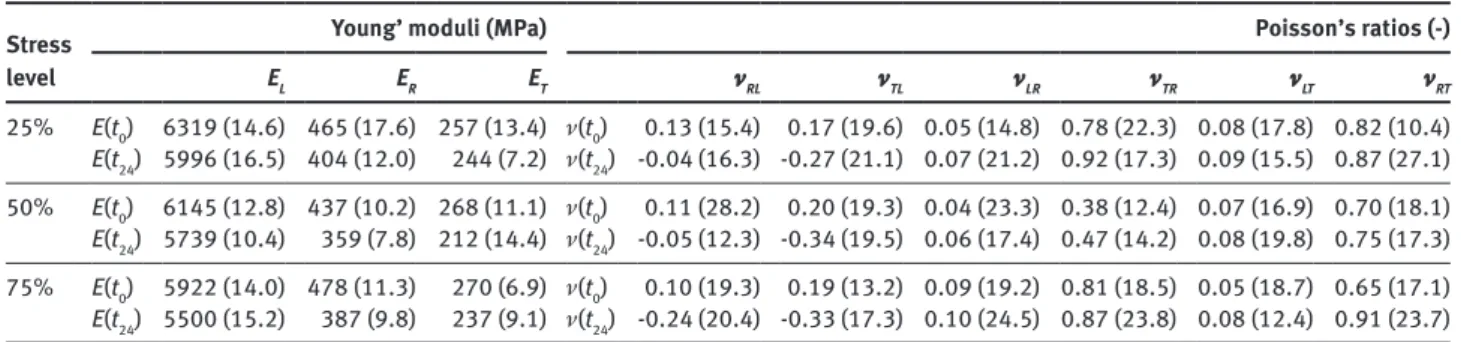
Table 2: Time dependency of the Young’s moduli and Poisson’s ratios for Chinese fir wood in all orthotropic directions. Stress
level
Young’ moduli (MPa) Poisson’s ratios (-) EL ER ET νRL νTL νLR νTR νLT νRT 25% E(t0) 6319 (14.6) 465 (17.6) 257 (13.4) ν(t0) 0.13 (15.4) 0.17 (19.6) 0.05 (14.8) 0.78 (22.3) 0.08 (17.8) 0.82 (10.4) E(t24) 5996 (16.5) 404 (12.0) 244 (7.2) ν(t24) -0.04 (16.3) -0.27 (21.1) 0.07 (21.2) 0.92 (17.3) 0.09 (15.5) 0.87 (27.1) 50% E(t0) 6145 (12.8) 437 (10.2) 268 (11.1) ν(t0) 0.11 (28.2) 0.20 (19.3) 0.04 (23.3) 0.38 (12.4) 0.07 (16.9) 0.70 (18.1) E(t24) 5739 (10.4) 359 (7.8) 212 (14.4) ν(t24) -0.05 (12.3) -0.34 (19.5) 0.06 (17.4) 0.47 (14.2) 0.08 (19.8) 0.75 (17.3) 75% E(t0) 5922 (14.0) 478 (11.3) 270 (6.9) ν(t0) 0.10 (19.3) 0.19 (13.2) 0.09 (19.2) 0.81 (18.5) 0.05 (18.7) 0.65 (17.1) E(t24) 5500 (15.2) 387 (9.8) 237 (9.1) ν(t24) -0.24 (20.4) -0.33 (17.3) 0.10 (24.5) 0.87 (23.8) 0.08 (12.4) 0.91 (23.7)
E(t0), mean value of the instantaneous Young’s modulus; E(t24), mean value of the time-dependent Young’s modulus determined after 24 h
creep test; ν(t0), mean value of the instantaneous Poisson’s ratios; ν(t24), mean value of the time-dependent Poisson’s ratios determined
after 24 h creep test; L, longitudinal; R, radial; T, tangential; Values in parenthesis are COV.
Stress levels: 25%, 50%, 75% Longitudinal Radial Tangentia l 1.02 0.99 0.96 0.93 0.90 1.02 1.02 0.98 0.94 0.90 0.86 0 5 10 15 20 25 0 5 10 15 20 25 0 5 10 15 20 25 E∼L E∼R E∼T 0.95 0.88 0.81 0.74 Time (h)
Figure 2: Time evolution of the normalized Young’s moduli ( )E t for Chinese fir wood determined in compressive creep experiment at three stress levels in the indicated orthotropic directions.
Stress levels: -0.10 -0.15 -0.20 -0.25 -0.30 -0.05 -0.15 -0.25 -0.35 -0.45 -0.2 -0.4 -0.6 -0.8 -1.0 -1.2 0 5 10 15 20 25 0 5 10 15 20 25 0 5 10 15 20 25 25%, 50%, 75% Longitudinal Radial Tangentia l Time (h) εL εR εT
Figure 3: Time evolution of the axial strain (%) for Chinese fir wood determined in compressive creep experiment at three stress levels in the indicated orthotropic directions.
Stress levels: 25%, 1.5 1.0 0.5 0.0 -0.5 -1.0 -1.5 -2.0 1.5 1.0 0.5 0.0 -0.5 -1.0 -1.5 -2.0 -2.5 -3.0 0 1.8 1.5 1.2 0.9 1.6 1.5 1.4 1.3 1.2 1.1 1.0 0.9 1.5 1.4 1.3 1.2 1.1 1.0 0.9 1.4 1.3 1.2 1.1 1.0 0.9 5 10 15 20 25 0 5 10 15 20 25 0 5 10 15 20 25 0 5 10 15 20 25 0 5 10 15 20 25 0 5 10 15 20 25 50%, 75% Longitudinal Radial Tangentia l Time (h) νRL ∼ νTL∼ νLT ∼ νRT νLR ∼ ∼ νTR ∼
Figure 4: Time evolution of the normalised Poisson’s ratio ν ( )t for Chinese fir wood determined in compressive creep experiment at three stress levels in all orthotropic direction.
(ν
LRand ν
TR) and T (ν
LTand ν
RT) directions. Accordingly, the
time-dependent behavior for Poisson’s ratios with equal
loading, but different direction of lateral expansion, as for
the ν
RLand ν
TL, ν
LRand ν
TR, ν
LTand ν
RT, is very similar. In
Figure 4, the ( )
ν
t
for the ν
LR, ν
TR, ν
LTand ν
RT, can be
inter-preted that the Poisson’s ratios might be divided into an
initial time-dependent stage with rapid change of
Pois-son’s ratio and a second time insensitive stage, where the
data are nearly stable after a certain time. Ozyhar et al.
(2013a) reported similar results.
The comparison of the ( )
ν
t
values determined after
24 h of the creep further reveal that the time effect on the
Poisson’s ratios at 75% stress level is roughly twice as
much as at 25% stress level for ν
RL, ν
TL, ν
LTand ν
RT, while ν
LRand ν
TRand present an opposite trend (Figure 4).
Moreo-ver, Poisson’s ratios determined in L direction (
ν
RLand
TL
ν
), in general, are decreasing, while those obtained in R
and T directions (
ν
LR,
ν
TR,
ν
LTand
ν
RT) are increasing
with time. Ozyhar et al. (2013a) reported that the overall
orthotropic time-dependent behavior of the Poisson’s
ratios are decreasing. These inconsistent results cannot
be interpreted satisfactorily. Lakes (1992) found that
Pois-son’s ratios can increase or decrease with time, which was
confirmed by Lakes and Wineman (2006): “viscoelastic
Poisson’s ratios need not to increase with time, and need
not to be monotonic with time”.
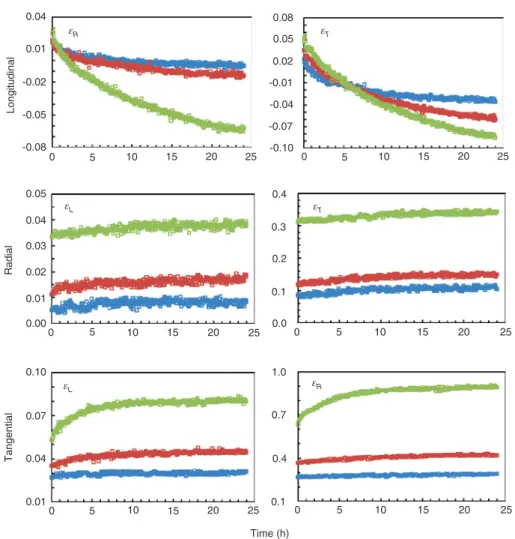
Figure 5 illustrates different time dependency of the
lateral strain in all directions at three load levels. The
time evolution of the strain show in R and T directions the
expected scenario, where the contraction of the specimen
in the axial direction is accompanied by the expansion
in the transverse direction, and exhibit increasing trends
for lateral strain data. However, the time evolution of the
lateral strain in L direction reveals an opposite trend, i.e.
an increasing contraction of the lateral strain instead
of expansion in the R and T directions. Ozyhar et al.
(2013a) found a similar trend. Although the mechanism
behind this behavior are not yet completely understood,
Stress levels: 0 5 10 15 20 25 0 5 10 15 20 25 0 5 10 15 20 25 0 5 10 15 20 25 0 5 10 15 20 25 0 5 10 15 20 25 0.04 0.08 0.05 0.02 -0.01 -0.04 -0.07 -0.10 0.01 0.05 0.4 0.3 0.2 0.1 0.0 1.0 0.7 0.4 0.1 0.04 0.03 0.02 0.01 0.00 0.10 0.07 0.04 0.01 -0.02 -0.05 -0.08 25%, 50%, 75% Longitudinal Radial Tangentia l Time (h) εR εR εT εT εL εL
Figure 5: Time evolution of the lateral strain (%) for Chinese fir wood determined in compressive creep experiment at three stress levels in the indicated orthotropic directions.
the implications on the time-dependent behavior of the
values of v
RLand ν
TLare significant, while the data are
continuously decreasing with time and reach
eventu-ally negative values (Table 3). Such negative values were
also observed by Ozyhar et al. (2013a). According to Ting
and Chen (2005), anisotropic elastic materials can have
an arbitrarily large positive or negative Poisson’s ratio
values. Hilton (2009) reported that the linear viscoelastic
Poisson’s ratios are not limited to the elastic value range
and may exceed it considerably in either direction.
Nega-tive Poisson’s ratios for auxetic materials, and viscoelastic
Poisson’s ratios with negative values were discussed by
Lakes (1987) and Lakes and Wineman (2006), respectively.
A review on this phenomenon is given by Liu (2006).
According to Lakes (1993), negative Poisson’s ratios
can be due to the structural hierarchy of the material. It
is at least conceivable that the complex wood structure
is responsible to a different stress-strain response in the
orthotropic directions and at different load levels (as
Table 3: Time dependency of the orthotropic compliance matrix elements for Chinese fir wood determined in compressive creep experiment.
Compliance
25% Stress 50% Stress 75% Stress d(t0) d(t24) d(t0) d(t24) d(t0) d(t24) d11 158 167 163 174 169 182 d22 215 248 229 279 209 258 d33 389 410 373 472 370 422 -d12 11 17 9 17 19 26 -d21 21 -7 18 -9 17 -44 -d13 31 37 26 38 19 34 -d31 27 -45 33 -59 32 -60 -d23 319 357 261 354 241 384 -d32 168 228 87 131 169 224
All data in ( × 10-12 Pa-1); d, elements of the orthotropic compliance
matrix (dii, diagonal; dij, nondiagonal); d(t0), instantaneous values
[calculated by the Eqs. (4) and (5) with the average E(t0) and ν(t0) values from Table 2]; d(t24), time-dependent value determined after
showed in Figures 3 and 5), and eventually to negative
values of Poisson’s ratio. The cellular structure of wood,
which resembles that of an engineered honeycomb
struc-ture (Gibson 2005), also raises the question of whether
negative Poisson’s ratios could be associated with the
mechanical behavior of wood at the cellular level.
Com-pressive load applied on the wavy structure of the
honey-comb cell walls, bending may occur, which causes elastic
buckling and gives rise to negative Poisson’s ratios. The
microporous structure of wood might lead to elastic
insta-bilities, which have been reported to explain negative
Poisson’s ratios in porous elastomeric materials (Bertoldi
et al. 2010). Thus the negative Poisson’s ratios might be
attributed to several interacting mechanical processes
taking place at the microscopic level (Ozyhar et al. 2013a).
Time-dependency of the orthotropic
compliance matrix
The time dependency of the compressive orthotropic creep
compliance elements are presented in Table 3.
Accord-ingly, the compliance is a function of time, indicating that
individual elements of the orthotropic compliance matrix
are affected differently by time. Obviously, the higher the
stress level, the much more time sensitive behavior can be
seen. A lot of studies have pointed out that there are
signif-icant discrepancies between the corresponding values for
the nondiagonal elements (d
ijand d
ji) of the wood
compli-ance matrix (Bodig and Jayne 1982; Neuhaus 1983; Hering
et al. 2012; Ozyhar et al. 2013a), even though, for
simplic-ity reasons, these values are often assumed as equal based
on the orthotropic symmetry of the compliance. However,
the results in this study also indicate that the orthotropic
compliance shows an asymmetric behavior.
Conclusion
The time dependency of the Young’s moduli and Poisson’s
ratios for Chinese fir wood were determined by
compres-sive creep tests at three stress levels. The results show
that these properties are a function of time and differ in
all orthotropic directions. Thus the viscoelastic behavior
of wood is complex and also dependent of the loading
level. Proved by the time evolution of the stress-strain
relationship, the E(t) and ν(t) data confirm that not only
the magnitude of the time effect but also the time
evolu-tion of the behavior itself is dependent on the orthotropic
directions and on the stress level. Negative Poisson’s ratio
values obtained for specimens compressed in the L
direc-tion (ν
RLand ν
TL) further exemplify the complexity of the
viscoelastic behavior. The mechanism behind the
time-dependent behavior of the negative Poisson’s ratios are
not completely understood yet, but the reasons for this
are assumed to be closely associated with the hierarchical
structure of wood and the mechanical response of wood at
the cellular level. The time dependency of the orthotropic
compliance asymmetry is revealed by the time evolution
of the corresponding nondiagonal elements of the
ortho-tropic compliance matrix.
Acknowledgments: This research was sponsored by
the National Natural Science Foundation of China (No.
31570548). J.J. would like to gratefully acknowledge the
financial support from the China Scholarship Council
(CSC). A special thanks goes to Franco Michel and Thomas
Schnider for their help during specimen preparation and
their expert assistance in conducting the measurements.
References
Backman, A.C., Lindberg, K.A.H. (2001) Difference in wood material responses for radial and tangential direction as measured by dynamic mechanical thermal analysis. J. Mater. Sci. 36:3777–3783.
Bertoldi, K., Reis, P.M., Willshaw, S., Mullin, T. (2010) Negative Poisson’s ratio behavior induced by an elastic instability. Adv. Mater. 22:361–366.
Bodig, J., Jayne, B.A. Mechanics of Wood and Wood Composites. Van Nostrand Reinhold Company Inc., New York, 1982. Bucur, V., Archer, R.R. (1984) Elastic constants for wood by an
ultrasonic method. Wood Sci. Technol. 18:255–265. Chang, F.C., Lam, F., Kadla, J.F. (2013) Using master curves based
on time–temperature superposition principle to predict creep strains of wood–plastic composites. Wood Sci. Technol. 47:571–584.
Dlouha, J., Clair, B., Arnould, O., Horáček, P., Gril, J. (2009) On the time-temperature equivalency in green wood: characteri-sation of viscoelastic properties in longitudinal direction. Holzforschung 63:327–333.
Dong, F., Olsson, A.M., Salmén, L. (2010) Fibre morphological effects on mechano-sorptive creep. Wood Sci. Technol. 44:475–483. Engelund, E.T., Svensson, S. (2011) Modelling time-dependent
mechanical behaviour of softwood using deformation kinetics. Holzforschung 65:231–237.
Engelund, E.T., Salmén, L. (2012) Tensile creep and recovery of Norway spruce influenced by temperature and moisture. Holzforschung 66:959–965.
Gibson, L.J. (2005) Biomechanics of cellular solids. J. Biomech. 38:377–399.
Gonçalves, R., Trinca, A.J., Cerri, D.GP. (2011) Comparison of elastic constants of wood determined by ultrasonic wave propagation and static compression testing. Wood Fiber Sci. 43:64–75.
Grossman, P.U.A. (1976) Requirements for a model that exhibits mechano-sorptive behavior. Wood Sci. Technol. 10:163–168. Hanhijärvi, A. (1995) Modelling of creep deformation mechanisms in
wood. Technical Research Centre of Finland, 79–91. Hassani, M.M., Wittel, F.K., Hering, S., Herrmann, H.J. (2015)
Rheological model for wood. Comput. Method. Appl. Mech. Eng. 283:1032–1060.
Hayashi, K., Felix, B., Le Govic, C. (1993) Wood viscoelastic compli-ance determination with special attention to measurement problems. Mater. Struct. 26:370–376.
Hering, S., Niemz, P. (2012) Moisture-dependent, viscoelastic creep of European beech wood in longitudinal direction. Eur. J. Wood Wood Prod. 70:667–670.
Hering, S., Keunecke, D., Niemz, P. (2012) Moisture-dependent ortho-tropic elasticity of beech wood. Wood Sci. Technol. 46:927–938. Hilton, H.H. (2009) The elusive and fickle viscoelastic Poisson’s ratio
and its relation to elastic-viscoelastic correspondence princi-ple. J. Mech. Mater. Struct. 4:1341–1364.
Hunt, D.G. (1989) Linearity and non-linearity in mechano-sorptive creep of softwood in compression and bending. Wood Sci. Technol. 23:323–333.
Hunt, D.G. (1999) A unified approach to creep of wood. Proc. R. Soc. A. 455:4077–4095.
Jiang, J.L., Lu, J.X. (2009) Anisotropic characteristics of wood dynamic viscoelastic properties. Forest Prod. J. 59:59–64. Kaboorani, A., Blanchet, P., Laghdir, A. (2013) A rapid method to
assess viscoelastic and mechanosorptive creep in wood. Wood Fiber Sci. 45:370–382.
Keunecke, D., Sonderegger, W., Pereteanu, K., Lüthi, T., Niemz, P. (2007) Determination of Young’s and shear moduli of common yew and Norway spruce by means of ultrasonic waves. Wood Sci. Technol. 41:309–327.
Keunecke, D., Hering, S., Niemz, P. (2008) Three-dimensional elastic behavior of common yew and Norway spruce. Wood Sci. Technol. 42:633–647.
Lakes, R.S. (1987) Foam structures with a negative Poisson’s ratio. Science 235:1038–1040.
Lakes, R.S. (1992) The time-dependent Poisson’s ratio of viscoelastic materials can increase or decrease. Cell. Polym. 11:466–469. Lakes, R.S. (1993) Materials with structural hierarchy. Nature
361:511–515.
Lakes, R.S., Wineman, A. (2006) On Poisson’s ratios in linearly viscoelastic solids. J. Elasticity 85:45–63.
Lakes, R.S. (2009) Viscoelastic Materials. Cambridge University Press, New York.
Liu, T. (1993) Creep of wood under a large span of loads in constant and varying environments. Part 1: experimental observations and analysis. Holz Roh- Werk. 51:400–405.
Liu, Q. (2006) Literature review: Materials with negative Poisson’s ratios and potential applications to aerospace and defense. Air vehicles division, DSTO defense science and technology organization, Victoria, Australia.
Mano, F. (2002) The viscoelastic properties of cork. J. Mater. Sci. 37:257–263.
Mukudai, J., Yata, S. (1988) Verification of Mukudai’s mechano-sorptive model. Wood Sci. Technol. 22:43–58.
Navi, P., Pittet, V., Plummer, C.J.G. (2002) Transient moisture effects on wood creep. Wood Sci. Technol. 36:447–462.
Neuhaus, H. (1983) Elastic behavior of spruce wood as a function of moisture content. Holz Roh- Werk. 41:21–25.
Ormarsson, S., Dahlblom, O., Johansson, M. (2010) Numerical study of how creep and progressive stiffening affect the growth stress formation in trees. Trees 24:105–115.
Ozyhar, T., Hering, S., Niemz, P. (2012) Moisture-dependent elastic and strength anisotropy of European beech wood in tension. J. Mater. Sci. 47:6141–6150.
Ozyhar, T., Hering, S., Niemz, P. (2013a) Viscoelastic characteriza-tion of wood: Time dependence of the orthotropic compliance in tension and compression. J. Rheol. 57:699–717.
Ozyhar, T., Hering, S., Niemz, P. (2013b) Moisture-dependent ortho-tropic tension-compression asymmetry of wood. Holzforschung 67:395–404.
Ozyhar, T., Hering, S., Sanabria, S.J., Niemz, P. (2013c) Determining moisture-dependent elastic characteristics of beech wood by means of ultrasonic waves. Wood Sci. Technol. 47:329–341. Schniewind, A.P., Barrett, J.D. (1972) Wood as a linear orthotropic
viscoelastic material. Wood Sci. Technol. 6:43–57. Schmidt, J., Kaliske, M. (2004) Anisotropic moisture depending
viscoelastic material model for wood. Proc. Appl. Math. Mech. 4:205–206.
Takahashi, C., Ishimaru, Y., Iida, I., Furuta, Y. (2004) The creep of wood destabilized by change in moisture content. Part 1: the creep behaviors of wood during and immediately after drying. Holzforschung 58:261–267.
Takahashi, C., Ishimaru, Y., Iida, I., Furuta, Y. (2005) The creep of wood destabilized by change in moisture content. Part 2: the creep behaviors of wood during and immediately after adsorp-tion. Holzforschung 59:46–53.
Takahashi, C., Ishimaru, Y., Iida, I., Furuta, Y. (2006) The creep of wood destabilized by change in moisture content. Part 3: The influence of changing moisture history on creep behavior. Holzforschung 60:299–303.
Taniguchi, Y., Ando, K. (2010) Time-dependence of Poisson’s effect in wood I: the lateral strain behavior. J. Wood Sci. 56:100–106.
Taniguchi, Y., Ando, K., Yamamoto, H. (2010) Determination of three-dimensional viscoelastic compliance in wood by tensile creep test. J. Wood Sci. 56:82–84.
Ting, T.C.T., Chen, T. (2005) Poisson’s ratio for anisotropic elastic materials can have no bounds. Q. J. Mech. Appl. Math. 58:73–82.
Toratti, T., Svensson, S. (2000) Mechano-sorptive experiments perpendicular to grain under tensile and compressive loads. Wood Sci. Technol. 34:317–326.
Vidal-Sallé, E., Chassagne, P. (2007) Constitutive equations for orthotropic nonlinear viscoelastic behavior using a generalized Maxwell model application to wood material. Mech. Time-Depend. Mater. 11:127–142.
Violaine, G.R., Cisse, O., Placet, V., Johnny, B., Miguel, P., Boubakar, M.L. (2015) Creep behaviour of single hemp fibres. Part II: Influence of loading level, moisture content and moisture variation. J. Mater. Sci. 50:2061–2072.