www.the-cryosphere.net/6/1175/2012/ doi:10.5194/tc-6-1175-2012
© Author(s) 2012. CC Attribution 3.0 License.
The Cryosphere
Sensitivity of Greenland Ice Sheet surface mass balance to surface
albedo parameterization: a study with a regional climate model
J. H. van Angelen1, J. T. M. Lenaerts1, S. Lhermitte2, X. Fettweis3, P. Kuipers Munneke1, M. R. van den Broeke1, E. van Meijgaard2, and C. J. P. P. Smeets11Institute for Marine and Atmospheric Research Utrecht, Utrecht University, The Netherlands 2Royal Netherlands Meteorological Institute, De Bilt, The Netherlands
3Department of Geography, University of Li`ege, Belgium
Correspondence to: J. H. van Angelen (j.h.vanangelen@uu.nl)
Received: 5 April 2012 – Published in The Cryosphere Discuss.: 24 April 2012
Revised: 3 September 2012 – Accepted: 26 September 2012 – Published: 23 October 2012
Abstract. We present a sensitivity study of the surface mass balance (SMB) of the Greenland Ice Sheet, as modeled us-ing a regional atmospheric climate model, to various param-eter settings in the albedo scheme. The snow albedo scheme uses grain size as a prognostic variable and further depends on cloud cover, solar zenith angle and black carbon concen-tration. For the control experiment the overestimation of ab-sorbed shortwave radiation (+6 %) at the K-transect (west Greenland) for the period 2004–2009 is considerably re-duced compared to the previous density-dependent albedo scheme (+22 %). To simulate realistic snow albedo values, a small concentration of black carbon is needed, which has strongest impact on melt in the accumulation area. A back-ground ice albedo field derived from MODIS imagery im-proves the agreement between the modeled and observed SMB gradient along the K-transect. The effect of enhanced meltwater retention and refreezing is a decrease of the albedo due to an increase in snow grain size. As a secondary effect of refreezing the snowpack is heated, enhancing melt and fur-ther lowering the albedo. Especially in a warmer climate this process is important, since it reduces the refreezing potential of the firn layer that covers the Greenland Ice Sheet.
1 Introduction
Mass loss from the Greenland Ice Sheet (GrIS) is expected to become a major contributor to sea level rise this cen-tury (IPCC-AR4). After a 30-yr period (1960–1990) dur-ing which the GrIS was in approximate mass balance (i.e.
the mass gain by precipitation was approximately equal to the mass loss by surface runoff and solid ice discharge), the mass balance has turned negative in the last 20 yr, with a larger melt extent (Fettweis et al., 2011), increasing sur-face runoff (Ettema et al., 2009; Hanna et al., 2008) and in-creased glacier discharge (Nick et al., 2009; Rignot et al., 2011). In the last decade, contributions made to the total mass loss of ∼ 2400 Gt, were for ∼ 60 % accounted for by enhanced runoff and for ∼ 40 % by enhanced discharge (Van den Broeke et al., 2009; Rignot et al., 2008). With outlet glaciers retreating and near surface air temperature increas-ing further, mass loss in the near future will likely remain dominated by surface runoff.
The most important energy source for surface runoff is the absorption of solar radiation (Van den Broeke et al., 2008a), which is mainly determined by date, time, cloud cover and surface albedo. Modeled surface mass balance (SMB) of the GrIS is highly sensitive to surface albedo (Bougamont and Bamber, 2005; Fitzgerald et al., 2012; Tedesco et al., 2011), owing to the positive melt–albedo feedback, which results in lower albedo in high-melt years (Stroeve, 2007). Following recent warming, a persistent drop in GrIS surface albedo has been observed in satellite data and climate models (Box et al., 2012).
Any physically-based approach to project future GrIS mass balance requires a high resolution (<25 km) climate model that adequately represents surface albedo, including all processes that influence its evolution (Bougamont et al., 2007). For a proper interpretation of SMB projections it is also essential to understand the physical processes in the
snowpack, their influence on albedo and ultimately on the surface mass balance.
In this paper we address the sensitivity of the SMB of the GrIS to changes in the different parameter settings of a physical albedo parameterization scheme. For this we use the high resolution climate model RACMO2 (Van Meijgaard et al., 2008; Ettema et al., 2010a), recently extended with a new albedo scheme (Kuipers Munneke et al., 2011). The next section will briefly describe in situ albedo observations, RACMO2 and the albedo scheme and lists the sensitivity tests performed in this study. Results are discussed in Sect. 3 and conclusions and a future outlook are given in Sect. 4.
2 Data and methods 2.1 AWS Observations
Since 1990, the Institute for Marine and Atmospheric re-search Utrecht (IMAU) of Utrecht University has performed mass balance and meteorological measurements along a tran-sect (Kangerlussuaq trantran-sect or K-trantran-sect), located on the western margin of the GrIS at 67◦N (Van de Wal et al., 2005). The ablation area here is up to 150 km wide with gentle slopes, representing the largest ablation region of the GrIS. In August 2003, three automatic weather stations were installed along the transect (Van den Broeke et al., 2008a), indicated by the three black dots in the inset of Fig. 1. The measurements of downward and upward shortwave radia-tion are used for evaluaradia-tion of RACMO2. The lowest sta-tion (S5) is located ∼ 5 km from the ice sheet margin at an altitude of 420 m. This site experiences an average ablation rate of ∼ 3.5 m of water equivalent (m w.e.) per year. Sta-tion S6 is located ∼ 40 km from the margin, at an altitude of approximately 1000 m, in rough terrain with melt water channels in summer (Fig. 2a) and an average ablation rate of ∼2 m w.e. yr−1. Station S9 (Fig. 2b) is situated ∼ 80 km from the margin, at an altitude of around 1500 m. At the on-set of the stake measurements, S9 was close to the equilib-rium line, but in the most recent 5 yr an average ablation rate of 0.5 m w.e. yr−1has been observed here. In this study, only data from stations S6 and S9 are used for the evaluation of the new snow albedo scheme. Data from S5 is not used in the direct albedo evaluation because it is located on the tongue of Russell Glacier, which is not fully resolved in RACMO2. 2.2 Melt days
As a second evaluation method, we use the amount of melt-ing days in the summer of 2007 based on satellite retrievals. Daily values of brightness temperature from the Special Sen-sor Microwave/Imager (SSM/I) F-13 (1995–2009) are re-gridded on a 25 × 25 km EASE-grid, as distributed by the National Snow and Ice Data Center (Armstrong and Brodzik, 1995). The brightness temperatures are derived as in Ab-dalati and Steffen (1997, 2001). As a threshold to determine
whether melt is present, a brightness temperature of 227.5 K is used (see Fettweis et al., 2011).
2.3 Regional atmospheric climate model
We use the Regional Atmospheric Climate Model (RACMO2) (Van Meijgaard et al., 2008), developed at the Royal Netherlands Meteorological Institute (KNMI). Over the last decade, RACMO2 has been adapted to realistically simulate ice sheet SMB by implementing a multilayer snow model (Ettema et al., 2010a), a drifting snow scheme (Lenaerts et al., 2010) and a physical albedo scheme (Kuipers Munneke et al., 2011). In this study, RACMO2 has a horizontal grid spacing of approximately 11 km and 40 sigma levels in the vertical. The domain covers Greenland and its surrounding seas, including the Canadian Arctic Archipelago, Iceland and Svalbard (Fig. 1). At the lateral boundaries, RACMO2 is forced every 6 h by ERA-Interim reanalysis data (Simmons et al., 2007). At the surface boundary, sea surface temperature and sea ice extent are prescribed. Ettema et al. (2010a,b) evaluated RACMO2 for the period 1958–2008 over Greenland. Recently, output of RACMO2 has been successfully used to solve for the total mass budget of the GrIS (Van den Broeke et al., 2009), to describe the momentum budget of the katabatic atmospheric boundary layer (Van Angelen et al., 2011a) and to explain the wind-driven sea-ice export through Fram Strait (Van Angelen et al., 2011b).
2.4 Albedo scheme
The most important physical property influencing snow albedo is snow grain size (Wiscombe and Warren, 1980): larger grains are both more absorptive and scatter solar radi-ation preferentially in the forward direction, into the snow-pack, enhancing the chances that photons are absorbed. Clouds, solar zenith angle and impurities due to soot and dust also have an impact on albedo. In previous model ver-sions of RACMO2, broadband albedo was snow density-dependent (Greuell and Konzelmann, 1994). Although the density of snow is a measure for snow metamorphism, as it usually increases with increasing grain size, a density depen-dent albedo scheme is unphysical (Wiscombe and Warren, 1980). Especially for wet snow conditions, a density depen-dent albedo scheme tends to underestimate albedo, resulting in an overestimation of absorbed solar radiation, and conse-quently a too early and too long exposure of bare ice at the surface (Ettema et al., 2010a). Figure 3 compares measured and modeled albedo at S9, using the previous, density de-pendent albedo scheme. In reality, only for a short period in August bare ice was present at the surface, whereas the mod-eled albedo predicts ice at the surface from mid July until the end of September. Too low albedos in June resulted in a rapid melting of the snowcover.
Fig. 1. Domain used in the RACMO2 simulations. The colors de-note background ice albedo as derived from MODIS satellite data, with a fixed value of 0.55 assumed for areas currently covered by a permanent snow cover. Contour lines are at a 500 m surface eleva-tion intervals. The area of the K-transect with the locaeleva-tions of the three automatic weather stations (S5, S6 and S9 from west to east) is expanded in the inset.
The new albedo scheme as implemented in RACMO2 is described in Kuipers Munneke et al. (2011), with applica-tion to the Antarctic ice sheet. The scheme is based on pa-rameterizations developed by Gardner and Sharp (2010), in which a broadband albedo is calculated depending on snow grain size, solar zenith angle, cloud cover and contamination of the snowpack by black carbon:
α = αS+dαu+dαc+dατ . (1)
The final broadband albedo (α) is the sum of a base albedo (αS) that depends on snow grain size, corrected for solar
zenith angle (dαu), contamination (dαc) and clouds (dατ).
The parameterizations for the base albedo and the different corrections are derived using a snow–ice–atmosphere radia-tive transfer model. Solar zenith angle and cloud cover are readily available from RACMO2. Kuipers Munneke et al. (2011) introduced a new prognostic variable in RACMO2, the effective snow grain size (re). The effective snow grain
size at time t is a mass weighted average of the snow grain size of fresh snow (fn), old snow (fo) and refrozen liquid
water (fr) in a snow layer:
re(t ) = [re(t −1) + dre,dry+dre,wet]fo+re,0fn+re,rfr. (2)
The snow grain size of fresh snow (re,0) and refrozen snow
(re,r) is chosen constant in time and space. The grain size
of old snow is based on the snow grain size in the previous time step (re(t −1)) corrected for dry and/or wet snow
meta-morphism. The ageing of dry snow (dre,dry) is
parameter-ized from the microphysical snow grain growth Snow, Ice, and Aerosol Radiative model (SNICAR) (Flanner and Zen-der, 2006). Since the complete SNICAR model is computa-tionally too expensive for this RACMO2 implementation, a parameterization is used that depends on temperature, tem-perature gradient and density of the specific snow layer. Wet snow metamorphism (dre,wet) is based on Brun et al. (1989),
in which the growth of the snow grains is dependent on the amount of liquid water present in the snowpack.
Black carbon concentrations in Antarctic snow are too low to have a significant impact on the snow albedo (Warren and Clarke, 1990; Grenfell et al., 1994), so a correction for black carbon was not applied by Kuipers Munneke et al. (2011). In contrast, black carbon concentrations of 0.05 ppmv have been measured at Summit, Greenland (Flanner et al., 2007), and probably even higher concentrations are present in the lower regions. This will have a significant impact on snow albedo (Hansen and Nazarenko, 2004; Flanner et al., 2007). The effect of black carbon on broadband snow albedo in RACMO2 follows Eq. (8) in Gardner and Sharp (2010):
dαc=max 0.04 − αS,
−c0.55
0.16 + 0.6S0.5+1.8c0.6S−0.25
!
, (3)
in which S is the specific surface area of the snow grains (m2kg−1) and c the carbon loading (ppmv). The black line in Figure 4 shows broadband albedo for a range of snow grains between 20 and 1000 µm, without correcting for black car-bon, cloud cover or solar zenith angle. Fresh snow albedo is as high as 0.85, but drops rapidly with increasing snow grain size to a value of 0.7 for 1 mm grains (typical for wet snow). The colored lines show dαc for three different
val-ues of carbon loading: 0.05 ppmv (blue), 0.1 ppmv (green) and 0.2 ppmv (red). The effect of black carbon on albedo in-creases with increasing grain size. The reason is that photons are preferentially scattered forward by larger grains and thus have a longer pathway in snow with larger grain sizes, in-creasing the chances to meet a black carbon particle and be-ing absorbed by it. For a snowpack consistbe-ing of grains with an average grain size of 1 mm, a carbon loading of 0.1 ppmv will decrease the albedo from 0.7 to 0.63, equivalent to an increase in the absorption of shortwave radiation of 20 %. 2.5 MODIS background ice albedo
The albedo of bare ice in the ablation area of the GrIS is not constant in space and time (Box et al., 2012). In the southwestern region of the ice sheet, the so called dark band (Wientjes et al., 2011) shows albedo values < 0.4, while sim-ilarly strong spatial albedo variability is found in other parts
Fig. 2. Automatic weather stations along the K-transect in West Greenland. On the left S6, on the right S9. For locations see Fig. 1. The photographs were taken at the end of August 2011.
Fig. 3. Surface albedo for the year 2006 at S9 along the K-transect. Black line shows AWS measurements, red line shows RACMO2 results using the previous, density-dependent albedo scheme, and blue shows MODIS-derived albedo.
of the GrIS (Boggild et al., 2010). This motivated us to com-pile an ice albedo field that can serve as background ice albedo in RAMCO2.
Figure 1 shows the background ice albedo (BIA) field used in the CONTROL simulation. The BIA is used if the density of the top two layers of the snow model is equal to the den-sity of ice (910 kg m−3). The BIA is based on the moderate-resolution imaging spectroradiometer (MODIS) white sky 16-day albedo product (MOD43, NASA Land Processes Dis-tributed Active Archive Center (LP DAAC); Albedo 16-Day L3 Global 0.05◦CMG (USGS/Earth Resources Observa-tion and Science (EROS) Center, Sioux Falls, South Dakota, 2012)). The satellite data are based on a 16-day integration period, with a time resolution of 8 days at a horizontal resolu-tion of 0.05◦(∼ 5 km). The MODIS albedo product has been
evaluated by Stroeve et al. (2005); MODIS derived albe-dos are accurate for albedo values < 0.7 over Greenland and as such they are suitable for determining a background ice albedo field.
The BIA field is calculated using 10 yr of MODIS data (2001–2010), taking the albedo of the lowest 5 % of all albedo values observed at every grid point in the period 2000–2010. Since the current albedo scheme does not
ac-Fig. 4. Snow albedo as function of grain size (black, left axis) and the change of albedo as function of grain size for three different concentrations of black carbon in the snowpack: 0.05 ppmv (blue, right axis), 0.1 ppmv (green) and 0.2 ppmv (red).
count for intra- and inter-annual differences in BIA, the 5 % approach was chosen to represent the multi-year BIA as it is more robust to outliers than the absolute minimum back-ground albedo and corresponds better to the multi-year min-imum albedo. For example, the lowest 5 % albedo values for the 2000–2011 BIA correspond with the BIA values ob-served in 2007, whereas the minimum background albedo is observed in 2010. The minimum value is set to 0.3, and the maximum to 0.55. The latter value is also used for locations which are presently snow covered throughout the year, but are expected to become snow free in the coming years. For grid points where MODIS data are not accurate in determin-ing a BIA value, a problem occurrdetermin-ing only at high latitudes (> 80◦N), the BIA is set to 0.47, being the average albedo of all ice points. Note that this value is lower than the ice albedo value of 0.52 used in the previous version of RACMO2 (Et-tema et al., 2010a).
Although ice albedo as observed by MODIS is reasonably stable from year to year, inter-annual variability is present,
with a maximum spread of 0.15, but for most locations less than 0.05. For example, at the location of S6, the lowest MODIS albedo values range between 0.34 and 0.44 in the pe-riod 2004–2010. This variability is partly due to measuring uncertainties (mainly due to cloud cover), and partly a real phenomenon, possibly associated with delayed supraglacial runoff of meltwater (Van den Broeke et al., 2008b).
2.6 Model experiments
To evaluate the sensitivity of SMB to the new albedo scheme, we have performed seven RACMO2 simulations for the year 2007. Performing these experiments is computationally ex-pensive and time consuming, therefore a single year is cho-sen. The year 2007 is a record melt year in the last decade; it resembles future warmer years with an increasing ablation area, and therefore is important to simulate correctly. Model evaluation focuses on melt extent and albedo at station S9, located close to the equilibrium line where the local SMB is very sensitive to small changes in the albedo scheme. Radia-tion measurements have also been performed at several other locations on the GrIS (Steffen and Box, 2001), but most of these are located in the accumulation area at ∼ 2000 m where albedo variations are small. Moreover, Ettema et al. (2010a) demonstrated that southwest Greenland is the most difficult area for RACMO2 to simulate albedo and SMB correctly, because of the relatively gentle slopes.
Table 1 summarizes the various albedo experiments with RACMO2. The ANT settings are the settings used for the Antarctica integration (Kuipers Munneke et al., 2011; Lenaerts et al., 2012). With every new experiment one pa-rameter is changed. In FSGRAIN the specific surface area of fresh snow is decreased from 80 to 60 m2kg−1, equivalent to
an increase in effective radius of the grain size (re,0) from 41
to 55 µm, leading to a lower albedo for fresh snow. In the pre-vious RACMO2 snow albedo scheme, the maximum amount of liquid water in the snowpack was limited to 2 %. In the new snow albedo scheme, this artificial limit is no longer applied, and the amount of liquid water in the snowpack is calculated following Col´eou and Lesaffre (1998). In their ex-pression, the maximum amount of liquid water is related to the available pore space in the snowpack and can reach val-ues of up to 13 % of the weight of the snowpack (experiment LWMAX). A higher amount of liquid water in the snowpack will stimulate refreezing, and consequently albedo will de-crease. Next, in RFGRAIN, the grain size of refrozen snow is increased from 1 to 2 mm, which lowers albedo of refrozen snow. In ICEALB the constant ice albedo is decreased from 0.5 to 0.45. In RSOOT black carbon is added to the snowpack (0.1 ppmv), which reduces snow albedo. In the final simula-tion (CONTROL), the MODIS based background ice albedo field is used instead of a spatially constant value, which will affect the melt rates in regions where bare ice is present at the surface for part of the year.
3 Results
3.1 Albedo time series
Figure 5 displays time series of modeled and measured albedo at locations S6 (5a) and S9 (5b) for the year 2007. Until the end of May, the rough ice surface at S6 is snow covered, resulting in albedo values of 0.8–0.9. The thin (∼ 40 cm) snowcover at S6 melts rapidly and at the begin-ning of June ice appears at the surface; the timing of this is well simulated in CONTROL. In ANT, melting the snowpack takes two weeks longer due to a higher snow albedo in spring. In both ANT and CONTROL, the end of the melt season at the end of August is well timed, whereas for the density dependent RACMO2 simulation the melt season lasted two weeks too long. The background ice albedo in CONTROL is slightly too low compared to the observations (AWS and MODIS) for this specific year.
Results for S9 are displayed in Fig. 5b. In this specific year, bare ice is exposed at the end of June, about two weeks later than at S6. In experiment CONTROL the onset of the melt season is again well timed. In ANT, the snow layer does not fully melt, which emphasizes the fact that close to the equilibrium line, small changes in the albedo can have a strong impact on the surface mass balance. At S9 the back-ground albedo is 0.55, in good agreement with the weather station and the MODIS observations. Note that the snowfall events at the end of June and August are also represented in RACMO2.
Figure 6a compares albedo time series at S9 with MODIS and CONTROL for the period 2004–2009. Over-all, RACMO2, the in situ measurements and MODIS ob-servations are in good agreement. Averaged albedo over the months March to September is 0.774 (modeled) compared to 0.794 (measured at the AWS). This represents a large im-provement compared to the simulation with the density de-pendent albedo scheme (0.721). In that scheme an artificial minimum snow albedo of 0.7 was imposed to prevent an un-realistic decrease in snow albedo during periods of strong snowmelt. This limit is no longer needed in the new scheme. In most years, the MODIS inferred albedo shows a higher minimum albedo (up to 0.15 in 2006) compared to both the AWS measurements and the RACMO2 results. MODIS data use a 16-day time span to calculate a single albedo value; the exposure of bare ice at S9 in a regular melt season is seldom continuous for a 16 day period, but interrupted by snowfall events. An exception is the year 2007, when MODIS albedo decreases to values close to 0.55. Another source of discrep-ancies is the fact that MODIS observes a larger area com-pared to an AWS, and small snow patches or bare ice areas can influence the AWS measurements.
Figure 6b depicts measured (red) and modeled (black) net shortwave radiation, and Fig. 6c shows the differences. The numbers in Fig. 6c denote the mean bias and root-mean-square error (RMSE) for the individual years. Averaged
Fig. 5. Albedo for the year 2007 at location S6 (top) and S9 (bottom) for AWS measurements (black), MODIS retrievals (blue), RACMO2 simulations with the density dependent albedo scheme (magenta) and the new albedo scheme using the ANT (red) and CONTROL (green) settings.
Fig. 6. (a) Albedo at location S9 for AWS data (black), MODIS observations (blue) and final (CONTROL) RACMO2 simulation (red). (b) Net shortwave radiation at location S9 for AWS data (black) and RACMO2 (red). (c) Difference in net short wave radiation between RACMO2 and AWS. The numbers represent mean and root mean square difference (on a daily basis) for the individual years.
Table 1. Summary of the model settings applied in the various sim-ulations with RACMO2.
Experiment FS grain RF grain Max liquid Ice albedo Soot
m2kg−1 mm water ppmv ANT 80 1 2 % 0.5 – FSGRAIN 60 1 2 % 0.5 – LWMAX 60 1 C&S1 0.5 – RFGRAIN 60 2 C&S 0.5 – ICEALB 60 2 C&S 0.45 – RSOOT 60 2 C&S 0.45 0.1
CONTROL 60 2 C&S MODIS2 0.1
1Maximum liquid water content based on Col´eou and Lesaffre (1998). 2Background ice albedo based on MODIS retrievals.
over the 6 yr period, modeled net shortwave radiation is 3.0 W m−2or 6 % larger than the measured values. This dis-crepancy can be ascribed mainly to the two years 2004 and 2005 where the albedos in spring (May) are underestimated. This result compares favorably to the offset in the simu-lation with the previous, density-dependent albedo scheme (11.4 W m−2).
The RMSEs are on average 24.0 W m−2, which, compared to the average mean bias, is still significant. This remains a problem of direct climate simulations, because simulat-ing the exact timsimulat-ing of snowfall events remains difficult. However, in the end it is important to simulate the average net shortwave radiation correctly, such that the right amount of energy is available for melting and a correct estimate of snowmelt is obtained.
3.2 SMB components
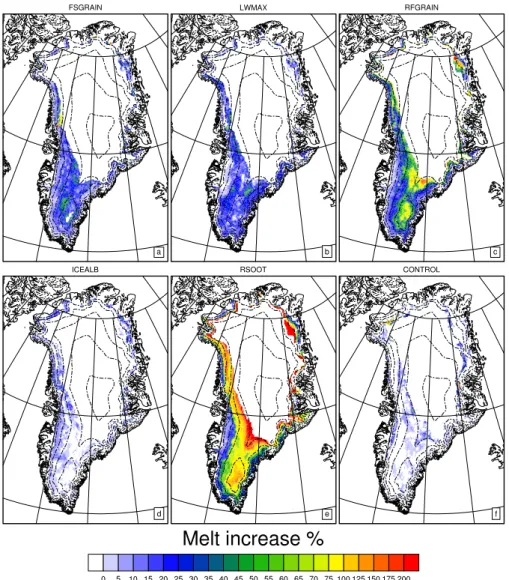
To assess the effect of the individual experiments on snowmelt duration, the difference between the total num-ber of melt days according to SSMI brightness temperatures (Fig. 7) and the RACMO2 simulations is displayed in Fig. 8. Figure 9 shows the percentage increase of melt in a new sim-ulation compared to the preceding simsim-ulation (Table 1). Ta-ble 2 lists SMB and its components for the seven simulations for calendar year 2007, integrated over the entire GrIS.
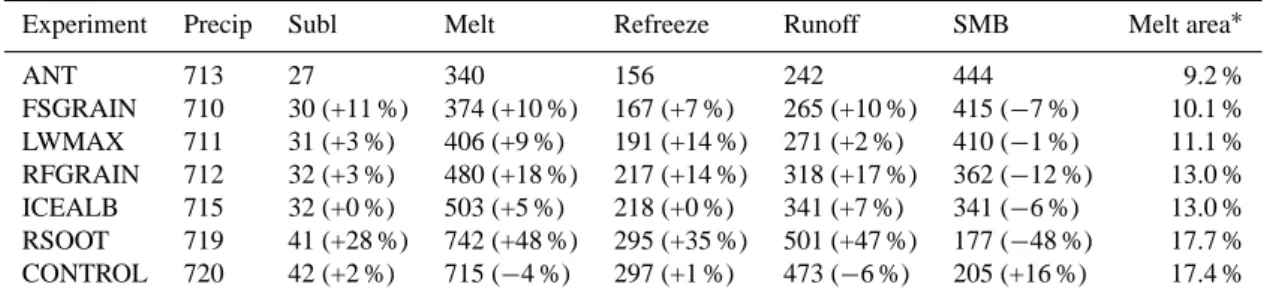
In all simulations, total precipitation is around 715 Gt of which 50 ± 3 Gt (7 %) falls as rain. The ANT run shows a total sublimation of 27 Gt and 340 Gt melt. 156 Gt (40 %) of the available liquid water refreezes in the snowpack, and 242 Gt runs off as meltwater, resulting in a positive surface mass balance of 444 Gt, 62 % of the total mass gained by precipitation. For the year 2007, this value for total SMB is approximately 200 Gt too high (Van den Broeke et al., 2009). The lack of melt is clearly reflected in Fig. 8a, with in some regions up to two months less melt compared to the SSMI satellite retrievals.
Increasing the snow grain size of fresh snow from 41 to 55 µm (“FSGRAIN” simulation) results in an increase in melt to 374 Gt (+10 %). The additional liquid water flux is equally divided between refreezing and runoff, resulting in a SMB
Fig. 7. Number of days with melt according to SSM/I satellite data for the period May to August 2007.
decrease of 29 Gt (−7 %). Figure 9a shows that a larger grain size for fresh snow results in ∼ 30 % more melt in the accu-mulation area in south Greenland. An increase in grain size also results in an earlier start of the melt season and hence the earlier appearance of bare ice in the ablation region, leading to a ∼ 10 % increase in melt in ablation areas.
Changing the maximum liquid water content in the snow-pack from 2 % to a value determined by the scheme of Col´eou and Lesaffre (1998) (“LWMAX” simulation in Ta-ble 2) hardly affects the total SMB, although individual SMB components show significant changes. The larger amount of liquid water allowed to be retained in the snowpack facil-itates refreezing; this increases snow grain size, accompa-nied by a decrease in the albedo and resulting in ∼ 9 % more snowmelt, with locally an increase of up to 50 % in the south (Fig. 9b). The number of melt days also increases, but is still too small compared to the satellite retrievals (Fig. 8c). Due to the larger retention capacity, a significant amount of liquid water is still present in the snowpack at the end of September (∼ 20 Gt). So although the change in the snowpack physics does not alter the SMB directly, the extra snowmelt and re-freezing will cause the snowpack to warm, resulting in ex-tra melt in the following year. This process is particularly
Table 2. SMB components for different model runs, year 2007. Relative changes in parentheses.
Experiment Precip Subl Melt Refreeze Runoff SMB Melt area∗
ANT 713 27 340 156 242 444 9.2 % FSGRAIN 710 30 (+11 %) 374 (+10 %) 167 (+7 %) 265 (+10 %) 415 (−7 %) 10.1 % LWMAX 711 31 (+3 %) 406 (+9 %) 191 (+14 %) 271 (+2 %) 410 (−1 %) 11.1 % RFGRAIN 712 32 (+3 %) 480 (+18 %) 217 (+14 %) 318 (+17 %) 362 (−12 %) 13.0 % ICEALB 715 32 (+0 %) 503 (+5 %) 218 (+0 %) 341 (+7 %) 341 (−6 %) 13.0 % RSOOT 719 41 (+28 %) 742 (+48 %) 295 (+35 %) 501 (+47 %) 177 (−48 %) 17.7 % CONTROL 720 42 (+2 %) 715 (−4 %) 297 (+1 %) 473 (−6 %) 205 (+16 %) 17.4 %
∗Averaged melt area for the period May to August 2007. SSMI data gives 17.3 %.
Fig. 8. Difference in number of melt days between the RACMO2 experiments and the SSM/I observations (Fig. 7) for the period May to August 2007. The individual simulations are listed in Table 1 and explained in the text. The last column in Table 2 lists the average melt area for the period May to August 2007.
important in a non-steady warming climate, since it deter-mines the capacity for refreezing of infiltrated meltwater within the firn column. To study this, a high-resolution cli-mate scenario run will be carried out with RACMO2 for the GrIS. Using results from the present study, we expect to be able to provide a more detailed projection of Greenland mass loss and associated sea level rise with a better constrained uncertainty.
Increasing the grain size of refrozen snow from 1 to 2 mm (RFGRAIN) has a strong impact on the SMB (−48 Gt or
−12 %). Snowmelt increases by almost 20 %, most of which runs off the ice sheet. In some areas the amount of snowmelt more than doubles (Fig. 9c). It is interesting to note that
changes in the refreezing parameters (LWMAX and RF-GRAIN) have most impact on melt in regions higher up the ice sheet and along the southeast coast, where precipitation rates are high, because in those regions the full refreezing capacity of the snowpack is not reached.
A decrease of the ice albedo from 0.5 to 0.45 (“ICEALB” simulation) is equivalent to an extra uptake of shortwave ra-diation by 10 % if bare ice is present at the surface. This in-creases total melt by another 23 Gt or 5 %. Since only ar-eas are affected where bare ice is at the surface, runoff in-creases by the same amount (23 Gt). The 10 % increase in melt (Fig. 9d) in regions with bare ice at the surface equals the increase in net shortwave radiation, which is in agreement
Fig. 9. The relative increase in snowmelt energy compared to the preceding simulation in Table 1. Panel FSGRAIN (a) shows the increase in snowmelt compared to the ANT simulation. As threshold a minimum of 10 mm w.e. snowmelt is used.
with Van den Broeke et al. (2008a) who showed that temporal variability in melt in the western ablation region of the GrIS is mainly driven by variability in shortwave radiation. In the future it is expected that SMB sensitivity to the background ice albedo will increase, since on average a larger area of bare ice will be present at the surface for a longer period each year (Fettweis et al., 2011). The relatively small differences in the accumulation zone in Fig. 9d cancel out in the mean and are due to small changes in the snowfall pattern in the different simulations.
In RSOOT we added 0.1 ppmv of black carbon to the snowpack. The direct effect on albedo, as discussed in Sect. 2.4, is displayed in Fig. 4: the albedo of fresh snow is reduced by 0.02 and that of older snow by up to 0.07, equivalent to an extra uptake of shortwave radiation of 10 % and 20 %, respectively. However, the increase in snowmelt is 48 % (+239 Gt), indicating the importance of positive
feed-backs. The increase in absorbed shortwave radiation heats the snowpack, resulting in larger snow grains, which in turn lowers the albedo and further enhances the absorption of shortwave radiation. The increase in runoff is larger than the increase in refrozen meltwater, owing to an earlier onset of melting as a result of which bare ice is exposed earlier in the season. The relative effect of black carbon on melt increases with height (Fig. 9e), from ∼ 10 % in the ablation region to over 200 % in the higher accumulation regions. Differences in the number of melt days (Fig. 8f) between RACMO2 and the satellite measurements is on average insignificant (Ta-ble 2), This demonstrates that a low soot concentration is required to obtain realistic melt behavior for RACMO2 over the GrIS.
In the final simulation (CONTROL) the background ice albedo field is applied (see Sect. 2.5). The total amount of melt is slightly reduced, because on average the BIA is 0.47,
slightly higher than the value in the preceding simulation (0.45). However, since BIA varies between 0.3 and 0.55, regional changes are significant, e.g. a ∼ 15 % increase in melt in the dark band in the western ablation area (Fig. 9f). For this final simulation there are still discrepancies of up to two weeks between the observed and modeled length of the melt season for 2007 (Fig. 8g), but the modeled average over the GrIS (17.4 %) is matching well with observations (17.3 %) (Table 2). The pattern of the regional differences, i.e. an underestimation of melt duration for the southern ab-lation region and an overestimation higher up the ice sheet, suggests that albedo is likely not responsible for the discrep-ancies shown; changing the albedo scheme settings alters the number of melt days in only one direction, i.e. a longer or shorter melt season for the entire ice sheet.
The experiments show that, when varied within realistic parameter spaces, the albedo scheme introduces variations in total surface mass balance averaged over the GrIS between +177 and +444 Gt for the year 2007, equivalent to 25 % and 62 % of the total precipitation, respectively. This underlines the strong sensitivity of Greenland SMB to surface albedo. It should be noted that the uncertainty in modeled Greenland SMB is not equally large, because results of the CONTROL experiment are in much better agreement with in situ mea-surements and satellite observations compared to the other experiments.
3.3 SMB along the K-transect
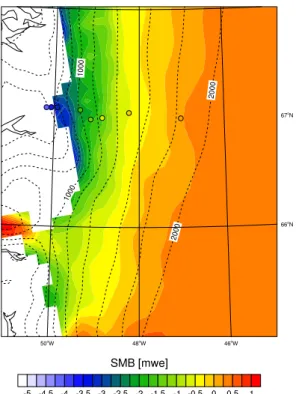
Figures 10 and 11 compare the averaged observed surface mass balance along the K-transect for the period 1991 to 2010 with results of RACMO2 using the CONTROL set-tings. The observed SMB ranges from −4 m w.e. at an al-titude of 500 m to +0.5 m w.e. at 2000 m. Between 700 and 1500 m a gradient in SMB of 3.8 m km−1 is measured. The CONTROL simulation has a gradient of 3.2 m km−1, a sig-nificant improvement compared to the 2.3 m km−1 in the density dependent albedo simulation. Between 1000 and 1700 m elevation, the total SMB is still underestimated by 0.5–1.0 m w.e. As a result, a discrepancy between the equi-librium line altitude in RACMO2 (around 1800 m in Fig. 10) and the stake measurements of 200 m is present. This offset is probably not related to albedo, since the remaining bias be-tween measured and modeled albedo at station S9 (1500 m) is too small to explain a discrepancy of 0.5 m w.e. Ettema et al. (2010a) demonstrated that the sensible heat flux (SHF) is overestimated by up to 20 W m−2at S6 and S9 for the
sum-mer months (JJA), equivalent to ±40 cm of ice melt. SHF can thus be regarded as a realistic candidate to explain the offset as seen in Fig. 11, especially because the overestimation of SHF by RACMO2 is not present at station S5. It should also be kept in mind that, especially in the area around the equilib-rium line, surface mass balance estimates derived from stake measurements have a large uncertainty, because the density
Fig. 10. Average surface mass balance for the period 1991–2010 in the K-transect region. The dots represent stake measurements. Height contours every 200 m.
of the melted (superimposed) ice and firn is not accurately known.
Figure 11 shows that RACMO2 predicts strong spatial variability in SMB at a constant altitude. This is directly related to the background albedo field; the blue and green dots in Fig. 11 can be easily linked in the lower ablation region (< 1200 m). As a first approximation, a decrease in background albedo of 0.07 is equivalent to a 0.5 m w.e. lower SMB. The use of a background ice albedo field thus improves the SMB results in the lower ablation region.
4 Summary and conclusions
We have used the regional atmospheric climate model RACMO2 to assess the sensitivity of the surface mass bal-ance (SMB) of the GrIS to a new snow and ice albedo scheme. The snow albedo scheme uses a prognostic snow grain size and introduces corrections for cloud cover, so-lar zenith angle and black carbon loading. We also applied a spatially variable background ice albedo field, based on 2000–2010 MODIS 16-day albedo retrievals. This affects especially regions with strong spatial ice albedo variabil-ity, such as the dark band in the western ablation zone. In situ SMB observations and satellite derived melt duration have been used to evaluate RACMO2 that now includes the new albedo scheme. With the new albedo scheme, RACMO2
Fig. 11. Observed SMB along the K-transect for the period 1991– 2010 with two times the standard deviation of annual values as error bars (black); RACMO2 simulated SMB as a function of height for grid points in the K-transect region for the previous (red, Ettema et al., 2009) and new (green) albedo scheme. Background ice albedo values (right axis) for the corresponding grid points are also shown (blue).
agrees better with albedo measurements at the K-transect in west Greenland, and especially at S9 where the offset be-tween modeled and measured net shortwave radiation is re-duced from 11.4 W m−2to 3.0 W m−2. The grain size depen-dent albedo scheme results in a steeper SMB gradient along the K-transect compared to the density dependent albedo scheme, and approaches the SMB gradient as derived from stake measurements.
The RACMO2 simulations for the year 2007 show a strong sensitivity of the SMB and the individual components on pa-rameter settings in the albedo scheme. GrIS total SMB varies between 177 and 444 Gt. The introduction of 0.1 ppmv black carbon to the albedo scheme has the strongest impact on total SMB with a drop of 164 Gt, with the strongest effect on melt (+100 %) in the accumulation area. Refreezing and retention of melt water also have a strong feedback on the albedo and thus SMB components. A doubling of the grain size of re-frozen snow results in up to 30 % more melt in the southern accumulation region and a 50 Gt lower SMB. An increased retention capacity of the snowpack leads to a uniform 10 % increase in melt, but since all the extra melt water is refrozen, the impact on SMB is negligible for a single year. Finally, the reduction of the ice albedo by 0.05 is of minor importance (SMB −20 Gt), however it will become more important if in a future warmer scenario a larger area of bare ice will be exposed at the surface for a longer period each year.
Acknowledgements. This work was supported by funding from the ice2sea programme from the European Union 7th Framework Programme, grant number 226375. Ice2sea contribution number 084. We would like to thank Roderik van de Wal for providing SMB data from the K-transect.
Edited by: I. M. Howat
References
Abdalati, W. and Steffen, K.: Snowmelt on the Green-land ice sheet as derived from passive microwave satel-lite data, J. Climate, 10, 165–175, doi:10.1175/1520-0442(1997)010<0165:SOTGIS>2.0.CO;2, 1997.
Abdalati, W. and Steffen, K.: Greenland ice sheet melt ex-tent: 1979–1999, J. Geophys. Res., 106, 33983–33988, doi:10.1029/2001JD900181, 2001.
Armstrong, R. and Brodzik, M.: An earth-gridded SSM/I data set for cryospheric studies and global change monitoring, Adv. Space Res., 16, 155–163, doi:10.1016/0273-1177(95)00397-W, 1995.
Boggild, C., Brandt, R., Brown, K., and Warren, S.: The ablation zone in northeast Greenland: ice types, albedos and impurities, J. Glaciol., 56, 101–113, doi:10.3189/002214310791190776, 2010.
Bougamont, M. and Bamber, J. L.: A surface mass balance model for the Greenland Ice Sheet, J. Geophys. Res., 110, F04018, doi:10.1029/2005JF000348, 2005.
Bougamont, M., Bamber, J. L., Ridley, J. K., Gladston, R. M., Greuell, W., Hanna, E., Payne, A. J., and Rutt, I.: Impact of model physics on estimating the surface mass balance of the Greenland ice sheet, Geophys. Res. Lett., 34, L17501, doi:10.1029/2007GL030700, 2007.
Box, J. E., Fettweis, X., Stroeve, J. C., Tedesco, M., Hall, D. K., and Steffen, K.: Greenland ice sheet albedo feedback: thermo-dynamics and atmospheric drivers, The Cryosphere, 6, 821–839, doi:10.5194/tc-6-821-2012, 2012.
Brun, E., Martin, E., Simon, V., and Gendre, C.: An energy and mass model of snow cover suitable for operational avalanche forecasting, J. Glaciol., 35, 333–342, 1989.
Col´eou, C. and Lesaffre, B.: Irreducible water saturation in snow: experimental results in a cold laboratory, Ann. Glaciol., 26, 64– 68, 1998.
Ettema, J., Van den Broeke, M. R., Van Meijgaard, E., Van de Berg, W. J., Bamber, J. L., Box, J. E., and Bales, R. C.: Higher sur-face mass balance of the Greenland ice sheet revealed by high-resolution climate modeling, Geophys. Res. Lett., 36, L12501, doi:10.1029/2009GL038110, 2009.
Ettema, J., van den Broeke, M. R., van Meijgaard, E., van de Berg, W. J., Box, J. E., and Steffen, K.: Climate of the Greenland ice sheet using a high-resolution climate model – Part 1: Evaluation, The Cryosphere, 4, 511–527, doi:10.5194/tc-4-511-2010, 2010a. Ettema, J., van den Broeke, M. R., van Meijgaard, E., and van de Berg, W. J.: Climate of the Greenland ice sheet using a high-resolution climate model – Part 2: Near-surface climate and en-ergy balance, The Cryosphere, 4, 529–544, doi:10.5194/tc-4-529-2010, 2010b.
Fettweis, X., Tedesco, M., van den Broeke, M., and Ettema, J.: Melting trends over the Greenland ice sheet (1958–2009) from
spaceborne microwave data and regional climate models, The Cryosphere, 5, 359–375, doi:10.5194/tc-5-359-2011, 2011. Fitzgerald, P. W., Bamber, J. L., Ridley, J. K., and Rougier, J. C.:
Exploration of parametric uncertainty in a surface mass balance model applied to the Greenland ice sheet, J. Geophys. Res., 117, F01021, doi:10.1029/2011JF002067, 2012.
Flanner, M. G. and Zender, C. S.: Linking snowpack micro-physics and albedo evolution, J. Geophys. Res., 111, D12208, doi:10.1029/2005JD006834, 2006.
Flanner, M. G., Zender, C. S., Randerson, J. T., and Rasch, P. J.: Present-day climate forcing and response from black carbon in snow, J. Geophys. Res., 112, D11202, doi:10.1029/2006JD008003, 2007.
Gardner, A. S. and Sharp, M. J.: A review of snow and ice albedo and the development of a new physically based broad-band albedo parameterization, J. Geophys. Res., 115, F01009, doi:10.1029/2009JF001444, 2010.
Grenfell, T. C., Warren, S. G., and Mullen, P. C.: Reflection of solar radiation by the Antarctic snow surface at ultraviolet, visible and near-infrared wavelengths, J. Geophys. Res., 99, 18669–18684, doi:10.1029/94JD01484, 1994.
Greuell, W. and Konzelmann, T.: Numerical modeling of the energy balance and the englacial temperature of the Green-land Ice Sheet. Calculations for the ETH-Camp location (West Greenland, 1155 m a.s.l.), Global Planet. Change, 9, 91–114, doi:10.1016/0921-8181(94)90010-8, 1994.
Hanna, E., Huybrechts, P., and Steffen, K.: Increased runoff from melt from the Greenland Ice Sheet: a response to global warming, J. Climate, 21, 331–341, doi:10.1175/2007JCLI1964.1, 2008. Hansen, J. and Nazarenko, L.: Soot climate forcing via snow
and ice albedos, P. Natl. Acad. Sci. USA, 101, 423–428, doi:10.1073/pnas.2237157100, 2004.
Kuipers Munneke, P., Van den Broeke, M. R., Lenaerts, J. T. M., Flanner, M. G., Gardner, A. S., and Van de Berg, W. J.: A new albedo parameterization for use in climate models over the Antarctic ice sheet, J. Geophys. Res., 116, D05114, doi:10.1029/2010JD015113, 2011.
Lenaerts, J. T. M., van den Broeke, M. R., D´ery, S. J., K¨onig-Langlo, G., Ettema, J., and Munneke, P. K.: Modelling snowdrift sublimation on an Antarctic ice shelf, The Cryosphere, 4, 179– 190, doi:10.5194/tc-4-179-2010, 2010.
Lenaerts, J. T. M, Van Den Broeke, M. R, D´ery, S. J, Van Meijgaard, E., Van De Berg, W. J., Palm, S. P., and Sanz Rodrigo, J.: Model-ing driftModel-ing snow in Antarctica with a regional climate model: 1. Methods and model evaluation, J. Geophys. Res., 117, D05108, doi:10.1029/2011JD016145, 2012.
Nick, F., Vieli, A., Howat, I. M., and Joughin, I.: Large-scale changes in Greenland outlet glacier dynamics triggered at the ter-minus, Nat. Geosci., 2, 110–114, doi:10.1038/NGEO394, 2009. Rignot, E., Box, J. E., Burgess, E., and Hanna, E.: Mass balance of
the Greenland ice sheet from 1958 to 2007, Geophys. Res. Lett., 35, L20502, doi:10.1029/2008GL035417, 2008.
Rignot, E., Velicogna, I., Van Den Broeke, M. R., Monaghan, A., and Lenaerts, J. T. M.: Acceleration of the contribution of the Greenland and Antarctic ice sheets to sea level rise, Geophys. Res. Lett., 38, L05503, doi:10.1029/2011GL046583, 2011. Simmons, A. J., Uppala, S. M., Dee, D. P., and Kobayashi, S.:
ERA-Interim: new ECMWF reanalysis products from 1989 onwards, ECMWF Newl., 110, 29–35, 2007.
Steffen, K. and Box, J.: Surface climatology of the Greenland ice sheet: Greenland Climate Network 1995–1999, J. Geophys. Res., 106, 33951, doi:10.1029/2001JD900161, 2001.
Stroeve, J.: Assessment of Greenland albedo variability from the advanced very high resolution radiometer Polar Pathfinder data set, J. Geophys. Res., 106, 33989–34006, doi:10.1029/2001JD900072, 2007.
Stroeve, J., Box, J. E., Gao, F., Liang, S., Nolin, A., and Schaaf, C.: Accuracy assessment of the MODIS 16-day albedo product for snow: comparisons with Greenland in situ measurements, Re-mote Sens. Environ., 94, 46–60, doi:10.1016/j.rse.2004.09.001, 2005.
Tedesco, M., Fettweis, X., Van den Broeke, M. R., Van de Wal, R. S. W., Smeets, C. J. P. P., Van de Berg, W. J., Serreze, M. C., and Box, J. E.: The role of albedo and accumulation in the 2010 melting record in Greenland, Environ. Res. Lett., 6, 014005, doi:10.1088/1748-9326/6/1/014005, 2011.
Van Angelen, J., van den Broeke, M., and van de Berg, W.: Momen-tum budget of the atmospheric boundary layer over the Green-land ice sheet and its surrounding seas, J. Geophys. Res., 116, D10101, doi:10.1029/2010JD015485, 2011a.
Van Angelen, J. H., Van den Broeke, M. R., and Kwok, R.: The Greenland Sea Jet: a mechanism for wind-driven sea ice ex-port through Fram Strait, Geophys. Res. Lett., 38, L12805, doi:10.1029/2011GL047837, 2011b.
Van de Wal, R. S. W., Greuell, W., Van den Broeke, M. R., Rei-jmer, C. H., and Oerlemans, J.: Surface mass-balance observa-tions and automatic weather station data along a transect near Kangerlussuaq, West Greenland, Ann. Glaciol., 42, 311–316, doi:10.3189/172756405781812529, 2005.
Van den Broeke, M., Smeets, P., Ettema, J., van der Veen, C., van de Wal, R., and Oerlemans, J.: Partitioning of melt energy and meltwater fluxes in the ablation zone of the west Greenland ice sheet, The Cryosphere, 2, 179–189, doi:10.5194/tc-2-179-2008, 2008a.
Van den Broeke, M. R., Smeets, C. J. P. P., Ettema, J., and Kuipers Munneke, P.: Surface radiation balance in the ablation zone of the west Greenland ice sheet, J. Geophys. Res., 113, D13105, doi:10.1029/2007JD009283, 2008b.
Van den Broeke, M. R., Bamber, J. L., Ettema, J., Rignot, E., Schrama, E., Van de Berg, W. J., Van Meijgaard, E., Velicogna, I., and Wouters, B.: Partitioning recent Greenland mass loss, Sci-ence, 326, 984–986, doi:10.1126/science.1178176, 2009. Van Meijgaard, E., van Ulft, L. H., Van de Berg, W. J., Bosveld,
F. C., Van den Hurk, B., Lenderink, G., and Siebesma, A. P.: The KNMI regional atmospheric climate model RACMO version 2.1, Tech. Rep. 302, Royal Netherlands Meteorological Institute, De Bilt, 2008.
Warren, S. G. and Clarke, A. D.: Soot in the atmosphere and snow surface of Antarctica, J. Geophys. Res., 95, 1811–1816, doi:10.1029/JD095iD02p01811, 1990.
Wientjes, I. G. M., Van de Wal, R. S. W., Reichart, G. J., Sluijs, A., and Oerlemans, J.: Dust from the dark region in the west-ern ablation zone of the Greenland ice sheet, The Cryosphere, 5, 589–601, doi:10.5194/tc-5-589-2011, 2011.
Wiscombe, W. J. and Warren, S. G.: A model for the spectral albedo of snow. I: Pure snow, J. Atmos. Sci., 37, 2712–2745, 1980.