www.elsevier.com / locate / chroma
Separation, identification and quantitation of ceramides in human
cancer cells by liquid chromatography–electrospray ionization
tandem mass spectrometry
a ,
*
b a b aM. Fillet
, J.-C. Van Heugen , A.-C. Servais , J. De Graeve , J. Crommen
a
` `
Department of Analytical Pharmaceutical Chemistry, Institute of Pharmacy, University of Liege, CHU, B36, B-4000 Liege 1, Belgium
b
` `
Department of Environmental Toxicology, University of Liege, CHU, B35, B-4000 Liege 1, Belgium
Abstract
Ceramides are important intracellular second messengers that play a role in the regulation of cell growth, differentiation and programmed cell death. Qualitative and quantitative analysis of these second messengers requires sensitive and specific analytical methods to detect endogenous levels of individual ceramide species and to differentiate between them. Nine synthetic ceramides were separated by liquid chromatography coupled to tandem mass spectrometry on a C18bonded silica column. The lipids were eluted in gradient elution mode using a mixture of water, acetonitrile and 2-propanol as mobile phase. They were detected by reaction monitoring performed on positive ion electrospray generated ions. Collision-induced fragmentations conducted on ceramides produced a well characteristic product ion at m /z 264, making multiple reaction monitoring (MRM) well suited for various ceramides quantitative measurements. After optimization of the extraction step, the proposed methodology was able to identify and quantify different ceramide species issued from human cancer cells. The method could be validated for C , C16 18 and C20 ceramides, quantified at the nanogram level. The validation exhibits good results with respect to linearity, accuracy and precision. 2002 Elsevier Science B.V. All rights reserved.
Keywords: Ceramides; Sphingolipids; Lipids
1. Introduction ceramide, a mechanism for the generation of
cer-amide exists through the action of cercer-amide synth-In addition to their major structural role as a ase. Accurate and precise analytical methods, able to barrier for cell permeability and as a matrix for the quantify selectively the various ceramide molecular association of membrane proteins, sphingolipids play species at low concentrations, are crucial for a key role in the signal transduction and cell elucidating their function and metabolism.
regulation. Various experimental approaches have
demonstra-Sphingomyelin hydrolysis to ceramides occurs ted that ceramides are key signaling molecules through the action of sphingomyelin-specific forms generated in response to a variety of stresses that of phospholipase C called sphingomyelinases. In mediate growth arrest, differentiation, senescence, addition to the breakdown of sphingomyelin to apoptosis or an immune response [1–6]. Nonethe-less, their mechanisms of action remain largely unknown. In view of the increasing interest in
*Corresponding author. Tel.: 366-4354; fax:
132-4-sphingolipid metabolites, sensitive and specific
meth-366-4347.
E-mail address: marianne.fillet@ulg.ac.be (M. Fillet). ods are required to measure their endogenous levels.
0021-9673 / 02 / $ – see front matter 2002 Elsevier Science B.V. All rights reserved. P I I : S 0 0 2 1 - 9 6 7 3 ( 0 1 ) 0 1 4 2 2 - 4
Structurally, the ceramides exhibit a long amino Until now, the diacylglycerol (DAG) kinase assay alcoholic chain covalently bound via an amide is the most commonly used procedure for ceramide linkage to a fatty acyl moiety (cf. Fig. 1). These quantitation [7,8]. The DAG kinase phosphorylates molecules can vary in length, degree of unsaturation ceramide into a radioactive product which is detected and hydroxylation, giving rise to a complex and by thin-layer chromatography (TLC). The principle diverse group of compounds. These lipids have limitations of the DAG kinase assay as well as the proven to be very difficult to analyse due to their TLC measurement are their requirement of high apolar nature, diversity and relatively low levels in sample volumes and their lack of discrimination
biological samples. capability between different ceramide species.
al other methods are also available for quantitation of 2.2. Instruments and methods sphingolipid metabolites by liquid chromatography
(LC). Since the ceramides lack a chromophore group The high-performance liquid chromatograph to allow a sensitive UV measurement, fluorescent or (HPLC) is a HP 1100 series; it is equipped with a radioisotope detection after derivatization were per- binary pump, a vacuum degasser, a thermostated ferred [9–11] All the above described procedures are column compartment and an autosampler, all from time-consuming and tricky derivatization steps might Agilent Technologies (Waldbronn, Germany). The often be source of error hampering the accurate HPLC separations were performed at 708C on a RP determination of the ceramides levels. The use of an C18 Nucleosil AB column (5 mm, 7032 mm I.D.)
¨
evaporative light-scattering detector for the ceramide from Macherey–Nagel (Duren, Germany). The mo-visualization and identification provides direct analy- bile phase was a gradient mixture formed as follows: sis without any prior derivatization [12]. A, water–acetonitrile–2-propanol (8:1:1, v / v / v); B, In the last few years, mass spectrometry method- acetonitrile–2-propanol (9:1, v / v). The steps of the ologies have been developed for the detection of gradient program were: 0 min 35:65 (A–B), 2 min ceramides [13–17]. This technique is also a powerful 35:65 (A–B), 7 min 10:90 (A–B), 13 min 10:90 tool for determining endogenous, physiologically (A–B), 15 min 0:100 (A–B), 16 min 35:65 (A–B), active compounds because of its high selectivity and 18 min 35:65 (A–B). The mobile phase was de-sensitivity. Electrospray ionization mass spec- gassed for 10 min in an ultrasonic bath before use. trometry (ESI-MS) has been successfully used for The flow-rate was 0.450 ml / min. The sample vol-several years for the analysis of peptides and proteins ume injected was 6 ml.
and it has been more recently extended to the MS detection was carried out using a Ultima triple analysis of other species like carbohydrates and quadrupole instrument (Micromass, Manchester,
lipids [15,17]. UK) operating under MassLynx 3.5 and configured
This work is focused on the separation and the with a Z-spray electrospray ionization source. identification of standard ceramides by liquid chro- Source conditions were as follows: positive ion matography–electrospray ionization tandem mass electrospray, capillary voltage 3.0 kV, cone voltage spectrometry (LC–ESI-MS–MS). The extraction 14 V, source temperature 1458C, desolvation tem-procedure of lipids from human cells was optimized perature 4508C, cone gas flow (nitrogen) 94 l / h and in order to obtain sufficient sensitivity. In human desolvation gas flow (nitrogen) 552 l / h. The MS– cancer cells, the endogenous ceramides were iden- MS fragmentation of the molecular ion was achieved tified and quantitatively measured. Finally, the pro- with a collision energy of 27 eV (collision gas:argon). cedure was validated for C , C16 18 and C20ceramides
and some analytical data are presented. 2.3. Preparation of standards
Standard solutions for ESI-MS–MS optimization were prepared by dissolving the ceramides in a
2. Experimental
mixture of ethanol–formic acid (99.8:0.2, v / v) to reach a concentration of 1 mg / ml.
2.1. Chemicals
2.4. Cellular lipid extraction C , C , C , C , C , C , C , C2 6 8 10 12 14 16 18 and C20
ceramides were obtained from Acros (Gell, Bel- Cells were rinsed twice with ice-cold
phosphate-gium). buffered saline (PBS), scraped in PBS, centrifuged at
Water, acetonitrile, 2-propanol, ethanol, formic 800 g and the resulting pellet was homogenized in acid were of HPLC grade from Merck (Darmstadt, distilled water by sonication. An aliquot of the cell
Germany). homogenate was taken for protein determination.
Nitrogen (alphagaz 1) and argon (alphagaz 2) were Then, 10 ng of C12ceramide (as internal standard) purchased from Air Liquide (Milmort, Belgium). was added to the cell lysate (the latter corresponding
to 500 mg of proteins). Lipids were extracted using For each of the tested ceramide, two main peaks the Folch’s partition with a mixture of chloroform– were observed corresponding respectively to the
1 1
methanol (2:1, v / v), centrifuged at 1500 g, and [M1H] and [M1H–H O]2 ionic species (Fig. 1). finally washed with chloroform–methanol–water Parameters such as the capillary and cone voltages, (3:48:47, v / v / v). The organic phase was evaporated as well as the cone and the desolvation gas flows near to dryness under a gentle stream of dry nitro- were optimized in order to generate the highest gen. The samples were reconstituted by vortexing protonated molecular ion under a stable spray (cf. with 200 ml of a mixture ethanol–formic acid Section 2.2).
(99.8:0.2) until complete dissolution.
To avoid any loss of lipids, the whole procedure 3.2. MS fragmentation of the ceramides was performed in siliconized glassware.
It has been shown previously that
collision-in-2.5. Cell preparation duced dissociations (CID) of ceramides in
electro-spray, positive ion mode, mainly generate the charac-HCT116 human colon carcinoma cells were cul- teristic product ions of m /z 264 and m /z 282, tured in McCoy medium (Life Technologies, Inc.) respectively, whereas other sphingosine metabolites supplemented with 10% fetal bovine serum, 1% 200 provided different fragmentation pathways [14]. mM L-glutamine, 100 units / ml penicillin and 100 These fragments resulted from the loss of the N-mg / ml streptomycin. Ovcar ovarian carcinoma cells, linked fatty acid moiety and one or two molecules of U937 lymphoid cells and MCF7 A / Z breast cancer water (cf. Fig. 2). This dissociation pattern could be cells were maintained in RPMI 1640 medium (Life confirmed for ceramides species varying in this N-Technologies) supplemented with 10% fetal bovine linked fatty acid moiety (2–20 carbons into the
serum, 1% 200 mM L-glutamine, 100 units / ml chain).
penicillin, and 100 mg / ml streptomycin. The cells The collision energy was optimized in order to were maintained at 378C in a 5% CO atmosphere.2 reach a maximum intensity for the fragment ion of m /z 264 resulting in a minimum response for the 2.6. Preparation of spiked samples for the
validation
Before the extraction process, five cell lysates (corresponding to 500 mg of proteins from HCT116 cells) were spiked with a constant amount of internal standard (10 ng of C ) and with increasing amounts12 of C18 and C20 (0, 2, 4, 8 and 16 ng) and of C16 (0, 5, 10, 20 and 50 ng). The lipids extraction were conducted according to the procedure described in Section 2.4.
3. Results and discussion
3.1. Optimization of the MS detection
The MS analysis of ceramides was first investi-gated by direct introduction of the reference
com-pounds dissolved in an ethanol–formic acid
(99.8:0.2) mixture using the electrospray interface in
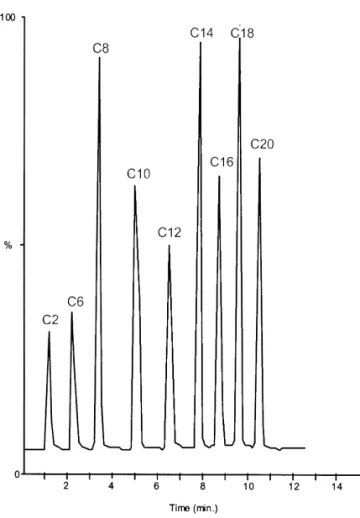
molecular ionic species (Fig. 3). The fragment ion obtained providing a clean reversed-phase (RP) LC– with the highest m /z ratio (m /z 264) was selected for MS–MS-MRM chromatogram.
quantitative MS detection in the multiple reaction To increase the sensitivity, two MRM signals were monitoring (MRM) mode. As MRM is based on the traced and added for the evaluation of each
cer-1
transition involving the specific molecular ion and a amide. The first MRM signal is [M1H] →m /z 264 characteristic fragment ion, high detection selectivity while the second corresponds to the [M1H–
1
as well as high signal-to-noise ratios could be H O]2 →m /z 264 transition.
3.3. Selection of the LC conditions 3.4. Comparison of the ceramides patterns observed in four cancer cell lines
The next step of this study concerned the
optimi-zation of the LC separations of the nine commercialy Once the LC and MS conditions were fully available ceramides (C , C , C , C , C , C , C ,2 6 8 10 12 14 16 optimized, identification of endogenous ceramides C18 and C20 ceramides, respectively). was achieved using four different cell lines: HCT116 The best separation of ceramide species was human colon carcinoma cells, Ovcar ovarian car-obtained on a reversed-phase column (C18 Nucleosil cinoma cells, U937 lymphoid cells and MCF7 A / Z AB column). Among a large number of potential breast cancer cells. In all of them, five ceramide buffers and organic solvents compatible with the species (C , C , C , C , C ) could be retrieved16 18 20 22 24 MS–MS detection, the mixture water–acetonitrile– but in different ratios. The MRM chromatograms of 2-propanol provided the best results in terms of the endogenous ceramides retrieved in the different selectivity. A multiple step gradient (cf. Section 2.2) cell lines are reported in Fig. 5.
has been developed in order to reach high selectivity
for the compounds with short migration times. The 3.5. Method validation MRM chromatogram recorded for the ceramide
synthetic mixture is depicted in Fig. 4. In order to generate quantitative results for those C , C16 18 and C20 ceramides, calibration curves were established by spiking different amounts of the corresponding natural ceramides (C , C16 18 and C )20 to HCT116 cell lysate (amount corresponding to 500
mg of proteins). For quantitative assessment, a
constant amount (10 ng) of non-naturally occurring C -ceramide internal standard was added to the12 mixture before starting the lipid extraction.
All values were expressed as the ratio of the peak areas of the natural ceramide to that of the internal standard. This was done in order to cope for possible variations in the extraction yield or / and to compen-sate for some instabilities in the MS parameters, which could affect ionization efficiency and ion counts.
3.5.1. Linearity
Calibration graphs were constructed with five levels in the range 0–16 ng for the C18 and C20 ceramides and in the range 0–50 ng for the C16 ceramide. Three determinations were performed at each concentration level (n 53). Linear regression lines were calculated by plotting normalised peak areas (ratios of peak areas of the natural ceramide to that of the internal standard) versus the spiked ceramide amount using the least-squares method with the hypothesis of homoscedasticity [18,19].
The linearity of the calibration curve was de-termined tracing each ceramide with two added
1 1
MRM signals: [M1H] and [M1H–H O] to m /z
Fig. 4. MRM chromatogram of nine standard ceramides (1 mg / 2
Fig. 5. MRM chromatogram of endogenous ceramides by LC–ESI-MS–MS in four cancer cell lines, HCT116 (colon), MCF7 A / Z (breast), U937 (lymphoid), Ovcar (ovarian). Time scale in minutes.
2
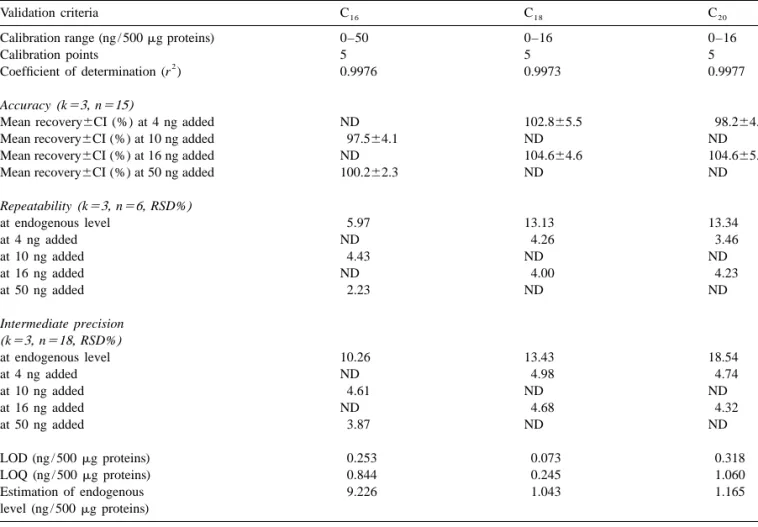
(r ) of 0.9976 for the C16 ceramide, 0.9973 for the C18 ceramide and 0.9977 for the C20 ceramide were obtained (cf. Fig. 6). The linearity was also con-firmed by an analysis of the variance (ANOVA) [18,19]. The regression parameters are given in Table 1.
3.5.2. Limits of detection and of quantitation Limits of detection (LOD) and quantitation (LOQ) correspond to signal-to-noise ratios of 3 and 10, respectively.
The LOD, the lowest amount of C18 ceramide that could be detected, was 0.073 ng for 500 mg of HCT116 proteins, which corresponds to 124 fmol. The LOQ, the lowest amount of C18 ceramide that could be quantified was 0.245 ng, which corresponds to 413 fmol.
For the C16ceramide, the LOD and the LOQ were 0.253 and 0.844 ng, respectively, for 500 mg of HCT116 proteins. For the C20 ceramide, the LOD
Table 1 Validation results
Validation criteria C16 C18 C20
Calibration range (ng / 500 mg proteins) 0–50 0–16 0–16
Calibration points 5 5 5
2
Coefficient of determination (r ) 0.9976 0.9973 0.9977
Accuracy(k53, n515)
Mean recovery6CI (%) at 4 ng added ND 102.865.5 98.264.2
Mean recovery6CI (%) at 10 ng added 97.564.1 ND ND
Mean recovery6CI (%) at 16 ng added ND 104.664.6 104.665.1
Mean recovery6CI (%) at 50 ng added 100.262.3 ND ND
Repeatability(k53, n56, RSD%) at endogenous level 5.97 13.13 13.34 at 4 ng added ND 4.26 3.46 at 10 ng added 4.43 ND ND at 16 ng added ND 4.00 4.23 at 50 ng added 2.23 ND ND Intermediate precision (k53, n518, RSD%) at endogenous level 10.26 13.43 18.54 at 4 ng added ND 4.98 4.74 at 10 ng added 4.61 ND ND at 16 ng added ND 4.68 4.32 at 50 ng added 3.87 ND ND LOD (ng / 500 mg proteins) 0.253 0.073 0.318 LOQ (ng / 500 mg proteins) 0.844 0.245 1.060 Estimation of endogenous 9.226 1.043 1.165 level (ng / 500 mg proteins) ND: not determined.
3.5.3. Accuracy for C18 and C20 ceramides; 0, 10 and 50 ng for C16
The method accuracy was determined at two ceramide). The RSD values were estimated from
different levels (n 56) covering the same range as repeatability and intermediate precision variances, that used for linearity (4 and 16 ng for C18 ceramide respectively [19,20].
and C ; 10 and 50 ng for C ). Mean recoveries20 16 As depicted from the data of Table 1, acceptable with confidence intervals (CI at P .0.05) are pre- results with respect to precision could be obtained. sented in Table 1. As the theoretical value of 100% The RSDs at the endogenous level, which is close to was included in the confidence interval, the test the LOQ for C20 ceramide, are relatively high but procedure could be considered as accurate over the still acceptable for analysis conducted on such
range studied. biological samples.
3.5.4. Precision
Method precision was determined by measuring 4. Conclusions
repeatability and intermediate precision
(between-day precision) (n 56). The study was carried out The method developed for the separation of during 3 days (k 53), at three levels (0, 4 and 16 ng ceramides present in human cancer cells using a
[6] M.E. Venable, Y.L. Lee, M.J. Smith, A. Bielawska, L.M.
LC–ESI-MS–MS procedure was found to be linear,
Obeid, J. Biol. Chem. 67 (1995) 27.
accurate, precise and sensitive to the nanogram level.
[7] P.P. Van Veldhoven, W.R. Bishop, D.A. Yurivich, R.M. Bell,
This method enables accurate and precise analysis Biochem. Mol. Biol. Int. 36 (1995) 21.
for ceramides issued from relatively small samples [8] A. Olivera, J. Rosenthal, S. Spiegel, Anal. Biochem. 223
providing a useful tool for signal transduction re- (1994) 306.
[9] A.H. Merrill, E. Wang, R.E. Mullins, W.C.L. Jamison, S.
search. In the future, this procedure will be used for
Nimkar, D.C. Liotta, Anal. Biochem. 171 (1988) 373.
studying the changes of endogenous ceramides
con-[10] M. Previati, L. Bertolaso, M. Tramarin, V. Bertagnolo, S.
centrations that could occur during cellular stress and Capitani, Anal. Biochem. 233 (1996) 108.
apoptotic process. [11] A. Olivera, S. Speigel, Nature 365 (1993) 557.
[12] T. McNabb, A. Cremesti, P. Brown, A. Fischl, Anal. Biochem. 276 (1999) 242.
[13] F.M. Rubino, L. Zecca, S. Sonnino, Biol. Mass Spectrom. 23
Acknowledgements
(1994) 82.
[14] M. Gu, J.L. Kerwin, J.D. Watts, R. Aebersold, Anal.
Bio-A research grant from the Belgium National Fund chem. 244 (1997) 347.
for Scientific Research (FNRS) to one of us (M.F.) is [15] M. Mano, Y. Oda, K. Yamada, N. Asakawa, K. Katayana, Anal. Biochem. 244 (1997) 291.
gratefully aknowledged. Many thanks are also due to
[16] L.H. Couch, M.I. Churchwell, D.R. Doerge, W.H. Tolleson,
FNRS for its financial support.
P.C. Howard, Rapid Commun. Mass Spectrom. 11 (1997) 504.
[17] A. Karlsson, P. Michelsen, O. Goran, J. Mass Spectrom. 33
References (1998) 1192.
[18] D.L. Massart, B.G.M. Vandeginste, S.N. Deming, Y. Michot-te, L. Kaufman, Chemometrics: a Textbook, Elsevier, Am-[1] C.J. Gamard, G.S. Dbaibo, B. Lui, L. Obeid, Y. Hannun, J.
sterdam, 1988, p. 75. Biol. Chem. 272 (1997) 16474.
[19] J. Caporal-Gautier, J.M. Nivet, P. Algranti, M. Cuilloteau, M. [2] T. Okazaki, T. Kondo, M. Tashima, Cell Signal 10 (1998)
Histe, M. Lallier, J.J. N’Guyen-Huu, R. Russoto, S.T.P. 685.
Pharma Prat. 2 (1992) 202. [3] Y.A. Hannun, Science 272 (1996) 1855.
[20] C. Hartmann, Analusis 22 (1994) M19. [4] L.M. Obeid, Y.A. Hannun, J. Cell Biochem. 58 (1995) 191.
[5] J.D. Fishbein, R.T. Dobrowsky, A. Bielawska, S. Garrett, Y.A. Hannun, J. Biol. Chem. 268 (1993) 9255.