HAL Id: hal-01872900
https://hal.archives-ouvertes.fr/hal-01872900
Submitted on 12 Sep 2018
HAL is a multi-disciplinary open access
archive for the deposit and dissemination of
sci-entific research documents, whether they are
pub-lished or not. The documents may come from
teaching and research institutions in France or
abroad, or from public or private research centers.
L’archive ouverte pluridisciplinaire HAL, est
destinée au dépôt et à la diffusion de documents
scientifiques de niveau recherche, publiés ou non,
émanant des établissements d’enseignement et de
recherche français ou étrangers, des laboratoires
publics ou privés.
the auditory afferent system
Charles Petitpré, Haohao Wu, Anil Sharma, Anna Tokarska, Paula Fontanet,
Yiqiao Wang, Françoise Helmbacher, Kevin Yackle, Gilad Silberberg, Saida
Hadjab, et al.
To cite this version:
Charles Petitpré, Haohao Wu, Anil Sharma, Anna Tokarska, Paula Fontanet, et al.. Neuronal
het-erogeneity and stereotyped connectivity in the auditory afferent system. Nature Communications,
Nature Publishing Group, 2018, 9 (1), �10.1038/s41467-018-06033-3�. �hal-01872900�
Neuronal heterogeneity and stereotyped
connectivity in the auditory afferent system
Charles Petitpré
1
, Haohao Wu
1
, Anil Sharma
1
, Anna Tokarska
1
, Paula Fontanet
1
, Yiqiao Wang
1
,
Françoise Helmbacher
2
, Kevin Yackle
3
, Gilad Silberberg
1
, Saida Hadjab
1
& François Lallemend
1
Spiral ganglion (SG) neurons of the cochlea convey all auditory inputs to the brain, yet the
cellular and molecular complexity necessary to decode the various acoustic features in the SG
has remained unresolved. Using single-cell RNA sequencing, we identify four types of SG
neurons, including three novel subclasses of type I neurons and the type II neurons, and
provide a comprehensive genetic framework that de
fine their potential synaptic
commu-nication patterns. The connectivity patterns of the three subclasses of type I neurons with
inner hair cells and their electrophysiological pro
files suggest that they represent the
intensity-coding properties of auditory afferents. Moreover, neuron type speci
fication is
already established at birth, indicating a neuronal diversi
fication process independent of
neuronal activity. Thus, this work provides a transcriptional catalog of neuron types in the
cochlea, which serves as a valuable resource for dissecting cell-type-speci
fic functions of
dedicated afferents in auditory perception and in hearing disorders.
DOI: 10.1038/s41467-018-06033-3OPEN
1Department of Neuroscience, Karolinska Institutet, Biomedicum, Stockholm 171 77, Sweden.2Aix-Marseille Université, CNRS UMR7288, Institut de Biologie
du Développement de Marseille (IBDM), 13009 Marseille, France.3Department of Physiology, University of California–San Francisco, San Francisco, CA
94158, USA. These authors contributed equally: Charles Petitpré, Haohao Wu, Anil Sharma. These authors share senior authorship: Saida Hadjab, François
Lallemend. Correspondence and requests for materials should be addressed to F.L. (email:[email protected])
123456789
T
he perception of sound is essential to receive information
from our environment, and to communicate and interact
socially. Hair cells (HCs) in the cochlea transduce sound
and convey its signal to the central nervous system via chemical
synapses on the spiral ganglion (SG) neurons dendrites
1,2. The
central afferents of these SG neurons converge to form the
auditory nerve, which connects to the cochlear nuclei in the
brainstem. The auditory nerve is the sole supply route of auditory
information from HCs to the brain, and contained processed
information about sound frequency, intensity, timbre, and pitch
which are all necessary for perceptual sound detections,
dis-criminations, and recognitions centrally
3–5. However, the cellular
basis of the processing and routing of these auditory qualities at
the periphery are still poorly understood.
Processing of the sound signal in the auditory nerve has been
hypothesized to originate in the diversity of biophysical
prop-erties of type I SG neuron
fibers (95% of auditory afferents). For
instance, frequency specific stimulus activation of specific
groups of afferents has been shown to reflect the contribution of
different SG
fibers with distinct temporal discharge
pat-terns
3,6,7. Another example of auditory
fibers diversity is the
intensity driven activation of selective auditory afferents
5,8,9,
where at least two populations of auditory
fibers can be
dis-tinguished on the basis of their threshold activity: the low
threshold (LT)
fibers and the high threshold (HT) fibers.
Additionally, HT
fibers have wide range of sensitivity to sound
levels which has been suggested to encode the enormous range
of intensities in the auditory system
5,8. Thus, since cochlear
transduction depends on an interaction between mechanical
processes but also the electrical properties of auditory afferents,
we need to understand how these, which are foundational for
the auditory experience, contribute more specifically to decode
the various features of the incoming sound and how their
dysfunction may lead to neural hearing impairments.
To further unravel the mechanisms of sound processing in the
peripheral auditory system, we used single-cell RNA sequencing
(scRNAseq) combined with genetic labeling to fully uncover the
molecular types of SG neurons. We identified four types of
neurons, including three novel subclasses of type I neurons and
the type II neurons, along with numerous new marker genes and
provided a comprehensive genetic framework that may shape
their synaptic communication patterns. Second, using newly
identified markers, we characterized the differential projection
patterns of the distinct subclasses of type I neurons to the inner
hair cells (IHCs), the actual sensory receptors, and recorded their
electrophysiological properties. Finally, a similar analysis on
developing SG neurons provided evidence of their perinatal
diversification, before the onset of hearing, as well as distinctive
expression patterns of key signaling pathway components
pre-dictive of this functional diversification. More generally, our study
unveils a large molecular heterogeneity in the cochlear afferent
system that delineates previously uncharacterized neuron types,
which likely represent discrete ascending channels that convey
distinct auditory information. In addition, it also constitutes a
RFP β3Tub 101 102 103 0 20 40 FACS SSC TOM intensity TOM+
a
c
PVCre;R26TOM SGNs Low Highb
h
g
f
e
Ia/Ic Ia Ib Ic II % of SG neuron types 0 20 40 60d
SG dissection Dissociation Calb1 Pou4f1 Runx1 Calb2 Lypd1 Grm8 Pou4f1 Runx1 Trim54 Pcdh20 Rxrg Calb2 Prph Plk5 Cacna1g Th Ia Ib Ic IIi
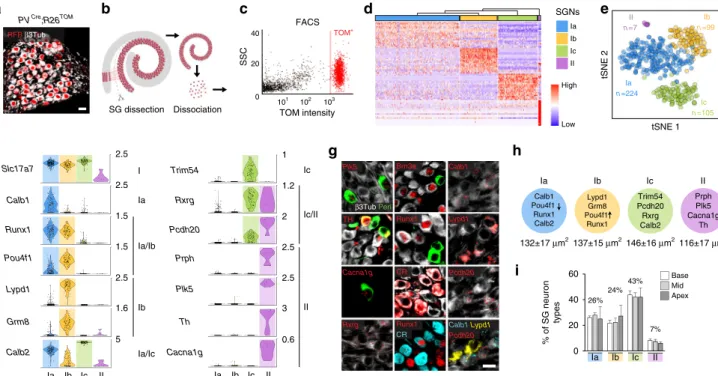
137±15 μm2 132±17 μm2 146±16 μm2116±17 μm2 26% 24% 43% 7% Base Mid Apex Ic n =105 II n =7 Ia n =224 Ib n =99 tSNE 1 tSNE 2 Slc17a7 Calb1 Runx1 Pou4f1 Lypd1 Grm8 Calb2 Trim54 Rxrg Pcdh20 Prph Plk5 Th Cacna1g Lypd1 Plk5 Rxrg Brn3a Runx1 CR Calb1 Pcdh20 TH Calb1 Lypd1 Pcdh20 Runx1 CR Cacna1g β3Tub Peri Ia Ib Ic II 5 1.6 2.5 1.5 1.5 2.5 2.5 Ia Ib Ia/Ib I Ia Ib Ic II II Ic/II Ic 2.5 3 0.6 2.5 2 1.2 1 Ia Ib Ic IIFig. 1 Identification and validation of four neuronal types in adult SG. a Genetic tracing of SG neurons (β3Tub+/RFP+) on P21 sections from PVcre;R26TOM mice.b Sketch depicting dissection of SG from the organ of Corti and their dissociation. c Fluorescence-side scatter plot of dissociated single cells showing
isolation of Tom+SG neurons through FAC sorting.d Heat map showing single-cell expression of the top 20 differentially expressed genes in the four
types of SG neurons, from combined data of P17, P21, and P33 neurons (SGNs, SG neurons). Dendritic tree shows the similarity between neuronal types.e
tSNE plot showing four distinct types of SG neurons.f Violin plots showing the expression of marker genes in log-transformed scale among the four
different populations of SG neurons.g In vivo validation of the identified SG neuron types by immunohistochemical and fluorescent in situ hybridization
using identified marker genes in P21 cochlea. Type II neurons were identified by peripherin (Peri), Plk5, TH, and Cacna1g specifically. Ia neurons were
identified by Calb1, Pou4f1, Runx1, and calretinin (CR). Ib neurons were identified by Lypd1, Runx1, and Pou4f1 and Ic neurons, by Rxrg, Pcdh20, and CR
expression. Note that co-localization on sections could never be observed for markers expressed in different populations of neurons in the scRNAseq data.
h Schematic representation of neuronal types with their key markers and their average soma size (inµm2) at P21.i Proportion of SG neurons types along
the tonotopic gradient (from base to apex) quantified by Runx1, Peri, and CR expression at P21 (n = 3 animals; Data are represented as mean ± SEM). Scale
toolbox to develop genetic approaches to examine the function of
the different SG neuron types in hearing.
Results
scRNAseq identifies new neuron types in the cochlea. The
majority of SG neurons are type I neurons; they are myelinated,
contact the inner hair cells (IHCs) and are the principal carrier of
the auditory signal. The other minority population (5%) of
neu-rons are called type II neuneu-rons; they are unmyelinated and
innervate the outer hair cells (OHCs), which modulate the output
of the organ of Corti
1. The few in vitro studies on their function
indicate they could report cochlear trauma
10,11.
To identify neuron types in adult SG neurons, a total of 487
tdTomato positive (TOM
+) cells from PV
Cre;R26
TOMcochlea of
postnatal stage 17 (P17), P21, and P33 were processed for
single-cell transcriptome analysis (Fig.
1
a–c). Note that all SG neurons
express parvalbumin (PV) and are TOM
+after recombination
(Fig.
1
a). The cell expression data were clustered using R package
SEURAT and visualized using bi-dimensional t-distributed
stochastic neighbor embedding (t-SNE), showing four distinct
neuronal types (Fig.
1
d–e). The type II neurons represented the
smallest cluster and were identified by their expression of the
known markers Prph
12(peripherin) and Th
13(Fig.
1
e–f). We
confirmed the type I identity of the three other clusters (thereafter
named Ia, Ib, and Ic types) by their high expression of the
transcription factor Prox1
14and lack of Prph (Fig.
1
e,
Supple-mentary Fig. 1a). Importantly, our initial clustering showed that
these neuron type identities were conserved at P17, P21, and P33
(Supplementary Fig. 1b).
We next explored this data set to identify novel markers of
the four types of SG neurons (Fig.
1
f, Supplementary Fig 1c;
Supplementary Data 1, 2). All type I neurons (Ia, Ib, and Ic)
were characterized by the expression of Slc17a6 (VGlut1),
Trpm2, Epha4, and abundant levels of Prox1, and the type II
population, by its expression of Prph, Npy (neuropeptide Y),
Th, Piezo2, and high levels of Cux2. The different subclasses of
type I neurons could be further distinguished based on unique
and combinatorial molecular profiles. Type Ia expressed Runx1,
Ttn (Titin), Calb1 and 2 (calretinin, CR), and low levels of
Pou4f1 (Brn3a). Type Ib was characterized by the expression of
Grm8 (mGluR8), Kcnc2 (K
v3.2), Lypd1, Runx1, and abundant
levels of Pou4f1. Finally, type Ic expressed Trim54 (MuRF3),
Rxrg and high levels of Calb2. We next confirmed in vivo the
existence of the four types of SG neurons by validating the
expression of genes enriched in specific cell types using
combinatorial labeling with new markers and transgenic mouse
lines (Fig.
1
g). In addition, we analyzed the soma size of each
neuronal type (Fig.
1
h) and calculated the percentage of each
type along the baso-apical axis of the cochlea, which
physiologically reflects the tonotopic gradient necessary for
encoding frequency specificity within the auditory nerve
8,15.
Using different combinations of newly identified specific
markers, the proportion of the four neuron types was found
to be relatively constant throughout the length of the cochlea:
7% for type II, 26% for type Ia, 24% for type Ib, and 43% for
type Ic (Fig.
1
i, Supplementary Fig. 1d-f). Also, we could not
observe any specific spatial patterning within the SG of any of
the type I neurons subclasses (Supplementary Fig. 1f-g).
Together, these results demonstrate the existence and validate
markers of four types of SG neurons. We investigate below the
transcriptional basis that contributes to define their distinct
neuronal identity.
a
Type II neurons
b
Types Ia/Ib/Ic neurons
Axogenesis Neurotransmission Morphogenesis Ion transport Metabolism 0 10 20 –log10(P) –log10(P) Synapse assembly Axogenesis Ion transport Metabolism Morphogenesis Neurotransmission Transcription factors
e
f
(proto)-Cadherins Sema-Plxn Eph-EphR Others Adhesiong
Cytoskeletonc
Type II Types Ia/Ib/Ic Node: GO term Node size: gene number Edge: Genes overlapIaIbIcII IaIbIcII IaIbIcII Tshz2 Nr1d2 Klf12 Mlxip Runx1 Tsc22d1 Nfic Pou4f1 Rora Zfp612 Sall2 Tcf25 Prox1 Esrrg Cbfa2t2 Pbx1 Tfdp2 Paxbp1 Maf Rxrg Hivep2 Atf3 Nfia Nr3c1 Mafb Gtf2ird1 Jun Klf13 Irf3 Mta3 Klf7 Ebf1 Pou4f2 Myt1l Cux2 Pbx3 Hey1 Cdh23 Dchs1 Fat1 Celsr2 Pcdh7 Cdh9 Cdh4 Pcdh9 * Pcdh20 * Pcdh17 * Sema3e Sema3d Sema3a Plxna1 Nrp1 Plxnc1 * Epha4 Epha7 Efna1 * Ephb1 Efna5 * Epha6 * Epha8 * Cadm3 Clstn1 Amigo3 Itga3 Lgals1 Tenm3 Alcam Robo2 Mcam * Kirrel3 * L1cam Ttn * Myo5b Tmod1 Iffo1 Tmod4 Ina Neb Nefh Nefl Nefm Krt222 Dmtn Myh14 Klc4 Kif5c Kif3a Cap2 Klc2 Tubb3 Fmn1 Myo9a Capzb Ablim3 Ablim1 Actn2* Actn4 Tuba1a Tuba4a Tuba8* Tubb5 Arpc5 Cap1 Fnbp1l * Kif21b Myo7a Prph * Tmod3 −1 −0.5 0 0.5 1 0 10 20
*Gene expression restricted to 1 population Ppargc1a Ndufa4 Sdhb Pkm Uqcrfs1 Cox8b Atp5g1 Atp5c1 Cyc1 Ndufs8 Ndufv2 Atp5f1 Ndufs1 Atp5b Sdhd Ndufb8 Ndufa10 Ndufs3 Sdha Uqcrc1 Cox5a Ndufs2 Atp5g3 Ndufv1 Cox5b Uqcrc2 Ndufb9 Atp5a1 Cox7b Ndufa5 Ndufa11 Ndufb6 Ndufs6 IaIbIcII
d
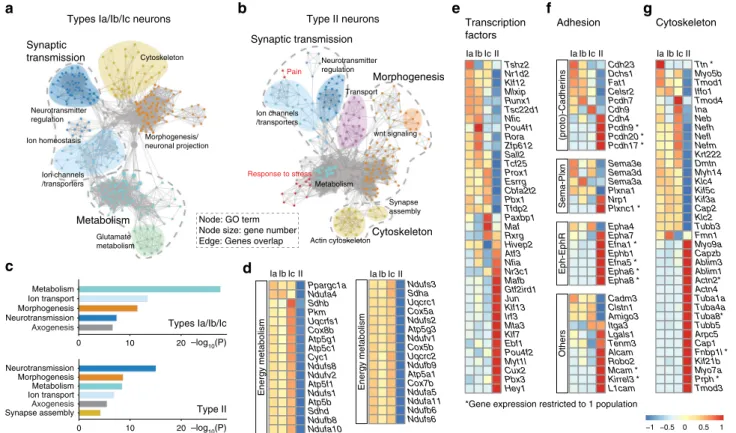
IaIbIcII Energy metabolism Neurotransmitter regulation Ion homeostasis Ion channels /transporters Morphogenesis/ neuronal projection Cytoskeleton Metabolism Synaptic transmission Glutamate metabolism Ion channels /transporters Neurotransmitter regulation Morphogenesis Actin cytoskeleton Synapse assembly Synaptic transmission Pain Transport wnt signaling Response to stress Cytoskeleton Metabolism Energy metabolismFig. 2 Comparative analysis of SG neurons transcriptomes. a, b Gene set enrichment analysis of types I (a) and type II neurons (b) visualized by network.
Each node represents a GO term, edges are drawn when there are shared genes between two GO terms.c Gene ontology analysis of the type I and type II
group. The graph shows most significant terms reflecting neuronal features. d Heatmaps showing expression of genes associated with energy metabolism
in each subclass of SG neurons.e–g Differential expression of transcription factors (e), cell-adhesion molecules including Cadherin, Semaphorin, and Ephrin family (f) and of cytoskeleton-related genes among the four subclasses of SG neurons (g) (see also Supplementary Fig. 2)
Comparative analysis of SG neurons. To get insights into the
major differences between the four types of SG neurons, we
first
conducted gene set enrichment analysis (GSEA) of the two most
distinct populations, i.e., type I and type II neurons. While highly
enriched gene ontology (GO) terms were associated with
neu-ronal cell functions, such as
“neurotransmission”, “ion transport”,
and
“axogenesis”, the most enriched category in the type I group
was
“metabolism” (Fig.
2
a, c, d), likely reflecting the large energy
demand of the myelinated type I neurons to ensure their high
sensitivity and temporal
fidelity
16,17. Also, this analysis identified
an enrichment of genes among the unmyelinated type II neurons
involved in
“response to stress” and “pain” mechanisms (Fig.
2
b),
which is consistent with their activation by cochlear damage
11.
To further complete the characterization of the four types of
SG neurons, we carried out a comparative analysis of their
differential expression of transcription factors, adhesion, and
cytoskeleton molecules. While numerous genes were specifically
expressed in type II neurons, a strict ON/OFF division amongst
the three subclasses of type I neurons was rarely observed
(Fig.
2
e–g, Supplementary Fig. 2), likely reflecting the importance
of a combinatorial basis of the code specifying a cell type.
Neurotransmission-related machinery in SG neurons. We next
analyzed in more detail gene families implicated in generic
neu-ronal
transmission,
including
voltage-gated
ion
channels
(VGICs), synaptic vesicle complex, neurotransmitter (NT)
receptors and transporters, and calcium-binding proteins, as they
all participate in the classification of neuron types by regulating
their electrophysiological profile (Fig.
3
a–c). SG neurons respond
mainly to glutamate released by HCs
16,18. Interestingly, the
relative expression of ionotropic glutamate receptors (iGluR)—
AMPA (Gria), Kainate (Grik), and N-methyl-
D-aspartate
(NMDA) (Grin) receptors—and of metabotropic glutamate
receptors (mGluRs, Grm) was particularly heterogeneous between
the type I and type II neurons. Only type I neurons were found to
express mGluRs (Grm7 in all three type I, and Grm8 only in type
Ib) which are mostly pre-synaptic and decrease neurotransmitter
release at the central synapse
19(Fig.
3
a–f, Supplementary Figs. 3
and 4a,b). Also, while type I neurons exhibited a homogeneous
pattern of iGluR expression, Gria3 and Grin1 were expressed at
much lower levels in type II neurons than in all other types,
whereas type II neurons instead specifically expressed Grik3,
Grin2c, and 3a. Grik4 and 5 were detected in all subtypes, albeit at
very low levels. These results suggest that type II neurons use both
AMPA and Kainate receptors, while type I neurons rely mainly
on AMPA receptors, as previously shown
16,18. Moreover, the
distinct composition of NMDARs subunits suggests
cell-type-dependent activation of different sets of NMDARs-interacting
molecules
20. Thus, together with the morphological differences of
the OHC-type II afferent synapse, the different expression of
iGluR by type II neurons could participate in vivo in establishing
their distinct synaptic responses; the frequency of synaptic events
and the size of synaptic potentials are considerably smaller in type
II afferent dendrites compared to type I afferents
10,21.
The electrophysiological properties of neurons are shaped by
the expression of several families of VGICs, which include the
sodium (Na
v), potassium (K
v), calcium (Ca
v) channels, and the
hyperpolarization-activated
cyclic
nucleotide-gated
(HCN)
Voltage-gated ion channels
Grm7 Grm8* Chrna4 Grin1 Gria3 Glrb Htr3a Htr7 Drd5* Grin2c* Grin3a* Htr2c* Grik3* Slc6a17 Slc17a7 Slc6a6 Slc6a8 Slc17a6 Slc2a3 Slc6a4* Slc1a4 NT receptors Peptides NT transporters Neurotransmission
a
Synaptic vesiclesb
Ca 2+ channels Na + channels K + channels IaIbIcII IaIbIcII IaIbIcII IaIbIcII IaIbIcII IaIbIcII Ia Ib Ic II Drd5* Grin2c* Grin3a* Grik3* Htr3a Htr7 Htr2c* Chrna4 Cacng5 Cacna1c Sncg Snca* Syt1* Syt13* Vamp8* Vamp2 Vamp4 Syt4 Cacna1b Cacna1g* Cacna2d2* Cacna1e* Sncg Syngr1 Cacnb3 Cacna1b Ia Ib Ic II Slc17a6 Slc17a6 Slc17a6 Slc6a4* Slc1a4 Slc2a3 IaIbIcIId
Calcium channel Synaptic vesicle NT transporter NT receptor Calcium channel −1 −0.5 0 0.5 1 Post-synaptic Pre-synaptic Cacng2 Sv2c/b Stx1b Stxbp1 Nsf Vamp1 Syt2/3/7 Snap25 Cplx1 Slc6a6 Slc6a8 Slc6a17 Slc17a7 Kcnip2 Kcnip3 Kcnip4 Kcns3 Kcnip2 Kcnc2 Kcnip4 Kcns3 Hcn3 Kcna6* Kcnc2 Kcnc4* Kcnh5 Kcnip1 Kcnk1 Kcnma1 Kcns1 Kcnh2 Hcn2 Kcna1/2 Kcnab2 Kcnab3 Kcnc1/3 Grin1 Glrb Gria3 Potassium channel CN HC SGN Post-Pre-e
f
Cacnb3 Cacng2 Cacng5 Cacna1b Cacna1c Cacna1e* Cacna1g* Cacna2d2* Scn1a Scn1b Scn4b Scn8a Scn2b Scn3b* Scn9a* Hcn2 Hcn3* Hcn Kcnh2 Kcns1 Kcnip1 Kcnip2 Kcnip3 Kcnab2 Kcna1 Kcna2 Kcnc3 Kcnip4 Kcns3 Kcnk1 Kcnh5 Kcnc1 Kcnma1 Kcnab3 Kcnc2 Kcnc4* Kcna6* Best3 Nalcn Ttyh2 Trpm2 Asic1 P2rx6 Ano3 Ano2* Trpc3* Trpv2* Clic1* Piezo2* Other ion channelsSv2c Sv2b Syt3 Nsf Syt7 Syngr1 Cplx1 Snap25 Stx1b Stxbp1 Syt2 Vamp1 Sncg Snca* Syt1* Syt13* Syt4 Vamp2 Vamp4 Vamp8* Calb1* Casq1 Cabp1 Calm1 Calm2 Cib2 Ncs1 Calb2 Necab1* Necab2*
c
Ca2+-binding protein Hcrtr2 Oprl1 Npy* Gpr149* Gpr88* NT receptor Grm7 Grm8* * Gene expression restricted to 1 populationBrainstem
Fig. 3 Input–output communication transcriptional signature of SG neurons. a Differential expression of voltage-gated ion channels family among SG
neurons.b, c Differential expression of neurotransmission systems including neurotransmitter (NT) receptors, peptides-related molecules, NT
transporters, and synaptic vesicles (b) and of calcium-binding protein (c) among SG neurons (see also Supplementary Fig. 3). d Sketch of the SG neuron
(SGN) synaptic connection with HC peripherally and with the cochlear nuclei (CN) in the brainstem. Arrows shows direction of the signal transmission.e, f
Schematic representation of the transcriptional portrait of the post-synaptic (e) and pre-synaptic (f) sites of SG neuron types, based on differentially
channels
22. VGICs exhibited extensive differential expression
profiles amongst the different types of SG neurons, sharply
distinguishing type II from type I neurons (Fig.
3
a–f). Although
Ca
v, Na
v, and HCN channels families showed modest differences
amongst the different subclasses of type I neurons, K
vchannels
differed substantially in these neuron types. Activation of K
vchannels shapes the pattern of neuronal
firing and excitability
and drives the rate of adaptation to sustained stimuli
23. Their
differential expression could participate in the expected distinct
physiological characteristics of the different subclasses of type I
neurons
5,8,24(Fig.
3
d–f and Supplementary Fig. 4a and b).
The excitability of auditory afferents is also regulated by the
lateral and medial olivocochlear (LOC and MOC) efferents which
innervate respectively the type I and type II peripheral endings
underneath the HCs and modulate their sensitivity
1,2,25. Note
that the MOC efferents make also direct synaptic contacts with
OHCs. The MOC system is cholinergic and GABAergic while the
LOC system can be divided into at least cholinergic and
dopaminergic components and also contain serotonin, GABA
and many neuropeptides, including enkephalins, dynorphins, and
calcitonin gene-related peptide (CGRP)
25,26. Surprisingly, the
receptors for these peptides were absent from all SG neurons, as
were dopamine receptors, with the exception of Drd5 that was
expressed in type II neurons, and Drd1a in type Ib neurons, albeit
both at low levels (Supplementary Fig. 4c). The ionotropic
GABA
Areceptor subunit Gabrb3 and metabotropic receptor
Gabbr1/2 (GABA
B1/2) were uniformly expressed amongst SG
neurons. In contrast, nicotinic acetylcholine receptors (nAChRs,
which are ionotropic) were differentially expressed: Chrnb2 in all
SG neurons, Chrna7 in type II and Chrna4 in type Ic, all at low
levels in general. Interestingly, only the type II neurons expressed
serotonin receptors (mostly Htr2c and 7) (Fig.
3
b; Supplementary
Fig. 4c). Thus, with regards to the very low abundance of
receptors for acetylcholine (Ach), dopamine, and opioids, these
results suggest that the prevalent negative feedback control of SG
afferents activity is GABAergic, through both ionotropic and
metabotropic receptors. In parallel, a serotonergic positive
feedback could also modulate the type II neurons (Fig.
3
d–f).
One of the ways by which the strength of activation of a
synapse can be modulated is by regulating neurochemical delivery
by pre-synaptic terminal through actions on exocytosis
27. During
this process, the cooperation between Synaptotagmins (Syt),
complexins (Cplx), N-ethylmaleimide sensitive factor (Nsf), the
SNAREs proteins synaptobrevin 1 (Vamp1), syntaxin (Stx), and
SNAP-25 (Snap25), as well as Munc18-1 (Stxbp1) and Rab3a
(Rab3a) is essential for synaptic targeting and membrane
fusion
27. Their enrichment within the type I neurons group
supports a fast exocytosis at the auditory nerve endings (Fig.
3
b,
Supplementary Fig. 4c). In line with this, the enrichment of
500 pA 100 pA 0.2 s 20 mV 20 mV 750 pA 0.2 s 20 mV
b
f
a
CR RFP CR RFP 0 0 50 100 UA MAe
UA MAType Ia and Ic Type Ib
% of Ib
% of Ia / Ic
Unitary adapting (UA) Multi-adapting (MA)
c
d
50 100 0.5 s 0.5 s –70 mV –70 mV 20 mV 750 pA –70 mV –70 mVLatency to first AP(ms) AP amplitude (mV) fAHP (mV) Threshold (mV) AP half-width (ms) 10 ms 20 mV 320 pA **** –300 –200 –100 –90 –80 –70 –60 Current (pA) Steady voltage Peak voltage –400–200 0 200 –120 –80 –40 Current (pA) Voltage (mV) Voltage (mV) Steady voltage
h
i
g
j
–50 –40 –30 –20 AP threshold (mV) –60 –50 –40 –30 0 20 40 60 80 0 400 800Rheobase (pA) Latency first AP
(ms) Rectification index for peak IV 2 6 10 Time constant (ms) Resting potential (mV) 0 0.5 1.0 1.5 Ia/c Ib - UA Ib - MA **** ** *** **** ** Peak voltage –70 –0.5 0 50 100 150 200 250 0 10 20 30 40 Inter-spike interval (ms) APmax UA MA Ib - MA
Fig. 4 Electrophysiological characterization of SG neurons types. a, c
Immunohistochemistry of RFP+neurons after culture and patch-clamp
recordings from SG neurons from P21, PVCre;R26TOMmice illustrating Ia/Ic
types (CR+) and Ib type (CR−).b, d Correspondence of SG neuron types
and theirfiring patterns, illustrating that all Ia/Ic neurons (n = 28) are
unitary spike accommodating (UA) and 50% of Ib neurons (n= 11) are UA
while the other 50% (n= 11) are multiple spikes accommodating (MA). e
Representative whole-cell current-clamp recordings from UA and MA
neurons from P21 SGNs.f Different accommodation rates and action
potentialfiring patterns of representative UA (left) and MA (right) neurons
in response to suprathreshold step current injections.g Graphs of the
current–voltage relationship illustrating the state and peak IV responses for UA (left) and MA (right) types. Note steeper slope for peak voltage in MA cells than UA suggesting stronger rectification. h Plots of inter-spike interval (ISI) vs action potential (AP) max of the stained SG neurons, illustrating the diversity of type Ib neurons.i Schematic representation of
measured action potential parameters (fAHP—fast
after-hyperpolarization). Bottom, AP shape of UA (blue) and MA (gray) neurons showing different AP threshold and rheobase values, along with different
AP kinetics (latency, duration, and fAHP).j Comparison of basic
electrophysiological parameters highlighted in (h) between Ia/Ic, Ib UA,
and Ib MA SG neurons. Data are represented as mean ± SEM (**P≤ 0.01,
*** P≤ 0.001, **** P ≤ 0.0001; t-test between Ia/c UA and Ib MA
Slc17a7 (VGLUT1) in type I afferents enables efficient recovery of
synaptic vesicles during prolonged stimulation
28(Fig.
3
b,
Sup-plementary Fig. 4c). In addition, by regulating calcium
avail-ability, which triggers the fusion step
27, the differential expression
of calcium-binding proteins could also participate in the distinct
firing dynamics of SG neurons
29(Fig.
3
c).
Altogether, our data provide core molecular features of SG
neuron types whose differential expression may underlie their
input–output communication properties.
Electrophysiological profiles of type I neurons. We next asked
whether the three distinct subclasses of type I SG neurons also
exhibit
unique
electrophysiological
properties.
Whole-cell
recordings were made from isolated SG neurons after
dissocia-tion to capture their key electrophysiological properties at the
soma level. Analysis of current-clamp recordings revealed a high
degree of diversity amongst the 133 recorded neurons in terms of
action potential
firing patterns and intrinsic passive and active
properties. Two main groups could be easily distinguished based
on their accommodation rate to step current injections: unitary
spike accommodating/phasic cells (UA, n
= 107 cells, 80% of
neurons) and multiple spikes accommodating cells (MA, n
= 26
cells, 20% of neurons, also characterized by a sustained
firing over
200 ms long current steps) (Supplementary Fig. 5a), as shown at
earlier stages
24. UA cells were not able to
fire more than a single
action potential in response to a prolonged depolarizing step,
while MA
fired multiple action potentials with frequencies that
increased by incrementing current intensity (Supplementary
Fig. 5a). Post hoc immunostaining on 50 cells revealed that all Ia
and Ic neurons (28 TOM
+/CR
+neurons in a PV
Cre;R26
TOMcontext) corresponded to UA type (Fig.
4
a, b, e–g, Supplementary
Fig. 5b), while the Ib population (22 TOM
+/CR
−neurons) was
equally comprising either UA (11 cells) or MA type (11 cells)
(Fig.
4
c, d, e–g) raising the possibility that the Ib type could be
further subdivided. Moreover, neurons with an MA profile
showed high variability in the number of spikes they
fired with
prolonged depolarization current (Fig.
4
h).
To further describe the two SG neuron populations, we
performed a more detailed analysis of their action potential
properties. Only the Ib neurons with a MA profile differed
significantly in most analyzed parameters (Fig.
4
i–j,
Supplemen-tary Fig. 5c). In general, UA cells exhibited higher depolarization
threshold compared to MA cells, their resting membrane
potential was more hyperpolarized and they required stronger
current injections to discharge action potentials. MA cells
fired in
response to smaller current injections, responded slowly and with
a longer latency and had wider action potentials. Also, a slow
after-hyperpolarization (AHP) was more prominent among MA
cells. Other distinctive features of MA cells were their
pronounced rectification of the current–voltage (I–V)
relation-ship, larger Ih-mediated sag, shorter membrane time constant,
and a high variability in their maximal frequency discharge,
reaching up to 106 Hz (mean
= 51 Hz).
To correlate the physiological data of SG neurons to their
molecular profile, we found that Kcnc2 (K
v3.2) exhibited a
contrasted expression profile in type Ib neurons, identifying two
populations, which reinforces the possibility of a subdivision of
type Ib in two subtypes (Supplementary Fig. 5d). One did not
express Kcnc2 while the other expressed variable levels of Kcnc2.
K
v3.2 has been shown to play an important role for sustaining
repetitive
firing
23,30. Thus, these two populations could refer to
the UA and MA types of Ib neurons, respectively. In line with
this, type Ia and Ic neurons, which are UA type, did not express
Kcnc2 (Supplementary Fig. 5d). To the best of our analysis, Kcnc2
was the only candidate gene in our neurotransmission-related
gene data set to show this contrasted expression in type Ib
neurons. In view of the importance of K
v3 channels in the
regulation of the
firing properties of neurons
31, it will be
% of RFP + type I SG neurons RFP L ypd1 CR
Brn3aCreERT2;R26TOM
a
b
c
Type II afferents Type I afferents HT LT IHC OHCs β3Tub RFP 0 50 100 Ia/c Ib RFP CR Merged CR Myo6 Merged CR PV 1 IHCs Aff CR 4d
HCs afferent innervation 12 Modiolar side (MS) Pillar side (PS) IHC 3 4h
Area of CR/PV 1 2 3 4 0 0.5 1 PS MS ST side SV side IHCsg
e
f
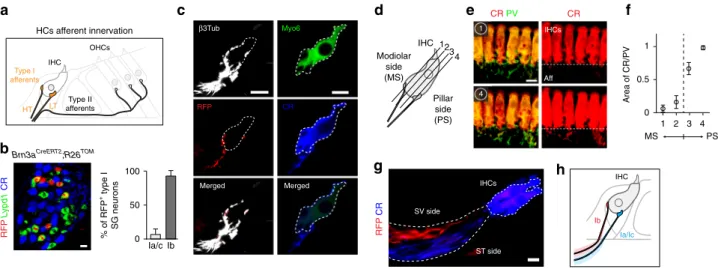
Ib Ia/Ic IHCFig. 5 Innervation pattern of IHCs by type I neurons. a Sketch representing the afferent innervation of the mature organ of Corti, and illustrating the spatial
segregation of the peripheral projections and synaptic contacts of high threshold (HT) and low threshold (LT) SG neuronfibers with IHCs. HT fibers
innervate the modiolar side while LTfibers, the opposite, pillar side of IHCs. b Genetic labeling of Ib neurons using Brn3aCreERT2;R26TOM, injected with tamoxifen at P21 and analyzed on cross-section at P30. About 96% of RFP+cells were Lypd1+and were CR−, confirming their Ib identity (n = 3 animals). c In Brn3aCreERT2;R26TOMmice, RFP+Ibfibers innervate the modiolar side, while CR+Ia and Icfibers, the pillar side of IHCs. In the merged panel for the CR (Ia/Icfibers) and Myo6 (IHC) staining, the IHC is shadowed to better visualize the innervation. d Schematic of the position of sections shown in e and f. e
Whole mount staining of P21 cochlea, using CR and PV immunostaining in WT mice. The images show the presence of CR+fibers on the pillar side (PS,
section #1) and their absence on the modiolar side (MS, section #4) of IHCs, while PV+afferents are observed on either side (Aff: afferents).f
Quantification of the distribution of CR+afferentfibers at different section levels of the IHCs (from the modiolar side to the pillar side) by measuring the area of the CR+fibers within the area of PV+fibers at different levels of the IHC innervation, as shown in d and e (n = 4 animals). Note that no CR+fibers were observed outside the PV+fibers area. g In Brn3aCreERT2;R26TOMmice (seeb), the peripheral projections of Ib (RFP+) and of Ia/Ic (CR+) neurons
within the osseus lamina are segregated and occupy the scala vestibuli (SV) and scala tympani (ST) sides, respectively.h Schematic summary of the IHC
interesting to assess in vitro and in vivo the role of K
v3.2 in the
physiology of type Ib neurons and in hearing.
Although our data obtained on dissociated neurons do not
reflect the actual biophysical properties of the post-synaptic SG
neurons during synaptic transmission of inputs from IHCs, they
do demonstrate a high heterogeneity of electrophysiological
properties among SG neuron types. These neuron types could
conceivably correspond to the auditory units with distinct
thresholds to sound stimulation in vivo
5,8.
Spatial segregation of type I afferent terminals. Multiple type I
afferents (10–20 in mice) receive input from one IHC
32—in
comparison, a single type II neuron receives input from a dozen
of outer HCs (OHCs)
1. Remarkably, the position of these type I
afferent terminals around the IHC circumference determines
the
fibers’ threshold sensitivity
8,33,34. Fibers with high
thresh-olds (HT afferents) to acoustic stimuli have been shown to
contact the modiolar side (facing the modiolus) of the IHC
while those with lower acoustic thresholds (LT afferents), their
opposite, pillar side (facing the pillar cells)
8,9,34,35(see scheme
in Fig.
5
a). Differences in threshold sensitivity are important for
expanding the dynamic range of the cochlea, and would provide
a means for discriminating sounds in a background noise
5,34.
They also strongly suggest the existence of distinct ascending
circuits and, consistent with this, specialized neuron types. To
Ib n = 149 II n = 19 Ia n = 174 Ic n = 136
a
c
b
Types Ia/Ib/Ic neurons
d
Type II neurons Morphogenesis Neural projection Ion channels /transporters Neurotransmitter regulation Cytoskeleton Metabolic process Response to stimuli Metabolism Neurotransmitter regulation Secretion Cytoskeleton Ion homeostasis Ion channels /transporters Morphogenesis 1 0.91 1 0.86 0.99 1 0.58 0.71 0.7 1 0.65 0.75 0.75 0.83 1 0.83 0.87 0.84 0.69 0.88 1 0.8 0.88 0.88 0.69 0.87 0.98 1 0.76 0.87 0.88 0.69 0.86 0.95 0.99 1 0 0.25 0.5 0.75 1 Pearson correlation Ib Ia Ic II Ib Ia Ic II Ib Ia Ic II II Ic Ia Ib P3 Adult P3 Adult Adult P3 Ia Ib Ic IIf
g
e
Grin2c Kcnab2 Kcnc4 Pvalb Scn4b Cacna1e Fxyd7 Gabra2 P2rx3 Sncg Synpr 0 1 2 3 4 5 –2 –1 0 1 Avg_logFC –Log10 ( p _val) Adult P3 Type II Type Ia Asic3 Kcna1 Kcna2 Kcnab2 Kcnab3 Kcnc1 Scn4b Scn8a Slc24a2 Snap25 Calb1 Fxyd7 P2rx3 Scn3b Sncg Vamp2 0 20 40 60 80 –2 –1 0 1 –Log10 ( p _val) Avg_logFC Adult P3h
Neurotransmission-related genes tSNE 1 tSNE 2 tSNE 1 tSNE 2 tSNE 1 tSNE 2 Calb1 Runx1 Lypd1 Pou4f1 Mgat4c Cdh9 Calb2 Cxcl14 Rxrg Pcdh20 Prph Th Etv4 Gabrg2 Ia Ib Ic II Lypd1 Gabrg2 Rxrg Brn3a Runx1 Calb1 Pcdh20 Etv4-GFP Calb1 Lypd1 Pcdh20 Runx1 CR Plk5 β3Tub Peri TH II Ic/II Ib Ic Ia/Ib Ia/Ic 3 2 1.5 2 1 4 0.8 1.2 1.7 2.5 2.5 3 1.5 1.5 Plk5Node size: gene number Edge: genes overlap Node: GO term
Fig. 6 SG neuron types in new born mice and comparative analysis of their transcriptome with adult SG neurons. a t-SNE of SG neurons showing four different clusters at P3.b Violin plots showing the expression of marker genes in log-transformed scale. c In vivo validation of the identified neuron types by
immunohistochemical andfluorescent in situ hybridization using identified marker genes in P3 cochlea. Type II SG neurons were identified by Peripherin
(Peri), Plk5, Etv4 (Etv4GFPtransgenic mouse), TH, and Gabrg2. Ia neurons were identified by Pou4f1, Runx1, and CR. Ib neurons were identified by Runx1 and Pou4f1 and Ic neurons, by Rxrg, Pcdh20, and CR expression. Lypd1 and Calb1 expression could not distinguish type Ia from Ib neurons at this stage. Note that
co-localization on sections could never be observed for markers expressed in different populations of neurons in the scNRAseq data.d Gene set
enrichment analysis of P3 type I and type II SG neurons visualized by network.e Correlation analysis of SG neuron types from adult and P3 stages, using
average expression of all differentially expressed genes as input.f, g Visualization of SG neuron types from adult and P3 stages using tSNE, revealing the
conserved subclass identities between the two samples.h Volcano plots of gene expression differences between adult and P3 SG neuron types for type Ia
test whether the molecular differences we identified between SG
neuron types could underlie the cellular basis of this functional
diversity, we
first made use of the high expression of Pou4f1
(Brn3a) in type Ib neurons to selectively trace their nerve
endings below IHCs using Brn3a
CreERT2;R26
TOMmice and
limiting tamoxifen exposure (a single injection at P21) (Fig.
5
b).
Indeed, a single injection of tamoxifen in P21 Brn3a
CreERT2;
R26
TOMmice lead to a sparse labeling of mostly type Ib neurons
at P30 (94% of RFP
+type I neurons are Ib neurons, with 25%
efficiency within the Ib population). Combined with
CR immunostaining to label the projections of type Ia and Ic
neurons, this sparse labeling strategy revealed on cross-sections
and in cochlea whole mount that TOM
+Ib
fibers consistently
innervated the modiolar side of IHC, while CR
+Ia and Ic
fibers, the pillar side (Fig.
5
c, Supplementary Fig. 6a-c).
Importantly, both CR and TOM positive
fibers did not
co-localize with synaptotagmin positive pre-synaptic nerve
end-ings underneath the IHCs, excluding the possibility that
these
fibers were efferents (Supplementary Fig. 6b-c-e).
A quantitative analysis of CR
+(only in Ia/Ic neurons) vs PV
+(in all neurons)
fibers underneath the IHCs in cochlea whole
mount of WT mice further confirmed the specific projection of
Ib neurons to the modiolar and of the Ia/Ic neurons to the pillar
(Ia/Ic) side of the IHCs (Fig.
5
d–f, Supplementary Fig. 6d-e).
Strikingly, the segregation of type I afferent projections was
already defined in the osseus spiral lamina region, where
per-ipheral axons of all SG neurons merge and project towards
the sensory epithelium (Fig.
5
g). Thus, Ib
fibers were
system-atically positioned on the scala vestibuli (SV) side of the
nerve bundle, while the Ia and Ic
fibers, on the scala tympani
(ST) side. Altogether, these data demonstrate that genetically
distinct subclasses of type I SG neurons are associated with
specific peripheral projection profiles with IHCs that correlate
well with the distinction between LT and HT afferents
8,34(Fig.
5
h).
Neuronal diversity in the cochlea is established at birth. In
mice, pups are born deaf and become responsive to sound
sti-mulation after P10
36. Before the onset of hearing, neuronal
activity in the SG is triggered by IHCs spontaneous activity
37,
which begins at about P4 and affects the maturation of the
IHC-afferent synapses and certainly of different other cell types in the
cochlea
37–39. We therefore investigated the timing of
establish-ment of SG neurons diversity, with respect to this critical
maturation period. Unbiased clustering of 478 SG neurons from
P3 cochlea mice revealed again four distinct types of SG neurons,
in proportion similar (P > 0.05) to those observed in adult mice
(Fig.
6
a, Supplementary Fig. 7a-b). As in adult SG, the expression
of transcription factors such as Pou4f1 and Runx1 was specific to
the Ia and Ib types. The type Ic and II neurons were characterized
respectively by a specific, transient expression of Cxcl14 and Etv4
(PEA3) (Fig.
6
b, c; Supplementary Fig. 7c), distinguishing the two
types from adult stages. Interestingly, both Epha4 and Prph,
described previously as early postnatal type I and type II neuron
markers respectively
13,40, were more widely expressed, with
EphA4 found in all neuron types, and Prph, in both type II and Ic
neurons (Fig.
6
b, Supplementary Fig. 7c-f; Supplementary Data 3,
4). Moreover, the four neuron types could be already identified at
P0 (Supplementary Fig. 7g), suggesting that the molecular
path-ways that specify the generation of the four SG neuron types
precede and are independent of the postnatal maturation of the
organ of Corti and of spontaneous or stimulus-driven activity.
Through GSEA of P3 SG neuron types, we observed that
“neurogenesis” and “morphogenesis/neuronal projection” were
among GO terms with the highest representation in type II
neurons (Fig.
6
d). By contrast, the most enriched term in type I
neurons concerned genes associated with metabolism, as was
described earlier for the adult type I group (Fig.
6
d). In line with
this, a correlation analysis of adult and P3 SG neuron types
revealed high similarity between the two stages (Fig.
6
e–g). This
was
particularly
visible
for
gene
families
related
to
e
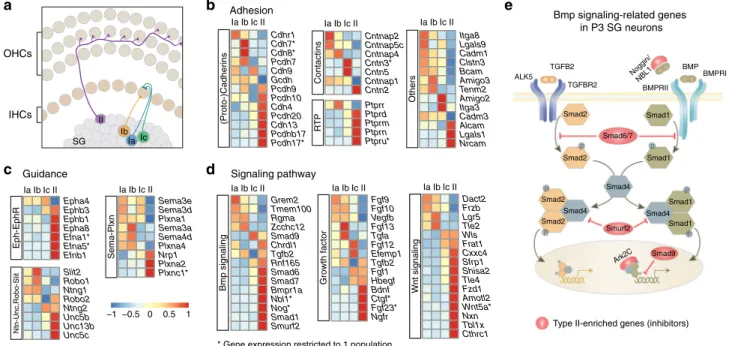
Grem2 Tmem100 Rgma Zcchc12 Smad9 Chrdl1 Tgfb2 Rnf165 Smad6 Smad7 Bmpr1a Nbl1* Nog* Smad1 Smurf2 (Proto-)Cadherins Contactins RT P Others Sema-Plxn Eph-EphR Ntn-Unc,Robo-Slit Guidanceb
Sema3e Sema3d Plxna1 Sema3a Sema4d Plxna4 Nrp1 Plxna2 Plxnc1* Epha4 Ephb3 Ephb1 Epha8 Efna1* Efna5* Efnb1 Slit2 Robo1 Ntng1 Robo2 Ntng2 Unc5b Unc13b Unc5c Cdhr1 Cdh7* Cdh8* Pcdh7 Cdh9 Gcdh Pcdh9 Pcdh10 Cdh4 Pcdh20 Cdh13 Pcdhb17 Pcdh17* Cntnap2 Cntnap5c Cntnap4 Cntn3* Cntn5 Cntnap1 Cntn2 Ptprr Ptprd Ptprm Ptprn Ptpru* Itga8 Lgals9 Cadm1 Clstn3 Bcam Amigo3 Tenm2 Amigo2 Itga3 Cadm3 Alcam Lgals1 Nrcam Adhesion IaIbIcII IaIbIcII IaIbIcII IaIbIcII IaIbIcII IaIbIcII IaIbIcII IaIbIcII Dact2 Frzb Lgr5 Tle2 Wls Frat1 Cxxc4 Sfrp1 Shisa2 Tle4 Fzd1 Amotl2 Wnt5a* Nxn Tbl1x Cthrc1 Fgf9 Fgf10 Vegfb Fgf13 Tgfa Fgf12 Efemp1 Tgfb2 Fgf1 Hbegf Bdnf Ctgf* Fgf23* Ngfr P P P P P P Smad2 Smad2 Smad1 Smad1 Smad2 Smad2 Smad4 Smad4 Smad1 Smad1 Smad6/7 Smad4 Smurf2 BMPRII BMPRI BMP Noggin/ NBL1 ALK5 TGFBR2 TGFB2 Smad9 Ark2C Growth factor Wnt signaling Bmp signalingc
Type II-enriched genes (inhibitors) Bmp signaling-related genes
in P3 SG neurons
* Gene expression restricted to 1 population −1 −0.5 0 0.5 1
d
Signaling pathwaya
Ib Ic Ia II SG OHCs IHCsFig. 7 Functional signature of neonatal SG neuron types. a Schematic illustration of the mature connection pattern of auditory afferents with HCs. A single type II afferent travels through the OHCs area and receives synaptic inputs from several OHCs. A single-IHC makes synaptic contact with several type I neurons. Ia and one Ic afferent contact the pillar side, and Ib afferent contact the modiolar side of IHC.b–d Differential expression of adhesion-related genes (RTP, receptor tyrosine phosphatase), of guidance molecules and of genes linked to key signaling pathways including Bmp signaling, Wnt signaling,
and growth factors among SG neurons at P3 (see also Supplementary Fig. 9).e Schematic illustration of the Bmp signaling using gene expression data from
neurotransmission (Fig.
6
h, Supplementary Fig. 8), in which only
a few number of genes showed different expression between P3
and adult stages. These results strengthen the idea that functional
diversification of SG neuron types displayed prior to experience
includes mature and distinct synaptic communication signatures
that persist in adult neurons.
Cell-to-cell communication machinery in P3 SG neurons. We
next compared transcriptional differences amongst neonatal SG
neuron types, focusing on gene sets commonly involved in
neu-rodevelopmental processes, such as
“axon guidance”, “adhesion”,
and
“signaling molecules”. These most likely participate to the
establishment of their innervation pattern and to the specificity of
their synaptic connections with HCs (Fig.
7
a), efferents and
central targets. As expected, the different types of SG neurons
exhibited various combinations of gene expression (Fig.
7
b–d,
Supplementary Fig. 9). For instance, several genes of the
Eph-Ephrin families (Ephb1/3, Epha8, Efna1/5, Efnb1) were
particu-larly enriched in type II neurons, likely participating in the
intricate growth of their projections within the OHCs area
(Fig.
7
a, b). Interestingly, several members of the cadherin,
proto-cadherin and contactin cell surface molecules, which are critical
in the control of synaptic partner specificity, displayed very
dis-tinct expression profiles across the four populations of neurons
41(Fig.
7
b). In the cadherin family for instance, Cdh7 and 8 were
enriched in type Ib, Cdh9 in types Ia and Ic and Cdh4 and 13, in
type II neurons. For those categories of molecules, their relative
levels of expression in different neighboring cells can generate
discrete, local synaptic connection patterns. Thus, their
interac-tions between synaptic partners could participate in the correct
matching of each afferent types with particular cellular domains
of HCs and efferent endings during development
42–44.
We also found that whereas all SG neurons expressed the
machinery necessary for the activation of the TGFB signaling,
many inhibitory modulators of this pathway (Smad6, Smad7,
Nog, Nbl1, Smad9, Smurf2) were particularly enriched in the type
II neurons, arguing for a specific role of this signaling only in type
I neurons (Fig.
7
d, e). More generally, each of the major signaling
pathways manifested differential expression amongst SG neuron
types, highlighting their potential contribution to the
character-istic connection patterns and physiological properties of each cell
type.
Altogether, our results provide an extensive set of differentially
expressed genes among neonatal SG neurons that will help future
investigations of the molecular programs that control the
diversification and connection patterns of SG neuron types.
Discussion
Despite evidence supporting physiological diversity of primary
auditory neurons, their molecular identification and thus the
study of their individual function in the neuronal encoding of the
distinct properties of sounds has remained unresolved. Using
unbiased single-cell RNA profiling, morphological, and
physio-logical analyses, we provide evidence for molecularly distinct
types of auditory neurons in the cochlea as well as an extensive
resource for future studies in hearing research.
Our results identified four distinct types of adult SG neurons,
including three novel subclasses of type I neurons (Ia, Ib, and Ic
neurons) and the type II neurons, which can be distinguished
based on unique and combinatorial molecular profiles. These four
types of SG neurons exist at birth, which strongly suggests that
initial neuronal diversification in the cochlea is established by
molecular processes independent of neuronal activity or sensory
experience.
We found that a comprehensive analysis of the combinatorial
expression of genes involved in neuronal transmission reveals a
specific molecular profile of each neuron type that underlies their
unique transcriptional signature of input/output communication.
These particular profiles agree with well-studied physiological
properties of SG neurons, such as their metabolic status,
pre-ference for AMPA-mediated or kainate-mediated synaptic
transmission or their expression of various VGICs or receptors to
efferent-derived neurotransmitters and neuromodulators
2,16,18,25.
They further extend the molecular characterization of SG neurons
but also, more important, they provide an extensive cell to cell
phenotype that can be used to predict or confirm physiological
features.
For instance, the transcriptome of type II neurons suggests that
they would be part of a particular response to a local stress
(Fig.
2
b), which is consistent with their activation by ATP and
closure of K
v7 potassium channels induced by damage of the
organ of Corti
10,11. Interestingly, our data show that amongst K
v7
channels and purinergic receptors (P1, P2X, and P2Y receptors),
only Kcnq2 (K
v7.2) and P2rx4 (P2X4) and to a lesser extent,
P2rx7 (P2X7), which both code for ATP-gated ion channels (P2X
receptors), are expressed in adult type II neurons (Supplementary
Data 1). On the other hand, P2Y receptors, which are
metabo-tropic and can be activated by ATP or UTP, have been shown to
be upregulated in all SG neurons following noise trauma
45. P2Y
receptors activation can regulate the excitability of neurons via
the inhibition of the M-current, which is mediated by members of
the K
v7 channels and reduces neuronal excitability
46–49. Thus,
this suggests a two-step activation mechanism of type II neurons
following noxious noise exposure: a
first through glutamate (via
AMPA/Kainate receptors) and ATP (via P2X receptors) released
from OHCs and the damaged organ of Corti, respectively, and a
second (likely delayed) by inactivating K
v7.2-mediated M-current
and thus sensitizing type II neurons through a specific UTP–P2Y
metabotropic pathway. Interestingly, we also discovered that
while serotonin is expressed in both the lateral and medial
efferent systems
50, only the type II neurons express receptors for
serotonin (Htr2c and 7, coupled to G
q/G
11and G
s, respectively),
suggesting a third mode of type II neurons excitation or
sensiti-zation by serotonin receptor activation (Supplementary Fig. 10).
The diversity of type I SG neurons has been described for
decades, with cells showing distinct connection pattern and
firing
properties
5,8,9,24,33,34,51. So far however, the cellular and
mole-cular mechanisms proposed to underlie these differences involved
variation in ribbon size at the IHC-afferent synapse, pre-synaptic
specialization at the IHC active zone or the patterns of lateral
efferents innervating the post-synaptic bouton of auditory
affer-ents
34,52,53. Although these mechanisms could exert significant
roles on the sensitivity differences among auditory afferents, our
data demonstrate the existence of three genetically distinct
sub-classes of type I neurons that could reflect specific coding of the
vast range of intensity levels the auditory system processes
5. Their
molecular profile, connection and electrophysiological patterns
strongly suggest that the Ia and Ic populations represent the LT
auditory afferents while the Ib type, the HT afferents. Several
observations support this hypothesis. First, peripheral projections
of Ib and of both the Ia and Ic afferents travel separately to
innervate the modiolar and the pillar sides of IHCs, respectively, a
segregation previously associated with the different threshold
sensitivities of the auditory afferents
1,2,8,33,34. Second, the Ib
neurons display a wide range of accommodation and spiking
rates, which has been previously described and could provide a
cellular substrate to encoding various stimulus intensities
24.
Third, Kcnc2 (K
v3.2), whose expression and function characterize
neurons capable of sustained or repetitive
firing
23,30, is uniquely
contribute to the molecular setting that controls the various
firing
patterns of Ib neurons. Finally, the proportion of Ib neurons
increases in the cochlea of the rat (Supplementary Fig. 11) which,
as the cat and macaque monkey, shows
finer sensitivity in
detecting intensity changes compared to mouse
54. This could
suggest that the more HT SG neurons, the
finer sensitivity to
intensity changes. Together, our results are thus consistent with
the general idea of distinct specialized populations of SG neurons
that would provide a neuronal substrate to process sound
intensity information
5,8,33,34,51. Moreover, they suggest that,
similarly to what has been shown in the visual system
55, within a
particular neuronal population (i.e., Ib neurons), the continuum
of variable biophysical properties of neurons could in fact be
genetically determined so that specific groups of few neurons
would be tuned to a particular range of intensities. This also
supports future work aimed at validating in vivo the physiological
role of Ib neurons in sound intensity coding and at resolving
whether the Ia and Ic populations represent two functionally
distinct populations or reflect certain local environment.
Overt hearing loss and self-perceived hearing handicap, which
includes speech-in-noise recognition disabilities, tinnitus, and
hyperacusis are often associated with degeneration or dysfunction
of auditory afferents. Moreover, recent work showed that HT SG
neurons are more vulnerable to loud sound
56,57, and suggested
that a progressive HT neuropathy might represent an important
contributor to the hearing handicap observed with ageing
58,
highlighting a selective vulnerability of HT SG neurons. Our
comprehensive transcriptomic characterization of the four types
of SG neurons will thus facilitate comparative analysis of
homologous cell types with other species, but also linking gene
expression to cellular function and auditory perception as well as
their alteration with hearing disorders. In this context, future
studies will be needed to also identify the dedicated output
neurons and associated ascending circuits needed to process
centrally the peripheral information encoded by each individual
SG neuron type.
Methods
Mouse strains. Wild-type C57BL/6 mice were used unless specified otherwise. Rosa26TOM(Ai14, Stock No: 007914, C57Bl/6 background), PVCre(Stock No:
017320, C57Bl/6 background), mice were ordered from The Jackson Laboratory.
EphA4GFP(Stock No: 011107-UCD, mixed Swiss Webster and C57bl/6
back-ground) was ordered from MMRRC. Brn3aCreERT2(mixed 129Sv and C57BL/6
background, from CCTEC, Cornell) mice was described elsewhere59. Animals were
group-housed, with food and water ad libitum, under 12-h light–dark cycle con-ditions. All animal work was performed in accordance with the national guidelines and approved by the local ethics committee of Stockholm, Stockholms Norra djurförsöksetiska nämnd. Animals were killed when reaching a score of 0.3 on Karolinska Institute’s extended health assessment list. Animals used for this study were of either sex for postnatal experiments, and males from P17 onwards.
Tamoxifen-induced sparse labeling. Tamoxifen induction of Brn3aCreERT2;
Rosa26tdTOMmice was performed by single intraperitoneal injection of 2 mg per
25 g.bw into P21 mice. Mice were harvested at P30, and efficiency of recombination was analyzed using immunostaining for RFP and calretinin (Ia and Ic neurons) and in situ hybridization for Lypd1 (Ib neurons) on spiral ganglion sections. The degree of recombination in spiral ganglion neurons was very low and variable between animals and litters. Only animals showing a recombination efficiency of about 25% within the Ib population of cochlear neurons were considered for analysis. In these animals, ~94% of RFP+recombined type I neurons were Ib neurons, confirming the specificity of our sparse labeling strategy for the Ib afferents.
Single-cell isolation. Spiral ganglia were dissected and collected in Leibovit’z L-15 medium (Life technologies) on ice. Then the spiral ganglia (SG) were incubated in papain–DNAse solution (1.5 ml of papain at 1 mg ml−1, 0.5 ml of DNAse at 0.1%)
for 35 min (for P3 samples) or 25 min (for Adult samples) at 37 °C, shaking at 700 RPM. After spinning down the samples at 400 RCF for 10 min, the supernatant was removed and replaced by Dulbecco’s modified Eagle’s medium (DMEM) F-12 (Life technologies). SG were physically triturated using three different sizes of pipettes previously coated with 0.2% bovine serum albumin until the solution
homogenized. The cell suspension was thenfiltered through 70 μm cell strainer (BD Biosciences) to remove clusters of cells.
Fluorescence-activated cell sorting. Single Tomato or GFP positive cells were sorted by FAC sorting into individual wells of 384-well plates containing lysis buffer. Plates containing single cells were frozen immediately on dry ice and stored at−80 °C. We used six animals (12 cochleae) per experiment.
Cell culture. After centrifugation of the single cells, pellets were reconstituted in 1 ml of culture media [Neurobasal-A, supplemented with 2% B27 (v/v),L-glutamine 0.5 mM, penicillin 100 U ml−1; Invitrogen] complemented with 10 ng µl−1of BDNF and NT3 (Sigma-Aldrich) and 10% of fetal bovine serum. Cells were plated on square glass coverslips previously coated with poly-D-lysine and laminin (Nordic Biosite). SG neurons were cultured for 48 h to allow the detachment of Schwann cells from neuronal cells and the culture media were changed every 24 h. Single-cell RNA sequencing. Smart-Seq2 protocol was performed on single isolated cells by Eukaryotic Single Cell Genomics Facility at SciLifeLab, Stockholm. The protocol was described previously60,61. A total of 487 adult SG neurons were isolated
from PVcre,R26TOMmice and for P3 stage, a total of 478 SG neurons were isolated:
359 from PVcre,R26TOMmice (P3, sample A), and 119 SG neurons, from EphA4GFP
mice (where GFP expression is labelling all SG neuron types without distinction at P3, see Supplementary Fig. 7) (P3, sample B). RNAseq data from sample A and B were indistinguishable and were therefore merged to increase the sample size.
Electrophysiological recordings. Recordings were made from neuronal somata at room temperature. Neurons were obtained from P21 to P25 PVCre;R26TOMmice.
The bath solution was composed of (in mM): 125 NaCl, 25 glucose, 25 NaHCO3,
2.5 KCl, 2 CaCl2, 1.25 NaH2PO4, 1 MgCl2and saturated with 95% oxygen and 5%
CO2. Cells were visualized using IR-DIC microscope (Olympus, TYO, Japan) and
digital camera. Tomato-expressing PV+cells were identified by switching from infrared to epi-fluorescence mode using a LED source and LED control module (Mightex BioLED, CA, USA). Patch pipettes with resistances of 6–10 MΩ were pulled with Flamming/Brown micropipette puller P-1000 (Sutter Instruments Co, Novato, CA) andfilled with intracellular solution containing (in mM): 130 K-gluconate, 5 KCl, 10 HEPES, 10 Na2-Phosphocreatine, 4 ATP-Mg, 0.3 GTP-Na and
with pH adjusted with KOH to 7.3 and osmolarity: 288 mOsm l−1. Liquid junction potential was not corrected for. Recordings were performed with pipette capaci-tance and access resiscapaci-tance compensated throughout the experiment. Acceptable current-clamp recordings had to meet the following criteria: low noise level, stable membrane potential, and overshooting APs (magnitudes of≥60 mV from baseline) and access resistance below 20 MΩ. If any of these parameters changed during an experiment, the remaining data were not further analyzed. Recordings were amplified using multiclamp 700B amplifiers (Molecular Devices, CA, USA), filtered at 2 KHz, digitized (10–20 KHz) using ITC-18 (HEKA Elektronik, Instrutech, NY, USA), and acquired and analyzed with Igor Pro (Wavemetrics, OR, USA). Remote control SM7 system (Luigs Neumann, Germany) was used to control manipulator, read, and save XYZ coordinates of recorder cells in the dish for later identification. Stimulation protocols. >The intrinsic electrical properties were determined by a series of hyperpolarizing and depolarizing somatic current injection protocols, during whole-cell patch-clamp recordings, designed to capture their key active and passive electrical properties. All recordings were carried out in current-clamp mode and because dependency of the accommodation rate on the holding membrane potential was not observed at this post hearing stage, all cells were recorded at−70 mV. Several parameters were obtained from recorded cells: resting membrane potential was measured at the onset of whole-cell recording. IV (the current–voltage relationship) was extracted by a series of subthreshold current injections with addition scaling factor multiplying steps accordingly to resistance and rheobase to obtain optimal resolution for each cell. Input resistance for steady state was calculated as the slope of the regression linefit to steady-state membrane potential responses to−5 pA current injection from rest. Voltage threshold for evoking action potential (AP) was measured as the value of the membrane potential at which itsfirst derivative (dV/dt) crossed 10 mV s−1in response to step
depolarization from resting potential and rheobase was the minimal depolarizing current to reach threshold and elicit an action potential. Membrane time constant was determined byfitting the decay phases of hyperpolarizing pulses to an expo-nential function. AP max: maximal number of AP elicited in response to 200 ms lasting suprathreshold step current reaching three times stronger current than rheobase. Inter-spike interval (ISI): measured as the difference in time between the onsets of thefirst two APs. Parameters assessed included also action potential waveform AP duration: average time for thefirst AP from onset to the same voltage during offset. AP onset: defined as the time near the voltage inflection when the voltage changes more than 0.5 mV within 50 µs. AP latency: time from the threshold to peak of the AP. AP duration half-width: average time for thefirst AP from half amplitude to the same voltage during offset. Sag, the response to a hyperpolarizing current step: was measured as the difference between exponentially extrapolated voltage and steady-state voltage and analyzed to reveal the existence of hyperpolarization-dependent inward currents. Slow after-hyperpolarisation