HAL Id: hal-02804715
https://hal.inrae.fr/hal-02804715
Submitted on 5 Jun 2020
HAL is a multi-disciplinary open access archive for the deposit and dissemination of sci-entific research documents, whether they are pub-lished or not. The documents may come from teaching and research institutions in France or abroad, or from public or private research centers.
L’archive ouverte pluridisciplinaire HAL, est destinée au dépôt et à la diffusion de documents scientifiques de niveau recherche, publiés ou non, émanant des établissements d’enseignement et de recherche français ou étrangers, des laboratoires publics ou privés.
Characterization of the inhibitory effect of peach surface
phenolic compounds on the conidial germination and
pathogenicity of Monilinia laxa
Fan Su
To cite this version:
Fan Su. Characterization of the inhibitory effect of peach surface phenolic compounds on the conidial germination and pathogenicity of Monilinia laxa. [Internship report] Université d’Avignon et des Pays de Vaucluse (UAPV), FRA. 2012, 39 p. �hal-02804715�
Characterization of the inhibitory effect of peach surface phenolic compounds on the conidial germination and pathogenicity of Monilinia laxa de SU Fan est mis à disposition selon les termes de la licence Creative Commons Attribution - Pas d’Utilisation Commerciale - Pas de Modification 3.0 France.
MASTER AGROSCIENCES
Gestion de la Qualité des Productions Végétales
Parcours Biologie et Environnement des Plantes
2
émeannée
Characterization of the inhibitory effect of peach surface phenolic
compounds on the conidial germination and pathogenicity of
Monilinia laxa
SU, Fan
Lieu de stage :
Institut National de la Recherche
Agronomique
UR407 Pathologie Végétale
Domaine St Maurice – CS 60094
F – 84143 Montfavet cedex, France
Encadrement :
Maître de Stage : NICOT Philippe
POESSEL Jean-Luc
QUILOT Bénédicte
Acknowledgments
I would like to thank firstly, all the faculty of the University of Avignon and the professionals implicated in the training of the Masters "Quality Management of Plant Production", for having provided the theoretical part of this internship.
I want to especially thank and to show my appreciation to the following people for the experience, rewarding and full of interest that they provided me during those six months in the Plant Pathology Research Unit of INRA PACA:
Madam MORRIS Cindy, director of the unit, for allowing me to conduct this internship. Mr. NICOT Philippe, Mr. POESSEL Jean-Luc and Madam QUILOT Bénédicte, my supervisors, for helping me to quickly integrate within the team and giving me their confidence, for the time they spent with me throughout my internship and for knowing answers to all my questions.
Magali Duffaud and all coworkers of the team, for their professional and personal supports.
A
bstract
Previous studies have shown that certain phenolic compounds have inhibitory effects in vitro and/or in vivo against Monilinia sp. Caffeic, p-coumaric, ferulic, 3, 5-dicaffeoyliquinic, chlorogenic and neochlorogenic acids, catechin and epicatechin are phenolic compounds known to be present in the epidermis of peach fruit (Prunus persica). The objectives of my internship work were to evaluate their effect on conidial germination and pathogenicity of Monilinia laxa on petals of different Prunus sp genotypes. The petals of the six almond genotypes tested and peach „8858‟ were relatively resistant to M. laxa. At a concentration of 2 mM, all compounds showed significant inhibitory effect on petals of almond „ZH81‟. Ferulic acid inhibited almost entirely lesion growth on petals of all Prunus genotypes, as well as conidial germination and mycelial growth on artificial media. At lower doses down to 0.5 mM it significantly inhibited M. laxa in vivo. Caffeic and p-coumaric acids had significant inhibitory effects on lesion growth as well as on conidial germination and mycelial growth in vitro. Other compounds showed variable inhibitory effects on lesion growth but no significant effect on conidial germination. It is hypothesized that those compounds have different modes of action for their inhibitory effect, in relation with their chemical structure, which are differently affected by host genotype, infection state.
Keywords: Secondary metabolites, phenol contents, inhibition, susceptibility
Résumé
Des études antérieures ont montré que certains composés phénoliques ont des effets inhibiteurs in vitro et/ou in vivo contre Monilinia sp. Les acides caféique, p-coumarique, férulique, 3, 5-dicaféoylquinique, chlorogénique et neo-chlorogenique, la catéchine et l'épi-catéchine sont des composés phénoliques présents dans l'épiderme des pêches (Prunus persica). Les objectifs de mon travail de stage étaient d’évaluer leur effet sur la germination des conidies et la pathogénicité de Monilinia laxa sur pétales. Les six génotypes d’amandier testés et le génotype "8858" de pêcher étaient relativement résistants à M. laxa. À une concentration de 2 mM, tous les composés ont montré un effet inhibiteur significatif du développement de M. laxa sur les pétales d'amandier "ZH81". L'acide férulique à 2 mM a inhibé presque entièrement le développement des lésions sur les pétales de tous les génotypes de Prunus spp. ainsi que la germination des conidies et la croissance du mycélium sur des milieux artificiels. À des doses plus basses jusqu'à 0,5 mM, il a significativement inhibé M. laxa in vivo. Les acides caféique et p-coumarique avaient un effet inhibiteur sur la croissance des lésions sur pétales, ainsi que sur la germination des conidies et la croissance du mycélium in vitro. Autres composés ont montré des effets inhibiteurs variables sur la croissance des lésions, mais aucun effet significatif sur la germination des conidies. L’hypothèse proposée est que les 8 composés phénoliques étudiés ont différents modes d'action pour leur effet inhibiteur, en relation avec leur structure chimique, qui sont affectés différemment par le génotype de l'hôte, et l’état de l'infection.
Table of contents
Introduction ... 1
Peach: a traditional and important culture. ... 1
Monilinia: a key fungal pathogen in the peach production system ... 2
Resistance to Monilinia in stone fruits ... 3
Implication of phenolic compounds in peach resistance to Monilinia ... 4
Objectives of the internship project ... 5
Materials and Methods ... 6
Fungal strain and inoculum production ... 6
Preparing stock solutions of phenolic compounds ... 7
Effect of the phenolic compounds on the development of M. laxa lesion on flower petals of Prunus ... 7
Effect of phenolic compounds on the germination in vitro of M. laxa conidia ... 9
Effect of compounds on M. laxa mycelial growth in vitro ... 10
Results and Discussion ... 12
Protective effect of phenolic compounds on petals of Prunus sp... 12
Effect of phenolic compounds on the germination in vitro M. laxa conidia ... 14
Effect of phenolic compounds on mycelial growth in vitro ... 15
Conclusions and Future Prospects ... 17
Fruit size
Phase I. Cell division and seed development
Full bloom Fruit
maturity Phase II. Pit
hardening
Phase III. Final swell
C
A
B
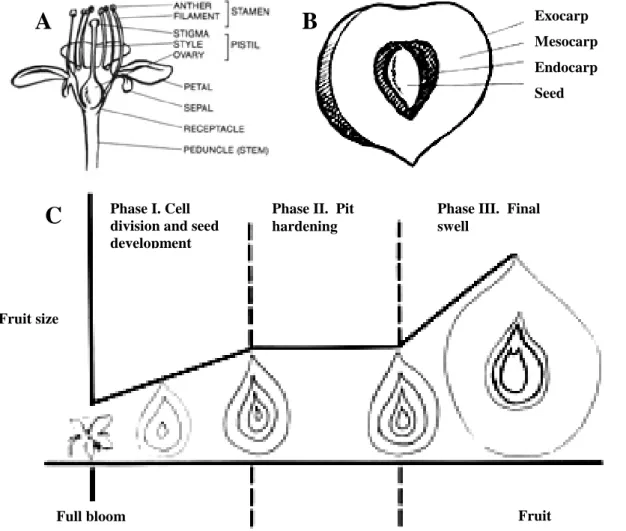
Fig. 1. Physiology of peach. (Adaskaveg et al., 2008) (A) Diagram of a peach flower.
(B) Cross section of a peach fruit. (C) Stages of peach fruit and seed growth.
Exocarp Mesocarp Endocarp Seed
Introduction
The laboratories of INRA Avignon research center where I completed my Master's internship specialize in improving fruits and vegetables (including increasing their resistance to pathogens) and in devising protection methods against diseases of crops. This internship was supervised in collaboration between the Plant Pathology Research Unit UR407 [UR Patho] and the Genetics and Improvement of Fruits and Vegetables Research Unit UR1052 [UR GAFL]. The specific research work of my internship was part of a workpackage in the ongoing European project "FruitBreedomics" (2011-2015) whose general objective is to improve the efficiency of apple and peach breeding programmes by multidisciplinary approach, including genetics, genomics, ecophysiology and bioinformatics (http://www.fruitbreedomics.com/).
Peach: a traditional and important culture.
The peach (Fig. 1), Prunus persica L. Batsch, is classified with the almond (P. dulcis D. A. Webb) in the subgenus Amygdalus, distinguished from the other subgenera by the presence of a deeply-rough stone. It belongs to the family Rosaceae of the order Rosales. The fruit has yellow or whitish flesh, a delicate aroma, and a skin that is either velvety (peaches) or smooth (nectarines) in different cultivars. Today, 3000 identified varieties of P. persica show wide morphological diversity: purple leaves; double flowers; flat, round, or elongated fruits; smooth or pile skin; red, white or yellow flesh... (Bassi and Monet, 2008).
The center of origin of the peach is considered to be in the North of China and the domestication of this species is estimated to have lasted since 5000 years ago, along with that of apricot. In Northern Europe, the peach was considered a rare and valuable fruit as the climate does not allow its culture. It is mainly grown today in the southern half of France, especially in the Provence-Alpes-Côte d'Azur region.
In 2009, the world production of peaches and nectarines reached 18.6 million tons, representing 3.34% of the total world production of fruit. The first producing country is China with 45.9% of world production, followed by Italy, Spain and the United States (FAOSTAT, 2010). Increasing consumer demand for peach and nectarines requires continued improvements in yield and quality of their production.
Ascospores (sexual spores)
Asci (transversal cut of a spothecium)
Ascospores (sexual spores) Mummy and cankers
Mummies on the tree Healthy blossom Blighted blossom
Healthy fruit
Rotten fruit producing conidia in big quantities
WINTER
Monilia laxa
(Telemorph phase) Monilinia laxa (Anamorph phase) Sporodochia and conidia
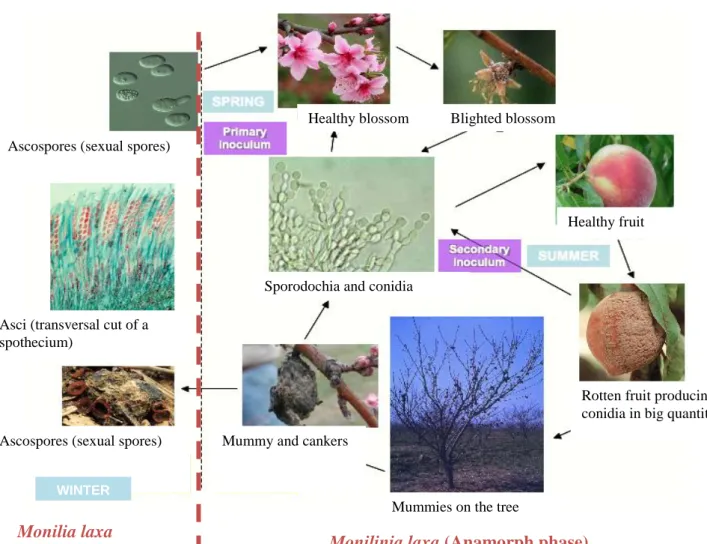
Fig. 3. Monilinia spp. Life cycle. (Cruz, 2010)
Fig. 2. Conidial germination of isolat ML3 of Monilinia laxa on flower petals of peach 7970 (1 day, 14 h light / 10 h dark at 21°C). Petals colored with 0.5% toluidine blue and observed under the microscope (Olympus BX60) after discoloration in sterile water. (A) Petal surface; (B) First cell layer of petal; (C) Second cell layer of petal. In total, five cell layers were observed on flower petals.
Monilinia: a key fungal pathogen in the peach production system
The disease: brown rot and blossom blight. Among the variety of pests and diseases affecting peach production worldwide, brown rot (BR) and Blossom blight (BB) caused by Monilinia sp. is considered as a key problem as it affects the health of the plant and has a direct impact on yield and fruit quality (Adaskaveg et al., 2008). This disease causes economically important losses if favorable climatic conditions occur during the blossoming or pre-harvest and harvest periods (Willetts and Bullock, 1993).
BB is the first symptom in spring, which appears first on sepals, anthers and stigmata as the blossoms open. Blight symptoms are expressed when the fungus girdles the peduncle. Among the stone fruits, apricot is the most susceptible to blossom blight (BB), followed in order by prune, sweet cherry, peach, sour cherry and plum (Holb, 2008). For a given fruit species, losses also vary with the susceptibility of the cultivars.
According to VIENNOT-Bourgin (1949), the manifestation of the disease on the fruit (BR) is the largest and most damaging. The attack occurs after a superficial lesion. The fungus spreads rapidly in the wound surface and at depth. The flesh appears bruised and turns brown, finally becomes soft place by maintaining a fibrous texture. The skin comes off easily and is covered with tawny gray pads.
The pathogens: Monilinia sp.. Several species of Monilinia have been reported to cause BR of stone fruits world wide. In France, three species are currently described: M. laxa (Aderhold & Ruhl.) Honey (also Sclerotinia laxa Aderh. & Ruhl.), M. fructigena (Aderhold & Ruhl.) Honey and M. fructicola (G. Wint) Honey (Mercier et al., 2009). The latter species is considered as a quarantine organism (Lane, 2002). In many regions, including France, M. laxa is considered as the most common and serious species attacking both blossoms (BB; Fig. 2 and 3) and fruits (BR) (Fig. 3). A special form of M. laxa f.sp. mali can also infect blossoms of pome fruits (Byrde and Willetts, 1977).
This species of the genus Monilinia (order Helotiales, class Leotiomycetes, phylum Ascomycota) can be distinguished from other species based on morphological traits (Batra, 1979). Several other diagnostic features have also been used; the part of the host plant infected, the color of pustules and the time of appearance of the first pustules give preliminary information to determine the species (van Leeuwen and van Kesteren, 1998). In the last decade, several conventional multiplex polymerase chain reaction (PCR) assays were introduced from all three for differentiation of Monilinia species (Côté et al., 2004;
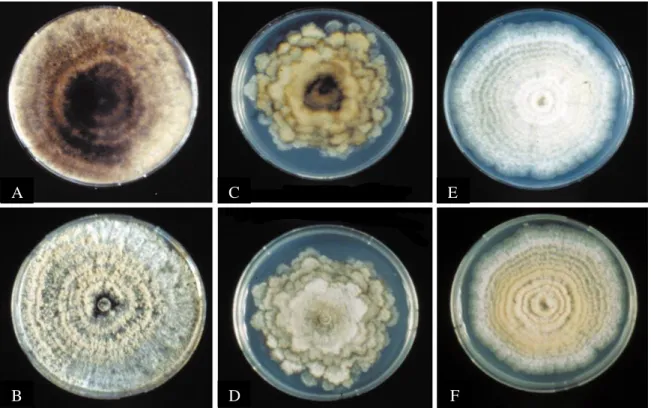
Fig. 4. Morphology of Monilinia spp. colonies grown on 4% PDA (10 days, 12 h light / 12 h dark at 22°C) (Lane, 2002).
Monilinia fructicola isolate 1: (A) upper surface; (B) lower surface; M. laxa isolate 8: (C) upper surface; (D) lower surface;
M. fructigena isolate 18: (E) upper surface; (F) lower surface. A B C D E F
Gell et al., 2007; van Brouwershaven et al., 2010). According to Côté et al (2004), the multiplex PCR consistently produced a 402-bp PCR product for M. fructigena, a 535-bp product for M. fructicola, and a 351-bp product for M.laxa based on a common reverse primer (MO368-5) and three species-specific forward primers (MO368-8R, MO368-10R, and Laxa-R2).
The conidia of M. laxa are oval in shape, 12-18 µm long and 9-10 µm wide. Both extremities are more or less stretched. Colonies of M. laxa have lower growth rates than other species of Monilinia on potato dextrose agar (PDA) grown at 22 °C under 12 h of light per day (Lane, 2002; Fig. 4).
Disease prevention and control. In France, several chemical substances are registered to control Monilinia diseases, including cyproconozole, difenoconazole and myclobutanil for orchard application, then fludioxonil and fenhexamid for postharvest application (http://e-phy.agriculture.gouv.fr/). Chemical control may be difficult; however, as fungicide resistance has developed repeatedly in the past among Monilinia populations (Guizzardi et al., 1995; Sanoamuang and Gaunt, 1995; Ma et al., 2003). Several studies have shown that hot water treatments by themselves or in combination with other treatments can substantially control postharvest diseases of peaches and nectarines (Margosan et al., 1997; Karabulut et al., 2002). However, control programs are often inefficient and significant levels of brown rot may occur during storage, transport and marketing. In view of the possible genetic resistance to brown rot, the use of resistant or tolerant cultivars is known to be one of the best means of disease control.
Resistance to Monilinia in stone fruits
Some genotypes are known to have a high level of resistance to Monilinia sp. (Feliciano, et al., 1987; Adaskaveg et al., 1989). Morphological and biochemical factors have been shown to account for differences between peach genotypes susceptible and resistant to M. fructicola (Feliciano et al., 1987). Based on the research of Bostock et al. (1998), peach genotypes with a high level of resistance have fewer trichomes and a thicker cuticle with a higher phenolic content than other fruits of similar maturity from less resistant genotypes. Even for susceptible cultivars, young fruits are usually quite resistant to colonization by the pathogen (Gell et al., 2008) and they gradually become susceptible with increasing maturity. Such changes in susceptibility have been related to significant changes in volatiles, organic acids, phenolic compounds and cell wall composition in the
4 fruit (Biggs and Northover, 1988; Ibbotson-Darhower et al., 1998; Luo and Michailides, 2001; Villarino et al., 2011).
Implication of phenolic compounds in peach resistance to Monilinia
Several phenolic compounds have been shown to decline in concentration in the exocarp of peach fruit during its maturation, concomitantly with an increase in susceptibility. They include: catechin (CC), epicatechin (ECC), caffeic acid (CA) and chlorogenic acid (CGA) (Lee and Bostock, 2006). In addition, several investigators have pointed out fungitoxic properties of a few fruit phenolic compounds in vivo and in vitro, and their particularly high contents in peach genotypes with a high level of resistance (Gradziel et al. 1997; Lee and Bostock, 2007). However, the specific role of phenols in plant resistance to pathogenic fungi is not totally clear, due to the numerous external and internal variables in such host-pathogen interactions (Manibhusaurao et al., 1988).
In higher plants, the synthesis of phenolic compounds, such as CA, p-coumaric acid (PCA), ferulic acid (FA) and CGA, appear to be regulated by enzymes in response to infections by pathogens (Kosuge, 1969). Gradziel and Wang (1993) have showed that an important antifungal role of the high phenolic activity on M. fructicola resistance is causally correlated with high enzymatic browning. Otherwise, Bostock‟s group (1999) manifested that CA and CGA in peaches can suppress cutinase activity in M. fructicola which are crucial for its growth and colonization on a host. In the studies of De Cal and Melgarejo, a role for melanin-like pigments in the pathogenicity of M. laxa, such as that of melanised appressoria, has been described (De Cal and Melgarejo, 1993; De Cal and Melgarejo, 1994).
Objectives of the internship project
Based on this background, the objectives of my internship work were to characterize the inhibitory effect of individual phenolic compounds (i) on lesion development caused by M. laxa on flower petals of Prunus sp. (in vivo), and (ii) on M. laxa conidia germination and mycelial growth on the artificial media (in vitro). The eight phenolic compounds to be studied, CA, PCA, FA, 3, 5-dicaffeoyliquinic acid (DCQA), CGA, neochlorogenic acid (NCGA), CC and ECC, were known to be present in the exocarp of peach (Tomas-Barbera et al., 2001; Lee and Bostock, 2006; Maria et al., 2011). The "down-the-road" objectives of the general study are to evaluate their possible role in the resistance of specific peach cultivars to brown rot.
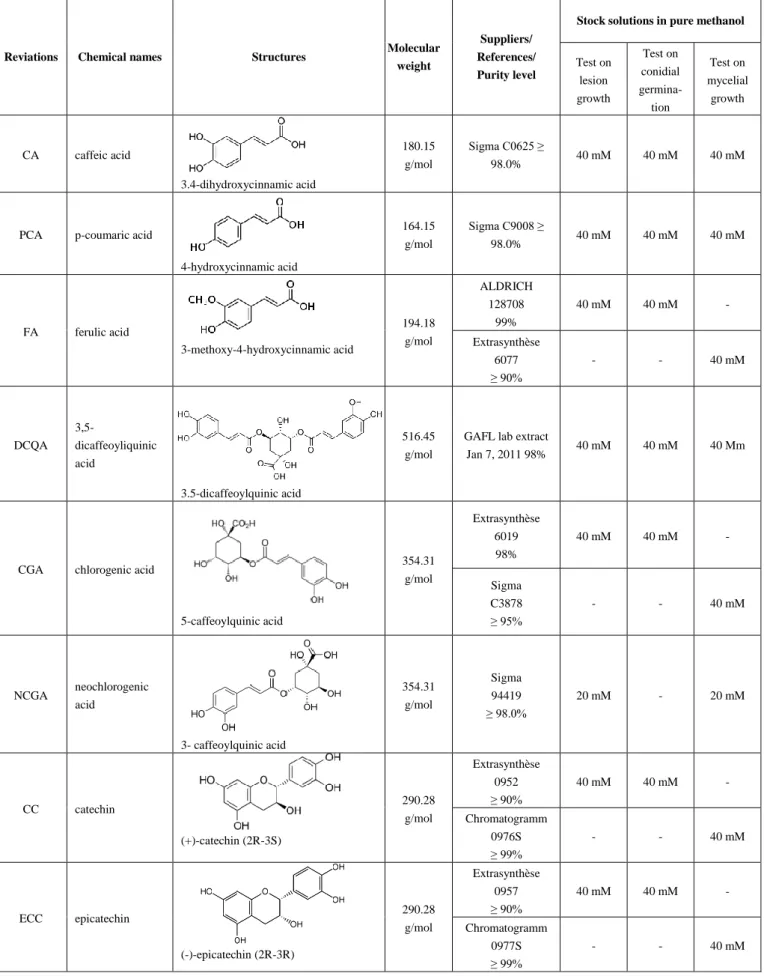
Table 1. Phenolic compounds under study and stock solution concentrations.
Reviations Chemical names Structures Molecular weight
Suppliers/ References/ Purity level
Stock solutions in pure methanol
Test on lesion growth Test on conidial germina-tion Test on mycelial growth CA caffeic acid 3.4-dihydroxycinnamic acid 180.15 g/mol Sigma C0625 ≥ 98.0% 40 mM 40 mM 40 mM
PCA p-coumaric acid
4-hydroxycinnamic acid 164.15 g/mol Sigma C9008 ≥ 98.0% 40 mM 40 mM 40 mM FA ferulic acid 3-methoxy-4-hydroxycinnamic acid 194.18 g/mol ALDRICH 128708 99% 40 mM 40 mM - Extrasynthèse 6077 ≥ 90% - - 40 mM DCQA 3,5-dicaffeoyliquinic acid 3.5-dicaffeoylquinic acid 516.45 g/mol
GAFL lab extract
Jan 7, 2011 98% 40 mM 40 mM 40 Mm
CGA chlorogenic acid
5-caffeoylquinic acid 354.31 g/mol Extrasynthèse 6019 98% 40 mM 40 mM - Sigma C3878 ≥ 95% - - 40 mM NCGA neochlorogenic acid 3- caffeoylquinic acid 354.31 g/mol Sigma 94419 ≥ 98.0% 20 mM - 20 mM CC catechin (+)-catechin (2R-3S) 290.28 g/mol Extrasynthèse 0952 ≥ 90% 40 mM 40 mM - Chromatogramm 0976S ≥ 99% - - 40 mM ECC epicatechin (-)-epicatechin (2R-3R) 290.28 g/mol Extrasynthèse 0957 ≥ 90% 40 mM 40 mM - Chromatogramm 0977S ≥ 99% - - 40 mM
Materials and Methods
Fungal strain and inoculum productionStrain ML3 of Monilinia laxa. Single-spore isolate ML3 of M. laxa was used throughout this study. This strain was isolated in March 2011 from a mummified apricot fruit at the Gotheron experimental station of INRA. To limit the need for regular transfers of the fungus to fresh medium (and thus the risk of phenotypic drift), the strain was stored in Eppendorf tubes at -20°C as aliquots of a concentrated spore suspension in monopotassic phosphate buffer with 20% glycerol.
Production of conidia. To obtain conidia, the fungus was grown on V8 juice agar containing per liter 200 mL of V8 juice (Campbell), 20 g of agar (BactoTM, ref: 214010), 2 g of yeast extract (BactoTM, ref: 288620), 2 g of glucose (LABOSI, ref: 288620), 1 g of calcium carbonate (LABOSI, ref: A4759201) and 800 mL of sterile water. The pH was adjusted to 5.2 with NaOH or HCl and the medium was autoclaved for 30 minutes at 115 °C. It was then poured into 55 mm diameter Petri plates (7 mL per plate).
To produce inoculum, 6 µL drops of the stock suspension kept in the freezer were applied to Petri plates of V8 agar. The plates were then incubated in a growth chamber in 14 h of light per day (114 μmole m-2s-1). The incubation temperature, 21 ± 2°C, was according to Tamm and Flückiger (1993).
Conidia from 10 to 14-day-old cultures were collected in sterile water. The concentration of the suspensions was determined with the help of a Malassez hemacytometer and adjusted as desired with sterile water. For in vitro germination tests, an additional step was carried out prior to quantifying spores: the suspensions were filtered through 30 µm mesh sterile filters to remove possible mycelial fragments and ensure later a favorable counting view under the microscope.
Production of mycelium. Mycelial inoculum was produced on modified GG medium (Glucose Gélosé) to foster mycelium production and limit sporulation of ML3. This "GG+" medium contained per liter: 15 g agar (BactoTM, ref: 214010), 2 g yeast extract (BactoTM, ref: 288620) and 1 g glucose (LABOSI, ref: 288620). The medium was autoclaved for 20 min at 120 °C, and then poured into 55 mm diameter Petri plates (7 mL per plate). The plates were inoculated with 6 µL drops of the stock suspension of ML3 and incubated in a growth chamber as described above.
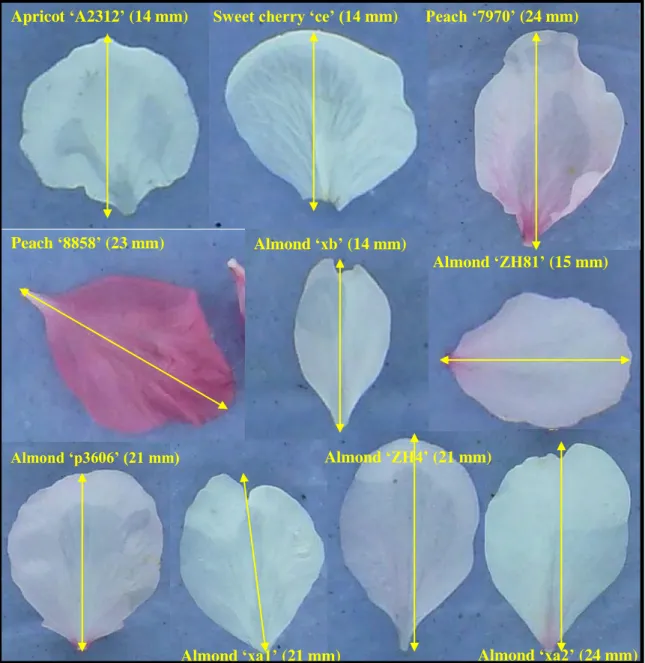
Fig. 5. Diversity of petal morphology among Prunus sp genotypes tested. Petal size is indicated by the length of yellow lines (Values in mm in parentheses). Apricot ‘A2312’ (14 mm) Sweet cherry ‘ce’ (14 mm) Peach ‘7970’ (24 mm)
Peach ‘8858’ (23 mm) Almond ‘xb’ (14 mm) Almond ‘ZH81’ (15 mm) Almond ‘p3606’ (21 mm) Almond ‘xa1’ (21 mm) Almond ‘ZH4’ (21 mm) Almond ‘xa2’ (24 mm)
Preparing stock solutions of phenolic compounds
The 8 phenolic compounds used in this study were purchased from different suppliers (Table 1). These compounds were first prepared as 40 mM stock solutions dissolved in pure methanol. Due to its particularly low solubility, NCGA was prepared as a 20 mM stock solution. On the day of an experiment, the stock solutions were prepared at room temperature, using a very precise Mettler AE160 balance (0.0001 g). For most tests, the solutions were used immediately. The stock solutions remaining after each test were stored at – 20°C in the dark and were exceptionally used for certain additional tests.
Effect of the phenolic compounds on the development of M. laxa lesion on flower petals of Prunus
Plant material. Flower petals of Prunus sp. including apricot (P. armeniaca), almond (P. amygdalus), sweet cherry (P. avium) and peach were tested successively in this study (Fig. 5). Flowering branches were collected from UR GAFL field sites in Avignon, France, brought to the laboratory and kept at 4°C until use. To obtain a maximum of open flowers, branches were placed at room temperature one day before a test. On the day of a test, random samples of healthy petals were gently picked by hand and placed on a wet absorbing paper in transparent polystyrene boxes. The color of the absorbing paper was blue to facilitate disease assessment with image analysis software as described below.
Inoculations. Each petal was inoculated in its center with a 2 µL drop of conidial suspension containing the desired concentration of the compound to be tested (Table 1). To prepare these suspensions, identical volumes of a double-concentrated conidial suspension and a double-strength compound solution were prepared separately and mixed immediately before the inoculation. The polystyrene boxes containing the inoculated petals were closed with lids to keep high moisture inside and they were incubated in the growth chamber as described above.
As traces of ethanol (used as solvent in the stock solutions of phenolic compounds) were present in all mixes containing phenolic compounds, the possible effect of ethanol on disease development was assessed in a preliminary test. Petals of almond ZH4 were inoculated with spore suspensions containing final ethanol concentrations of 0%, 10%, 20%, 30%, 40% and 50% (V/V) prepared from absolute ethanol.
In all the subsequent tests, two types of controls without phenolic compound were included: petals inoculated with spores in water and with spores in ethanol. For a given
Date of the tests
Phenolic
compounds Prunus species / cultivars
Modalities
(inoculations x concentrations) Replicates per modality (petals x box) Inoculum concentra-tions (spores/µL) Compound (+ ethanol) concentrations
Mar. 07 CGA Almond ZH4; Apricot ce; 250, 125, 50, 25;
5 mM, 10% ethanol, 0.5 mM, 1% ethanol, 0.05 mM, 0.1% ethanol
5 x 2 Mar. 19 CA, PCA, CGA,
CC;
Peach 7970; Almond
p3606, xa1; 250, 50; 2 mM, 5% ethanol; 5 x 2 Mar.20 DCQA, CC, ECC; Almond p3606, xa2, xb; 250, 50; 2 mM, 5% ethanol; 5 x 2 Mar.21 PCA, FA, DCQA,
NCGA; Almond p3606, xa2; 250, 50
2 mM, 5% ethanol (10%
ethanol for NCGA); 5 x 2 Mar.26 CGA, DCQA; Almond ZH81; 250, 50
2 mM, 5% ethanol, 1 mM, 2,5% ethanol, 0.5 mM, 1.25% ethanol;
10 x 2
Mar. 27 CA, PCA, FA; Almond ZH81; 250, 50;
2 mM, 5% ethanol, 1 mM, 2,5% ethanol, 0.5 mM, 1.25% ethanol;
10 x 2
Mar. 28 CA, PCA, FA,
NCGA, CC, ECC; Almond ZH81; 250, 50;
2 mM, 5% ethanol 1 mM, 2,5% ethanol, 0.5 mM, 1.25% ethanol; (double ethanol for NCGA)
10 x 2
Mar. 29 DCQA, CGA,
NCGA, CC, ECC; Almond ZH81; 250, 50;
2 mM, 5% ethanol 1 mM, 2,5% ethanol, 0.5 mM, 1.25% ethanol; (double ethanol for NCGA)
10 x 2
Apr. 02 CA, DCQA,
CGA, NCGA; Peach 8858; 250, 50;
2 mM, 5% ethanol 1 mM, 2,5% ethanol, 0.5 mM, 1.25% ethanol; (double ethanol for NCGA)
10 x 2
Apr. 03 CA, DCQA,
CGA, NCGA; Sweet cherry ce; 250, 50;
2 mM, 5% ethanol 1 mM, 2,5% ethanol, 0.5 mM, 1.25% ethanol; (double ethanol for NCGA)
10 x 2
Apr. 04 CA, PCA, FA, CC, ECC;
Peach 8858; Sweet cherry
ce; 250, 50;
2 mM, 5% ethanol 1 mM, 2,5% ethanol, 0.5 mM, 1.25% ethanol;
10 x 2
Table 2. Dates and conditions of tests with phenolic compounds on petals of
Prunus against Monilinia laxa.
Abbreviations: CA: caffeic acid; PCA: p-coumaric acid; FA: ferulic acid; DCQA: 3, 5-dicaffeoyliquinic acid; CGA: chlorogenic acid; NCGA: neochlorogenic acid; CC: catechin; ECC: epicatechin.
experiment, the ethanol concentration in the control was identical to the highest possible ethanol concentration present in the phenolic compound modalities (Table 2).
In addition, a third type of control was systematically included. For each experiment, two boxes containing non-inoculated petals were prepared to assess their physiological condition and detect the possible presence of latent infections by natural pathogens.
Disease assessment. Lesions caused by M. laxa on the petals were photographed on the first and second day post inoculation (dpi) with a digital camera and the lesion size (mm²) was assessed using image analysis software Assess 2.0 (APS Press, St Paul, MN, USA).
To determine the relationship between lesion development and M. laxa germination, observations on the surface of petals were performed independently with epifluorescence and light microscopy 24 h after inoculation. The inoculated or non-inoculated petals were colored by 0.05% toluidine blue for 10 min and were observed under the microscope (Olympus BX60) after discoloration in sterile water; or colored by 0.1% calcofluor for 5 min and instantly observed under the microscope by using ultra violet (UV).
Experimental design and data analysis. All tests were conducted with at least 10 replicate petals for each modality (5 petals in each of two polystyrene boxes). However, higher numbers of petals were often used depending on the availability of flowers and the number of modalities to be tested in a given experiment (Table 2). Each phenolic compound was tested independently on at least 4 species of Prunus with at least 3 concentration of application.
Lesion surfaces were analyzed using analysis of variance, Newman-Keuls and critical ranges tests of statistical software STATISTICA. The F test was considered significant at p = 0.05. To show the protective effect of phenolic compounds, protection indices (PI) were computed as
PI = 100 * (Scontrol – Stested) / Scontrol,
where Scontrol was the average of lesion sizes on control petals (mm²) and Stested was the
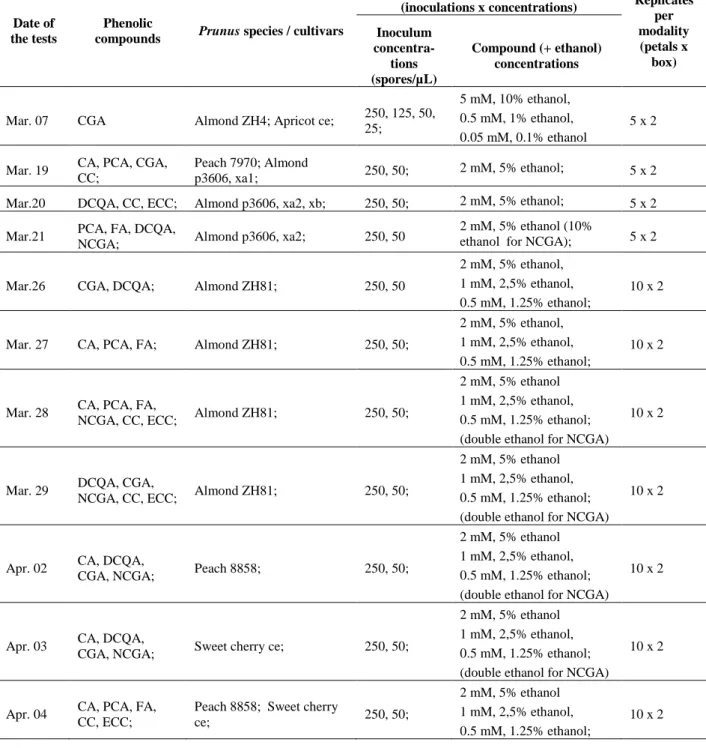
GG medium (2300 µL, 60°C) Ethanol or compound solution (2300 µL, 60°C) Mixed solution (4 mL) was poured into Petri plate A B Fig. 6. Experimental design of in vitro tests of Monilinia laxa
conidial germination.
(A) Explants of 5 mm diameter were collected from each medium with a sterile cork borer and placed in separate wells in a 24-well tissue culture test plate;
(B) A 2 µL drop of a conidial suspension adjusted to 250 conidia / µL as described in “Production of conidia” was deposited gently on the surface of the explants in each test plate.
Conidial suspension
Control Compound 1
Compound 3 Compound 2
Effect of phenolic compounds on the germination in vitro of M. laxa conidia
Media preparation. All germination tests were carried out on a GG medium containing per liter: 5 g of agar (BactoTM, ref: 214010), 0.5 g of glucose (LABOSI, ref: 288620) and appropriate concentrations of the 8 phenolic compounds tested. For all compounds except NCGA, the final concentration in the medium was 2 mM (1 mM for NCGA). This was prepared by mixing 2300 µL of double-strength GG medium with an identical volume of a 10% dilution (in sterile water) of a compound's stock solution. The media thus contained also 5% ethanol. To avoid solidification of the agar medium, both components and the final media were maintained at 60°C in a water bath. A volume of 4 mL of each medium was then poured into a 55 mm diameter Petri plate and cooled to room temperature in sterile conditions. For FA, additional concentrations were tested, obtained by mixing identical volumes of double strength GG medium with 5%, 2.5% or 0.5% dilutions of the stock solution. The resulting concentrations were thus 1, 0.5 and 0.1 mM. The concentration of ethanol was adjusted so that all final media contained 5% ethanol.
Preparation of replicates and inoculations. Each germination test was carried out on 6 replicates per phenolic compound and per concentration. To this end, 5 mm diameter explants were collected from each medium with a sterile cork borer and placed in separate wells in a 24-well tissue culture test plate (Fig. 6 – A). A 2 µL drop of a conidial suspension adjusted to 250 conidia / µL as described in “Production of conidia” was deposited gently on the surface of the explants in each test plate (Fig. 6 – B). The test plates were covered to keep high humidity and protect against contamination. These inoculated test plates were then incubated for 16 hours in a growth chamber at 21 ± 2°C (10 h night then 6 h day).
Quantification of germination. The plates were examined under the microscope and at least 100 conidia were observed per well. A conidium was considered as germinated if the size of the germination tube was at least equal to the length of the conidium. To avoid bias related to the time needed to examine the conidia, the wells were randomly selected for reading on the plates. A germination rate (GR) was computed for each well as the number of germinated conidia per 100.
Experimental design and data analysis. Each test plate contained four sets of 6 replicates, one set with explants of 5% ethanol control medium, and three with different compounds or concentrations (Fig. 6 – A). Each test was repeated independently at least
10 four times. Analyses of variance were carried out on GR values and Newman-Keuls and
critical ranges test were performed when appropriate, using STATISTICA. An index of inhibition (II) was computed as
II = 100 * (Rcontrol – Rtested) / Rcontrol,
where Rcontrol and Rtested were the average germination rates on the control medium and on
the medium containing the phenolic compound under study, respectively.
Effect of compounds on M. laxa mycelial growth in vitro
Media preparation. This study was carried out only with 3 phenolic compounds, CA, PCA and FA. The final concentrations of each compound in the media were 0.1, 0.5, 1 and 2 mM with 1% ethanol. Controls (without phenolic compound) containing either 1% ethanol or only sterile water were also included. The base medium was GG + described above (section "Production of mycelim") and the media with the appropriate compound concentrations were prepared as described above. A volume of 2 mL of each medium was then poured into a 45 mm diameter glass Petri plate and cooled to room temperature in sterile conditions.
Before assessing the effect of the compound on mycelial growth, the effect of ethanol concentrations on the mycelial growth of M. laxa was studied. The final ethanol concentrations in the medium were 0.25%, 1.25%, 2.5%, 5% and 10% (V/V).
Inoculations. After 11 days of incubation as described in the section "Production of mycelim", 2 mm diameter mycelial plugs were excised with a sterile cork borer from the growing margin of the colony. Each plug was placed carefully in the centre of a Petri plate and then the plates were covered and sealed with plastic film „Cello frais‟, and then incubated in the growth chamber.
Quantification of mycelial growth. The size of the developing colonies was measured twice (2 dpi and 4 dpi for ethanol tests; 3 dpi and 6 dpi for compound tests) with a ruler. On each date, two diameters were measured (perpendicularly to each other) per plate and the values were averaged.
Experimental design and data analysis. Three replicate plates were used for each concentration of each tested compound and for each of the two controls. Colony sizes were compared by analysis of variance, followed when appropriate by Newman-Keuls and critical ranges tests with STATISTICA.
Fig. 8. Variability in susceptibility of petals to Monilinia laxa. among genotypes of Prunus sp. The petals were inoculated with 2µL drops containing 50 conidia / µL. Data represent the means and standard deviations of at least 10 replicate petals. Column values labeled with the same letter were not significantly different (α = 0.05) according to the test of Newman and Keuls.
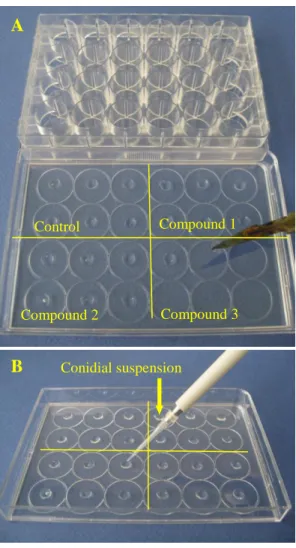
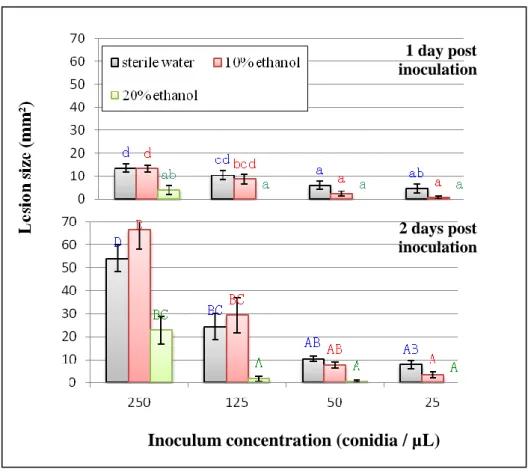
Fig. 7. Effect of ethanol and inoculum concentration on the development of lesions on almond petals by Monilinia laxa. Petals were inoculated with 2 µL drops containing different combinations of conidial concentrations and ethanol (20%, 10% and 0% V/V) in sterile water. Data represent the means and standard deviations of 10 replicate petals. For a given graph, column values labeled with the same letter were not significantly different (α = 0.05) according to the test of Newman and Keuls.
Inoculum concentration (conidia / µL)
1 day post inoculation
2 days post inoculation
Results and Discussion
Protective effect of phenolic compounds on petals of Prunus sp.Effect of ethanol on disease development. The preliminary test with ethanol showed that certain concentrations of this chemical (used as a solvent for all phenolic compounds under study in this work) had a significant effect on the development of Monilinia lesions on petals of almond ZH4. Concentrations of 30%, 40% and 50% (V/V) totally prevented lesion development by M. laxa. At a concentration of 20%, ethanol almost completely inhibited disease development on petals inoculated with low conidial loads of the pathogen and significantly (P < 0.05) reduced lesion size at high inoculum concentrations (Fig. 7). In contrast, 10% ethanol never caused significant inhibition of disease. Based on the solubility of the phenolic compounds and the impact of ethanol, the maximum ethanol concentration in the final phenolic compound solution was fixed at 10% for the rest of the study.
Effect of inoculum concentration on disease development. The concentration of M. laxa inoculum applied to the petals significantly affected lesion size (Fig. 7). With the lower conidial concentrations, disease severity was very low. So as to obtain visible symptoms on the petals and also to economize plant material, only inoculum concentrations of 250 conidia / µL and 50 conidia / µL were used in the rest of the study.
Diversity in the susceptibility of petals to M. laxa among Prunus cultivars. Among the 10 genotypes of Prunus sp. compared in this study, a wide range of susceptibility was observed (Fig. 8). At 2 dip, lesion size of peach „7970‟ and sweet cherry „ce‟ were significantly (P < 0.05) larger, while peach „8858‟ was significantly (P < 0.05) smaller (Fig. 8). The susceptibility of the six almond genotypes was intermediate and showed little variability. For a given genotype, petals from branches kept longer in cold storage for replicate tests appeared more sensitive (detailed data not shown), suggesting an evolution of susceptibility with the physiological state of the flowers. This further suggests that tests with flowers should (1) be carried out with large numbers of independent repetitions and (2) that care should be taken to document well the physiological state / storage conditions of the flowers used in such tests in the laboratory.
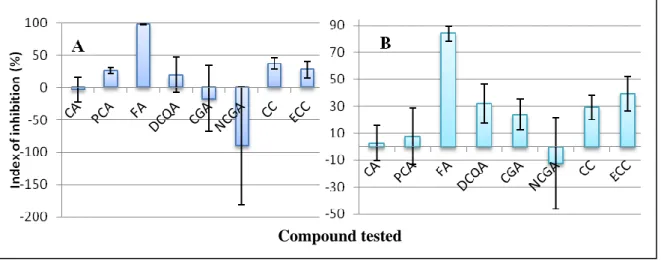
Effect of phenolic compounds on disease developement. In the course of this work, each of the 8 compounds could be evaluated at a concentration of 2 mM in 7 to 15 replicate
Compound tested
Fig. 9. Inhibitive effect of phenolic compounds (2 mM with 5% ethanol) on the development of lesions on Prunus petals by Monilinia laxa: (A) 250 conidia / µL on 1 day post inoculation; (B) 50 conidia / µL on 2 day post inoculation. Data represent the means and standard deviations for at least 7 replicate experiments.
Abbreviation: CA: caffeic acid; PCA: p-coumaric acid; FA: ferulic acid; DCQA: 3, 5-dicaffeoyliquinic acid; CGA: chlorogenic acid; NCGA: neochlorogenic acid; CC: catechin; ECC: epicatechin.
A B
C D
Fig. 10. Photos of microscopy on the almond ‘ZH81’petals inoculated with Monilinia laxa. The petals were inoculated with 2µL solution mixed with 250 conidia / µL of conidia suspension, and sterile water (A), 10% ethanol (B), 2 mM of ferulic acid (C) and catechin (D), respectively.
Disruption of the germination tubes and mycelia; without lesion on petal.
Disruption of the germination tubes and mycelia;
tests on petals of various Prunus cultivars inoculated with a spore suspension of M. laxa containing 50 conidia / µL and in 7 to 11 replicate tests for an inoculum containing 250 conidia/µL. Overall, a high level of variability was observed, with certain compounds inhibiting lesion development on certain cultivars and stimulating disease on others. Compared with the ethanol control, each compound significantly reduced lesion size (P < 0.05) on at least three genotypes when observed at 1 dip and two when observed at 2 dip. For the sake of concision, the detailed data are documented only in Annex 1 and the average inhibition index over all replicate tests is presented for each compound in Fig. 9.
At 1 dpi, FA had a consistently high inhibition index, with an average of 98% and a low standard error (Fig. 9 – A). For PCA, CC and ECC, the average indices were between 25 and 50% while those of CA, DCQA, CGA and NCGA were very low, with high standard errors due to negative values (stimulation of disease) for certain cultivars. At 2 dpi (Fig. 9 – B), the inhibition indices of FA, PCA and CC were somewhat reduced compared to 1 dpi, and those of CA, CGA, NCGA, DCQA and ECC were increased. The standard errors were all increased, showing an aggravation of the variability between 1 and 2 dpi.
Due to time constraints, it was not possible to complete the analyses of the data for tests with lower concentrations of the compounds (1, 0.5 and 0.1 mM during the time frame of the internship.
Study of microscopy. To understand the mode of lesion growth, inoculated petals showing lesions or remaining symptomless, and un-inoculated petals showing lesions were colored and observed at 1 dpi (Fig. 10). Conidial germination of M. laxa was detected (stained with toluidin blue) both on inoculated petals showing lesions and on those remaining symptomless. Treatments with certain compounds such as FA disrupted the morphology of the germination tubes and mycelia, probably resulting in the observed absence of symptoms (Fig. 10 – C). This finding suggests that M. laxa could infect flower petals without developing symptoms. A similar phenomenon had been reported on peach fruit (Lee and Bostock, 2006).
Observations made with calcofluor were not informative. The essential advantage of this dye is that its use does not require discoloration of the plant tissue, thus reducing the possibility of destroying the spores or mycelium on the surface of petals. It could be used in the study of germination rate. But it did not color the filaments once they penetrated
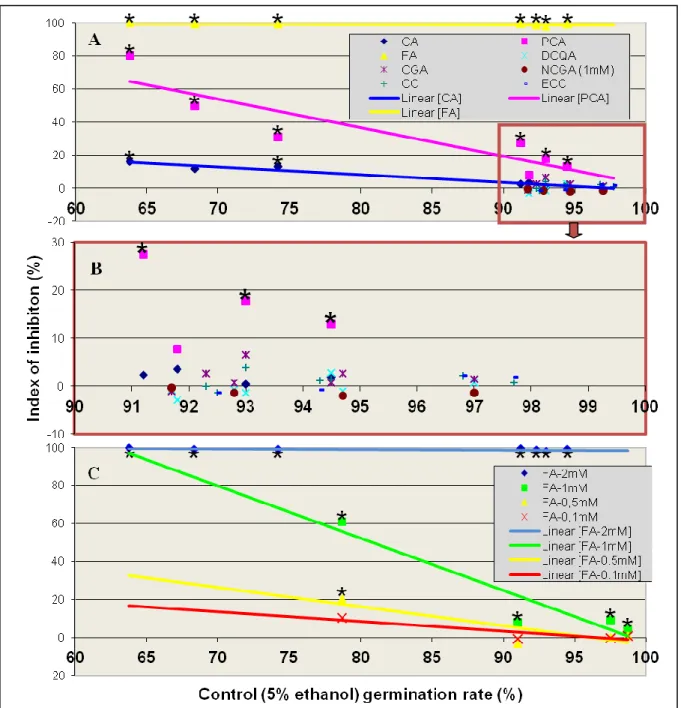
Fig. 11. Inhibitive effect of phenolic compounds on the conidial germination in vitro of Monilinia laxa. The artificial media were inoculated with 2 µL of a conidial suspension (250 conidia / µL) and incubated for 16 hours (10 h night then 6 h day) at 21 ± 2°C. Each point is the average of 6 replicates. For each compound or concentration of ferulic acid, column values labeled with „*‟ are significantly different (α = 0.05) with 5% ethanol control according to the test of Newman et Keuls.
Abbreviation: CA: caffeic acid; PCA: p-coumaric acid; FA: ferulic acid; DCQA: 3, 5-dicaffeoyliquinic acid; CGA: chlorogenic acid; NCGA: neochlorogenic acid; CC: catechin; ECC: epicatechin.
inside the plant tissue and it could be affected by ethanol and mostly phenolic compounds (Fig. 10 – B). Consequently, it did not turn out to be suitable for the study of compounds.
Effect of phenolic compounds on the germination in vitro M. laxa conidia
Tests with a high concentration of the phenolic compounds. Only three of the eight compounds (CA, PCA and FA) significantly (P < 0.05) reduced the germination of M. laxa conidia, when present at a concentration of 2 mM in the nutrient medium (1 mM for NCGA). In seven independent experiments with FA, this compound systematically provided near complete inhibition of germination. For PCA, significant inhibition was observed in six of seven independent tests, with a wide variability in the Inhibition Index (II from 7.8 to 80.2%). Among the seven independent tests with this compound, some level of variability was also observed in the germination rate on the control medium without phenolic compound (5% ethanol), prompting the investigation of a possible relationship between the inhibition efficacy of the compound and the rate of germination of the fungus on the control medium (Fig. 11). Regression analysis showed that the correlation was statistically significant (R² = 0.808; P = 0.0059), with a linear relationship:
IIPCA = 174.3 – 1.723 GRcontrol,
where IIPCA was the Inhibition Index for the germination of conidia on medium containing
PCA and GRcontrol was the germination rate of the conidia on the control medium.
For CA, significant inhibition was observed in only two of seven independent tests, with overall low values of the Inhibition Index (II from 0.4 to 16%). As for PCA, a significant linear relationship (R² = 0.948; P = 0.0002) was found between II and the rate of germination of the fungus on control medium:
IICA = 45.73 – 0.47 GRcontrol,
where IICA was the Inhibition Index for the germination of conidia on medium containing
CA and GRcontrol was the germination rate of the conidia on the control medium.
For the five other compounds under study (DCQA, CGA, CC, ECC and NCGA) germination was not significantly inhibited (II < 8%) regardless of the germination rate of conidia on the control medium (Fig. 11 – B). Future work could include testing these compounds at higher doses, although 2 mM is already considered as a high concentration in biological terms (Bostock et al., 1999; Lee and Bostock, 2006).
Fig. 12. Effect of ethanol on the mycelial growth of Monilinia laxa. Colony diameters were recorded at 2 and 4 days post inoculation (dpi). Data represent the means and standard deviations of 3 replicates. For a given day, column values labeled with the same letter are not significantly different (α = 0.05) according to the test of Newman et Keuls.
0.1 mM 0.5 mM 1 mM 2 mM
Concentration of compounds
Fig. 13. Effect of different concentrations of caffeic acid (CA), p-coumaric acid (PCA) and ferulic acid (FA) on the mycelial growth in vitro of Monilinia laxa. Control treatments included sterile water and 1% ethanol. Data represent the mean and standard deviation of 3 replicates per treatment at 3 (A) and 6 (B) days post inoculation (dpi).
The findings were complementary with results of in vivo tests at an equivalent concentration of compounds (2 mM). FA showed also nearly total inhibition on conidial germination. CA and PCA had significant effects in vivo, and the rest of the compounds none. This finding strengthens our hypothesis that the inhibitory effects of those compounds relates with host genotype.
Dose effect for ferulic acid. As 2 mM of FA provided near complete inhibition of the germination of M. laxa conidia, lower concentrations were also tested. Significant inhibition was observed (P < 0.05) in all four independent experiments with 1 mM of FA, but II was overall low (4.2~60.8%, with a mean of 20.5%) and it varied depending on the germination rate of the fungus on the control medium (Fig. 11 – C). At a concentration of 0.5 mM, significant inhibition was observed on only one of four replicate experiments (II = -3.5~20.6%; with a mean of 4.5%) and at 0.1 mM no significant inhibition was observed (II = -0.9~10.4, with a mean of 2.5%).
Differences of concentration effects increase with the rate of germination of the fungus on the control medium. Upwards of 95% germination rate of control, great difference of II appeared even between 2 mM and 1 mM. That could explicate why no visible inhibition on lesion growth in vivo with the lower concentrations (under 2 mM) tested.
Effect of phenolic compounds on mycelial growth in vitro
Inhibitory effect of ethanol. Based on results, mycelia of M. laxa were sensitive to ethanol (Fig. 12). At 2 and 4 dip, upward of 5% ethanol has a full inhibitory effect on mycelial growth. A concentration of 2.5% ethanol significantly reduced mycelial growth (P < 0.05) compared with the control (sterile water), while below 1.25%, ethanol has no significant effect. To limit the effect of ethanol in experiments with the phenolic compounds, the concentration of ethanol in the media was fixed at 1%.
Inhibitory effect of CA, PCA and FA. According to the results on the germination of M. laxa conidia, three compounds (CA, PCA and FA) were chosen for a study of their effect on mycelial growth. No significant difference was found between the growth of the fungus on the two types of control (sterile water and 1% ethanol) at 3 (A) and 6 (B) dip (Fig. 13), showing that this dose of ethanol was not deleterious for the fungus. None of the three compounds inhibited completely the mycelial growth of the fungus at any of the
16 concentrations under study. However, all three compounds significantly (P < 0.05) reduced
mycelial growth at the highest concentration (2 mM) at both times of observation. The reduction relative to the ethanol control was quite substantial, amounting to 20, 29 and 43% for CA, PCA and FA, respectively at 6 dpi. Smaller but statistically significant reductions were also observed for PCA and FA at 1mM.
This finding accord with results of inhibition on lesion growth and on conidial germination that capacity of inhibition on infection of M. laxa was: FA > PCA > CA.
Conclusions and Future Prospects
The inoculation technique used in this study simulated natural M. laxa infection on humid and wet Prunus sp. petals. Based on results of our study, susceptibility of tested genotypes was: peach „8858‟ < almond „xa1‟, „xa2‟, „xb‟, „p3606‟, „ZH4‟ and „ZH81‟ < apricot „A2312‟ < peach „7970‟ and sweet cherry „ce‟. Some of them such as ZH81 and 8858 present a stable capacity of resistance against M. laxa, while the others were relatively variable. Their physiological state and sensitivity to storage conditions could explain this different variability among cultivars. This further suggests that tests with flowers should (i) be carried out with large numbers of independent repetitions and (ii) that care should be taken to document well the physiological state / storage conditions of the flowers used in such tests in the laboratory.
The concentrations of 10% ethanol did not have any significant inhibitory effect on lesion growth on petals compared with sterile water, while, upward of 1.25% ethanol significantly inhibited mycelial growth in vitro. Ethanol at concentrations of 10% and 20% has been used together with hot water to control postharvest decay of peaches against Monilinia diseases (Margosan, 1997). For this study, the effects of ethanol had always be checked and limited.
Observations of lesion growth and microscopy of the petal segments clearly showed that FA (2 mM) was effective in inhibiting lesion development even though germination of M. laxa was not systematically inhibited on petals. On artificial substrates, the significant inhibition by FA of conidial germination and mycelial growth occurred at a relatively low concentration of 0.5 mM.
Compounds CA and PCA have a same base of chemical structure (dihydroxycinnamic acid) as FA, with a difference in the functions combined (table 1). The compared inhibitory effect in vivo and in vitro of those three compounds was concordant: FA > PCA > CA. The role and position of the phenolic function could be hypothesized to be related to the inhibitory effect.
Compounds CGA and NCGA are isomers, as well as CC and ECC and DCQA has a same part of the chemical structure as CGA and NCGA (caffeoylquinic acid which has two available phenolic functions). However, in vivo and in vitro data of these five compounds were generally varied. On petals of Prunus, inhibitory effects were observed on specific genotypes such as almond ZH81. But on artificial media, no-significant inhibition of
18 conidial germination has been noted at the same concentration as tests in vivo (2 mM). So
their inhibitory effects are inferred to be associated with the host genotype.
In an ongoing companion study of UR GAFL (internship of Y. Ye; same Master Program), the concentrations of PCA in the epidermis of peach „zephir 143‟ decreased significantly from stage I (43 days after flowering) to stage II (43~100 days after flowering), and then increased significantly at stage III (137 days after flowering). The change of the concentrations of CC is completely the opposite. At the same time, the sensibility of each stage of peach fruit was compared by inoculations with the same isolate ML3 of M. laxa which was used in the present study. According to results, stage II was more susceptible than stages I and III. The finding suggested that phenolic compounds PCA and CC may be involved in the natural defense of peach fruit against M. laxa.
In fruit, constitutive natural barriers such as the cuticle, exocarp or phenolic compounds are the first defense mechanisms against necrotrophs. The role of phenolic compounds on plant defense against M. laxa has been frequently studied (Tamm et al., 1994; Villarino et al., 2011). The techniques used in this study were initial and developed. Future studies will confirm the sensibility of genotypes and assess the pathway of inhibitory effects of each phenolic compound.
References
Adaskaveg J.E., Feliciano A.J. and Ogawa J.M., 1989. Comparative studies of resistance in peach genotypes to Monilinia fruticola. Abs.387; Proc. Amer. Phytopathol.Soc. Annu. Meeting, 20 to 24 Aug. 1989, Richmond, Va. (Abstr.)
Adaskaveg J.E., Forster H., and Thompson D.F. 2000. Identification and etiology of visible quiescent infections of Monilinia fructicola and Botrytis cinerea in sweet cherry fruit. Plant Disease 84, pp. 328-333
Adaskaveg J.E., Schnabel G. and Förster H. 2008. Diseases of Peach Caused by Fungi and Fungal-like Organisms: Biology, Epidemiology and Management. In: Bassi, D. and Layne D. (ed.). The Peach: Botany, Production and Uses. CABI international. pp. 107-133
Bassi D. and Monet R., 2008, Botany and Taxonomy, In: Bassi, D. and Layne D. (ed.). The Peach: Botany, Production and Uses. CABI international, pp. 1-36 and 615
Batra L.R. 1979. First Authenticated North American Record of Monilinia fructigena, With Notes on Related Species. Mycotaxon 8: pp. 476-484
Biggs A. R. and Northover J., 1988, Early and Late-season Susceptibility of Peach Fruits to Monilinia fructicola. Plant Dis. 72: pp. 1070-1074
Bostock R.M., Wilcox S.M., Wang G., Adaskaveg J.E., 1999, Suppression of Monilinia fructicola Cutinase Production By Peach Fruit Surface Phenolic Acids. Physiological and Molecular Plant Pathology 54: pp. 37-50
Byrde R.J.W., Willetts H.J., 1977, The Brown Rot Fungi of Fruit: Their Biology And Control (1st edn), Pergamon Press Ltd, Oxford
Côté M.-J., Tardif M.-C., and Meldrum A. J. 2004. Identification of Monilinia fructigena, M. fructicola, M. laxa, and Monilia polystroma on Inoculated and Naturally Infected Fruit Using Multiplex PCR. Plant Dis. 88: pp. 1219-1225
Cruz I.A.P. 2010. Peach Fruit Resistance to Brown Rot (Monilinia spp.): A Genomic Approach. Genetics, Molecular Science and Plant, Food and Environmental Biotechnology.
De Cal A. and Melgarejo P., 1993, Effects of Pyroquilon on the Infection Process by Monilinia laxa. Pestic. Sci. 39: pp. 267-269
De Cal A. and Melgarejo P., 1994, Effects of Penicillium frequentans and Its Antibiotics on Unmelanized Hyphae of Monilinia laxa. Phytopathology 84: pp. 1010-1014
Feliciano A., Feliciano A.J. and Ogawa J.M., 1987. Monilinia fructicola resistance in peach cultivar Bolinha. Phytopathology 77: pp. 776-780
Gell I, Cubero J, Melgajero P, 2007. Two Different Approaches for universal Diagnosis of brown Rot and Identification of Monilinia spp. in Stone Fruit Trees. Journal of Applied Microbiology 103, pp. 2629– 37
Gell I.; De Cal A.; Torres R.; Usall J.; Melgarejo P., 2008. Relationship between the incidence of latent infections caused by Monilinia spp. and the incidence of brown rot of peach fruit: Factors affecting latent infection. Eur. J. Plant Pathol. 121: pp. 487–498
Gradziel T. M. and Dechun W., 1993, Evaluation of Brown Rot Resistance and its Relation to Enzymatic Browning in Clingstone Peach Germplasm. J. AMER. SOC. HORT. SCI. 118(5): pp. 675-679
Gradziel T.M., Thorpe M.A., Bostock R.M. and Wilcox S., 1997, Breeding for brown rot (Monilinia fructicola) resistance in clingstone peach with emphasis on the role of fruit phenolics. Acta Horticulturae 465, pp. 161–170
Guizzardi M., Caccioni D., and Pratella G.C. 1995. Resistance monitoring of Monilinia laxa (Aderh. & Ruhl.) Honey to benzymidazole and dicarboxymides in postharvest stage. J. Plant Dis. Prot. 102: pp. 86-90
Holb I.J., 2008, Brown rot blossom blight of pome and stone fruits: symptom, disease cycle, host resistance, and biological control. International Journal of Horticultural Science 14(3): pp. 15-21
Ibbotson-Darhower H., Hickey K. D. and Tarvis J. W., 1998, Susceptibility of peach and nectarine fruit at different developmental stages to Monilinia fructicola. Phytopathology 88(suppl.): S130
20 Karabulut O.A.,Cohen L.,Wiess B.,Daus A.,Lurie S.,Droby S. 2002. Control of brown rot and blue mold of
peach and nectarine by short hot water brushing and yeastantagonists.PostharvestBiol.Technol.24: pp. 103-111.
Karabulut O.A., Smilanick J.L., Crisosto C.L., Palou L. 2010. Control of brown rot of stone fruits by brief heated water immersion treatments. Crop Protection 29: pp. 903-906
Kosuge T., 1969, The role of phenolics in host response to infection. Phytopathology 7: pp. 195-222
Lane C.R., 2002, A synoptic key for differentiation of Monilinia fructicola, M. fructigena and M. laxa, based on examination of cultural characters. Bulletin OEPP/EPPO Bulletin 32: pp. 489-493
Lee M.H. and Bostock R.M., 2006. Induction, Regulation, and Role in Pathogenesis of Appressoria in Monilinia fructicola. Phytopathology 96: pp. 1072-1080
Lee M.H. and Bostock R.M., 2007, Fruit exocarp phenols in relation to quiescence and development of Monilinia fructicola infections in Prunus spp.: A role for cellular redox? Phytopathology 97, pp. 269-277
Luo Y. and Michailides T. J., 2001, Factors affecting latent infection of prune fruit by Monilinia fructicola. phytopathology 91: pp. 864-872
Ma Z.,Michael A.,Yoshimura M.A.,Michailides T.J. 2003. Identification and Characterization of benzimidazole resistance in Monilinia fructicola from stone fruit orchards in California. Appl.Environ.Microbiol.69: pp. 7145-7152
Manibhushanrao K., Zuber M. and Matsuyama N., 1988, Phenol metabolism and plant disease resistance. Acta Phytopathologica et Entomologica Hungarica. 23(1-2): pp. 103-114
Margosan D.A.,Smilanick J.L.,Simmons G.F.,Henson D.J.,1997. Combination of hot water and ethanol to control postharvest decay of peaches and nectarines.Plant Dis. 81. pp, 1405-1409
Maria V. et al. 2011. High Chlorogenic and Neochlorogenic Acid Levels in Immature Peaches Reduce Monilinia laxa Infection by Interfering with Fungal Melanin Biosynthesis. American Chemical Society. J. Agric. Food Chem. 59: pp. 3205–3213
Mercier V., Martinot G., Deplaude H. 2009. Monilioses du pêcher, déterminer les espèces et évaluer leur épartition. PHYTOMA-la défense des végétaux 626-627: pp. 45-48
Robertson J.A., Meredith F.I. and Scorza R., 1988, Characteristics of fruit from high and low-quality peach cultivars. HortScience 23, pp. 1032–1034
Sanoamuang N. and Gaunt R. E. 1995. Persistence and fitness of carbendazim- and dicarboximide-resistant isolates of Monilinia fructigena (Wint.) Honey in flowers, shoots and fruit of stone fruit. Plant Pathol. 44: pp. 448-457
Tamm L. and Flückiger W., 1993, Influence of temperature and moisture on growth, spore production, and conidial germination of Monilinia laxa. phytopathology 83: pp. 1321-1326.
Tamm L. Minder C.E. Flückiger W. 1994. Phenological Analysis of Brown Rot Blossom Blight of Sweet Cherry Caused by Monilinia laxa. Phytopathology 85: pp. 401-408
Tomas-Barbera et al., 2001. HPLC-DAD-ESIMS Analysis of Phenolic Compounds in Nectarines, Peaches, and Plums. J. Agric. Food Chem. 4: pp. 4748-4760
van Brouwershaven I.R., Bruil M. L., van Leeuwen G. C. M., Kox L. F. F. 2010. A real-time (TaqMan) PCR assay to differentiate Monilinia fructicola from other brown rot fungi of fruit crops. Plant Pathology 59: pp. 548-555
van Leeuwen G.C.M. and van Kesteren H. A. 1998. Delineation of the three brown rot fungi of fruit crops (Monilinia spp.) on the basis of quantitative characteristics. Can. J. Bot 76: pp. 2042-2050
Villarino M., Sandin-Espana P., Melgarejo P., De Cal A., 2011, High Chlorogenic and Neochlorogenic Acid Levels in Immature Peaches Reduce Monilinia laxa Infection by Interfering with Fungal Melanin Biosynthesis. Journal of Agricultural and Food Chemistry 59(7): pp. 3205-3213
Willetts H.J., Bullock S., 1993, Cytology, histology, and histochemistry of fruit infection by Monilinia species. In: Biggs A.R (Ed.), Handbook of cytology, histology, and histochemistry of fruit tree diseases. CRC Press, Inc.: Boca Raton, pp. 113-136
ANNEX. I. Effect of phenolic compounds on disease development.
Abbreviation: CA: caffeic acid; PCA: p-coumaric acid; FA: ferulic acid; DCQA: 3, 5-dicaffeoyliquinic acid; CGA: chlorogenic acid; NCGA: neochlorogenic acid; CC: catechin; ECC: epicatechin.
PI: protection indices (%).
<0; sans * <50; avec * <0; avec * >50; sans * <50; sans * >50; avec *
A. The petals were inoculated with 2 µL solution mixed with 2 mM compounds and a conidial suspension of Monilinia laxa (250 conidia / µL). Lesions were photographed on 1 day post inoculation. Column values labeled with „*‟ are significantly different (α = 0.05) with 5% ethanol control according to the test of Newman et Keuls.
Compounds
Peach Sweet cherry
7970 8858 ce PI Replicates per modality (petals x box) Day of test (d/m) PI Replicates per modality (petals x box) Day of test (d/m) PI Replicates per modality (petals x box) Day of test (d/m) CA 13.32 5x2 / 5x2 19/3 -0.22 10x2 / 10x2 2/4 -163.14 10x2 / 10x2 3/4 -3.81 10x2 / 10x2 4/4 6.84 10x2 / 10x2 4/4 p-CA 64,84* 5x2 / 5x2 19/3 9.16 10x2 / 10x2 4/4 21.59 10x2 / 10x2 4/4 FA 95,34* 10x2 / 10x2 4/4 97,80* 10x2 / 10x2 4/4 DCQA 50,87* 10x2 / 10x2 2/4 -163.17 10x2 / 10x2 3/4 CGA 55.15 5x1 / 5x2 19/3 97,11* 10x2 / 10x2 2/4 35.59 10x1 / 10x2 3/4 18.43 5x1 / 5x2 19/3 -462.45 10x1 / 10x2 3/4 NCGA 83,44* 10x2 / 10x2 2/4 -58.24 10x2 / 10x2 3/4 CC 63,03* 5x2 / 5x2 19/3 15.89 10x2 / 10x2 4/4 8.24 10x2 / 10x2 4/4 ECC 12.96 10x2 / 10x2 4/4 -30.72 10x2 / 10x2 4/4
Compound Almond p3606 xa1 xa2 xb ZH81 PI Replicates per modality (petals x box) Day of test (d/m) PI Replicates per modality (petals x box) Day of test (d/m) PI Replicates per modality (petals x box) Day of test (d/m) PI Replicates per modality (petals x box) Day of test (d/m) PI Replicates per modality (petals x box) Day of test (d/m) CA 51,54* 5x2 / 5x1 19/3 -81.54 5x2 / 5x2 19/3 39,66* 10x2 / 10x1 27/3 38,82* 5x2 / 5x2 19/3 23.60 10x2 / 10x1 27/3 42,32* 10x2 / 10x2 28/3 PCA 39,82* 5x2 / 5x1 19/3 28.29 5x2 / 5x2 19/3 15.62 5x2 / 5x2 21/3 24,92* 10x2 / 10x1 27/3 24.03 5x2 / 5x1 19/3 4.93 10x2 / 10x1 27/3 36,58* 5x2 / 5x2 21/3 17.64 10x2 / 10x2 28/3 FA 100* 5x2 / 5x2 21/3 100.00 5x2 / 5x2 21/3 97,99* 10x2 / 10x1 27/3 97,45* 10x2 / 10x1 27/3 100* 10x2 / 10x2 28/3 DCQA 81,04* 5x2 / 5x2 20/3 72.03 5x2 / 5x2 20/3 78,42* 5x2 / 5x2 20/3 13.75 10x2 / 10x2 26/3 -4.77 5x2 / 5x2 21/3 -44.00 5x2 / 5x2 21/3 95,77* 10x2 / 10x2 29/3 CGA 43,19* 5x2 / 5x1 19/3 -35.15 5x2 / 5x2 19/3 17.59 10x2 / 10x2 26/3 28,28* 5x2 / 5x1 19/3 31.53 10x2 / 10x2 29/3 NCGA 44,6* 5x2 / 5x2 21/3 -687.46 5x1 / 5x2 21/3 58,52* 10x2 / 10x2 28/3 -159.41 5x1 / 5x2 21/3 67,50* 10x1 / 10x2 29/3 -69.14 10x1 / 10x2 29/3 CC 43,9* 5x2 / 5x1 19/3 -12.36 5x2 / 5x2 19/3 2.23 5x2 / 5x2 20/3 66,17* 5x2 / 5x2 20/3 66,08* 10x2 / 10x2 28/3 29.18 5x2 / 5x1 19/3 71,51* 10x2 / 10x2 29/3 22.73 5*1 / 5*2 20/3 70,97* 5x1 / 5x2 20/3 ECC 39,22* 5*2 / 5*2 20/3 19.75 5x2 / 5x2 20/3 48,95* 5x2 / 5x2 20/3 81,49* 10x2 / 10x2 28/3 24.30 10x2 / 10x2 29/3
B . The petals were inoculated with 2 µL solution mixed with 2 mM compounds and a conidial suspension of Monilinia laxa (50 conidia / µL). Lesions were photographed on 2 days post inoculation.
Compounds
Peach Sweet cherry
7970 8858 ce PI Replicates per modality (petals x box) Day of test (d/m) PI Replicates per modality (petals x box) Day of test (d/m) PI Replicates per modality (petals x box) Day of test (d/m) CA 38.65 5x2 / 5x2 19/3 17.07 10x2 / 10x2 2/4 -51.26 10x1 / 10x2 3/4 -19.51 10x1 / 10x2 4/4 11.16 10x1 / 10x2 3/4 33.00 10x1 / 10x2 4/4 81,63* 10x1 / 10x1 4/4 54,52* 10x1 / 10x1 4/4 33.37 10x1 / 10x1 4/4 -65.00 10x1 / 10x1 4/4 p-CA 31.32 5x2 / 5x2 19/3 -13.46 10x2 / 10x2 4/4 46,35* 10x2 / 10x1 4/4 -32.85 10x2 / 10x1 4/4 FA 83,99* 10x2 / 10x2 4/4 89,62* 10x2 / 10x1 4/4 74.28 10x2 / 10x1 4/4 DCQA 16.31 10x2 / 10x2 2/4 65,24* 10x2 / 10x2 3/4 CGA 26.25 5x2 / 5x2 19/3 29.87 10x2 / 10x2 2/4 23.63 10x2 / 10x2 3/4 NCGA -13.30 10x2 / 10x2 2/4 -28.29 10x1 / 10x2 3/4 28.81 10x1 / 10x2 3/4 CC 33.12 5x2 / 5x2 19/3 -10.40 10x2 / 10x2 4/4 6.10 10x2 / 10x1 4/4 62,08* 10x2 / 10x1 4/4 ECC 3.33 10x2 / 10x2 4/4 -2.13 10x2 / 10x1 4/4 58,76* 10x2 / 10x1 4/4