HAL Id: tel-03242796
https://hal.inria.fr/tel-03242796
Submitted on 31 May 2021HAL is a multi-disciplinary open access archive for the deposit and dissemination of sci-entific research documents, whether they are pub-lished or not. The documents may come from teaching and research institutions in France or abroad, or from public or private research centers.
L’archive ouverte pluridisciplinaire HAL, est destinée au dépôt et à la diffusion de documents scientifiques de niveau recherche, publiés ou non, émanant des établissements d’enseignement et de recherche français ou étrangers, des laboratoires publics ou privés.
Heart & Brain: Linking Cardiovascular Pathologies and
Neurodegeneration with a Combined Biophysical and
Statistical Methodology
Jaume Banus
To cite this version:
Jaume Banus. Heart & Brain: Linking Cardiovascular Pathologies and Neurodegeneration with a Combined Biophysical and Statistical Methodology. Modeling and Simulation. Université Côte d’Azur, 2021. English. �tel-03242796�
THÈSE DE DOCTORAT
Coeur & Cerveau: lien entre les pathologies
cardiovasculaires et la neurodégénérescence par une
approche combinée biophysique et statistique
Jaume B
ANUSC
OBOINRIA, Équipe EPIONE
Thèse dirigée parMaxime SERMESANTet co-dirigée parMarco LORENZIetOscar CAMARA
Soutenue le 26 Mai, 2021
Présentée en vue de l’obtention du grade de DOCTEUR EN AUTOMATIQUE, TRAITEMENT DUSIGNAL ET DESIMAGESde l’UNIVERSITÉCÔTE D’AZUR.
Devant le jury composé de : Alistair YOUNG
Boudewijn LELIEVELDT
Juan Domingo GISPERT
Frederik BARKHOF
Maxime SERMESANT
Marco LORENZI
Oscar CAMARA
King’s College London Rapporteur
Leiden University Medical Center Rapporteur Barcelonaβeta Brain Research Center Examinateur VU University Medical Center Amsterdam Examinateur
Inria Sophia Antipolis Directeur de thèse
Inria Sophia Antipolis Co-directeur de thèse
Membres du Jury
Titre françaisCoeur & Cerveau: lien entre les pathologies cardiovasculaires et la
neurodégénérescence par une approche combinée biophysique et
statistique
Titre anglais
Heart & Brain: Linking Cardiovascular Pathologies and
Neurode-generation with a Combined Biophysical and Statistical
Methodol-ogy
Devant le jury composé de :
Rapporteurs
Alistair YOUNG, Professeur, King’s College London
Boudewijn LELIEVELDT, Professeur, Leiden University Medical Center
Examinateurs
Juan Domingo GISPERT, Directeur de recherche, Barcelonaβeta Brain Research Center Frederik BARKHOF, Professeur, VU University Medical Center Amsterdam
Maxime SERMESANT, Chargé de recherche - HDR, Inria Sophia Antipolis
Marco LORENZI, Chargé de recherche - HDR, Inria Sophia Antipolis Oscar CAMARA, Professeur, Universitat Pompeu Fabra
Abstract
Clinical studies have identified several cardiovascular risk factors associated to dementia and cardiac pathologies, but their pathological interaction remains poorly understood. Classically, the investigation of the heart-brain relationship is mostly carried out through statistical analysis exploring the association between cardiac indicators and cognitive biomarkers. This kind of investigations are usually performed in large-scale epidemiolog-ical datasets, for which joint measurements of both brain and heart are available. For this reason, most of these analyses are performed on cohorts representing the general popu-lation. Therefore, the generalisation of these findings to dementia studies is generally difficult, since extensive assessments of cardiac and cardiovascular function in currently available dementia dataset is usually lacking. Another limiting factor of current studies is the limited interpretability of the complex pathophysiological relations between heart and brain allowed by standard correlation analyses. Improving our understanding of the implications of cardiovascular function in dementia ultimately requires the development of more refined mechanistic models of cardiac physiology, as well as the development of novel approaches allowing to integrate these models with image-based brain biomarkers. To address these challenges, in this thesis we developed new computational tools based on the integration of mechanistic models within a statistical learning framework.
First, we studied the association between non-observable physiological indicators, such as cardiac contractility, and brain-derived imaging features. To this end, the parameter-space of a mechanistic model of the cardiac function was constrained during the personalisation stage based on the relationships between the parameters of the cardiac model and brain information. This allows to tackle the ill-posedness of the inverse problem associated to model personalisation, and obtain patient-specific solutions that are comparable population-wise.
Second, we developed a probabilistic imputation model that allows to impute miss-ing cardiac information in datasets with limited data. The imputation leverages on the cardiac-brain dynamics learned in a large-scale population analysis, and uses this knowledge to obtain plausible solutions in datasets with partial data. The generative nature of the approach allows to simulate the evolution of cardiac model parameters as brain features change. The framework is based on a conditional variational autoencoder (CVAE) combined with Gaussian process (GP) regression.
Third, we analysed the potential role of cardiac model parameters as early biomarkers for dementia, which could help to identify individuals at risk. To this end, we imputed missing cardiac information in an Alzheimer’s disease (AD) longitudinal cohort. Next, via disease progression modelling we estimated the disease stage for each individual based on the evolution of biomarkers. This allowed to obtain a model of the disease evolution, to analyse the role of cardiac function in AD, and to identify cardiac model parameters as potential early-stage biomarkers of dementia.
These results demonstrate the importance of the developed tools by providing clinically plausible associations between cardiac model parameters and brain imaging features in an epidemiological dataset, as well as highlighting insights about the physiological relationship between cardiac function and dementia biomarkers. The obtained results open new research directions, such as the use of more complex mechanistic models that allow to better characterise the heart-brain relationship, or the use of biophysical cardiac models to derive in-silico biomarkers for identifying individuals at risk of dementia in clinical routine, and/or for their inclusion in neuroprotective trials.
Keywords: medical imaging, cardiovascular modelling, neurodegeneration, lumped models, machine learning, variational autoencoder, Gaussian process, personalisation.
Résumé
Les études cliniques ont identifié plusieurs facteurs de risque cardiovasculaire associés à la démence et aux pathologies cardiaques, mais leur interaction pathologique reste mal comprise. Habituellement, l’étude de la relation cœur-cerveau est principalement réalisée à travers d’analyses statistiques explorant l’association entre les indicateurs cardiaques et les biomarqueurs cognitifs. Ce type d’étude est généralement réalisé dans des bases de données épidémiologiques à grande échelle, pour lesquelles des mesures conjointes du cerveau et du cœur sont disponibles. Pour cette raison, la plupart de ces analyses sont effectuées sur des cohortes représentant la population générale. Par conséquent, la généralisation de ces résultats aux études sur la démence est difficile, car les évaluations approfondies des fonctions cardiaques et cardiovasculaires dans les bases de données sur la démence actuellement disponibles font généralement défaut. Un autre facteur limitatif des études actuelles est l’interprétabilité limitée des relations physiopathologiques com-plexes entre le cœur et le cerveau que permettent les analyses de corrélation standard. L’amélioration de notre compréhension des implications de la fonction cardiovasculaire dans la démence nécessite finalement le développement de modèles mécniaques de la physiologie cardiaque plus raffinés , ainsi que le développement de nouvelles approches permettant d’intégrer ces modèles avec des biomarqueurs cérébraux basés sur l’image. Pour relever ces défis, nous avons développé dans cette thèse de nouveaux outils infor-matiques basés sur l’intégration de modèles mécaniques dans un cadre d’apprentissage statistique.
Premièrement, nous avons étudié l’association entre des indicateurs physiologiques non observables, tels que la contractilité cardiaque, et des caractéristiques d’imagerie dérivées du cerveau. À cette fin, l’espace des paramètres d’un modèle mécanique de la fonction cardiaque a été contraint pendant l’étape de personnalisation sur la base des relations entre les paramètres du modèle cardiaque et les informations cérébrales. Cela permet d’attenuer le caractère mal defini du problème inverse associé à la personnalisation du modèle, et d’obtenir des solutions spécifiques au patient qui sont comparables au sein de la population.
Deuxièmement, nous avons développé un modèle d’imputation probabiliste qui permet d’imputer les informations cardiaques manquantes dans des bases de données limitées. L’imputation repose sur les dynamiques cœur-cerveau apprises à partir de l’analyse d’une grande population de sujets, et utilise cette connaissance pour obtenir des solutions
sibles dans des bases de données partielles. La nature générative de l’approche permet de simuler l’évolution des paramètres du modèle cardiaque lorsque les caractéristiques du cerveau changent. Le cadre est basé sur un “conditional variational autoencoder” (CVAE) combiné à une régression “Gaussian process” (GP).
Troisièmement, nous avons analysé le rôle potentiel des paramètres du modèle cardiaque comme biomarqueurs précoces de la démence, ce qui pourrait aider à identifier les individus à risque. Dans ce but, nous avons imputé les informations cardiaques man-quantes dans une cohorte longitudinale de la maladie d’Alzheimer. Ensuite, grâce à la modélisation de la progression de la maladie, nous avons estimé le stade de la maladie pour chaque individu sur la base de l’évolution des biomarqueurs. Ceci a permis d’obtenir un modèle de l’évolution de la maladie, d’analyser le rôle de la fonction cardiaque dans la maladie d’Alzheimer, et d’identifier les paramètres du modèle cardiaque comme biomarqueurs potentiels de la démence à un stade précoce.
Les résultats démontrent l’importance des outils développés en obtenant des associations cliniquement plausibles entre les paramètres du modèle cardiaque et les caractéristiques de l’imagerie cérébrale dans une base de données épidémiologiques. Ces résultats mettent également en évidence des informations sur la relation physiologique entre la fonction cardiaque et les biomarqueurs de la démence. Les résultats obtenus ouvrent de nouvelles voies de recherche, telles que l’utilisation de modèles mécaniques plus complexes permettant de mieux caractériser la relation cœur-cerveau, ou l’utilisation de modèles cardiaques biophysiques pour dériver des biomarqueurs in-silico afin d’identifier les individus à risque de démence dans la routine clinique, et/ou pour leur inclusion dans des essais neuroprotecteurs.
Mots-clés: imagerie médicale, modélisation cardiovasculaire, neurodégénérescence, modèles regroupés, apprentissage automatique, autoencodeur variationnel, processus Gaussien, personnalisation
Acknowledgements
I would like to thank first my thesis supervisors, Maxime Sermesant, Marco Lorenzi and Oscar Camara. Thank you for giving me this opportunity and for all your help and support during these years. Every interaction with you has taught me a lot, thank you very much for your ideas and motivation in difficult moments, you have helped me to grow as a researcher and as a person. Many thanks also to Nicholas Ayache for allowing me to be part of this fabulous team, allowing me to enjoy such an inspiring research environment in the wonderful Côte d’Azur.
I am very grateful to Alistar Young and to Boudewijn Lelieveldt for reviewing this manuscript and providing constructive feedback and insights. Sincere thanks to Frederik Barkhof and to Juan Domingo Gispert for accepting to be members of my jury and their helpful and inspiring comments. Thanks also to Xavier Pennec and to Irene Vignon-Clementel for your valuable inputs in the comité de suivi. Thank you all for your valuable time.
Many thanks to all the Epione team and the people I have met at INRIA, it has been a pleasure to share meals, coffee breaks and the retreats at Auron with all of you. Thanks for the beach volley afternoons, the futbolin games, the beers and the hikes! Thanks to Marco M. for the chess and football lessons, to Zihao, for letting us see Julian cry with laughter, to Yann T. for your patience and kindness even when I speak French, to Selma for your facility to make me laugh and your competitiveness in the beach volley afternoons, to Pawel for your joy in the futbolin games, to Raphaël and Julian for showing us the best hiking routes, to Benoît for complaining together, to Marta for being the best Bordeaux guide. And especially, to Sara, for your advice, energy and for those games of ’cards against humanity’, to Santiago, for your generosity, your contagious happiness, and your harepas!, and of course to Luigi and Clément, I couldn’t have had better office mates, I am grateful to have shared this experience with you. Luigi, thanks for always teaching me something new, for solving any problem, and thanks for your limoncellos. Clément, there is only one way to summarize it: Switerland-Serbia 2018, that day I knew we would live great things. Caballeros, it will be hard to be in an office without you! And again, thanks to all the Epione memebers for making INRIA such a nice place, Nicolas G, Shuman, Bastien, Tania, Nicolas C. , Yann F., Etrit, Irene, Yingyu, Wen, Florent, Gaëtan, Hind, Buntheng, Paul, Dimitri, Hari and all the others. And thanks to Isabelle for your help in the navigation of INRIA’s burocracy.
To my friends, for their invaluable support and for being there despite my tendency to disappear. Thank you for making me feel close to home even when I was far away.
Simone, thank you for being by my side every day and making me smile even in the most difficult moments, thank you for your constant support and for understanding me even when I don’t understand myself. I feel very lucky to grow up together with you, thank you.
And to my family, my parents and my sister, thank you for all the support, help and love throughout my life. This thesis is dedicated to you,
Financial Support
This work has been supported by the French government, through the 3IA Côte d’Azur Investments in the Future project managed by the National Research Agency (ANR) with the reference number ANR-19-P3IA-0002, and by the ANR JCJC project Fed-BioMed 19-CE45-0006-01. The project was also supported by the Inria Sophia Antipolis - Méditer-ranée, “NEF" computation cluster and by the Spanish Ministry of Science, Innovation and Universities under the Retos I+D Programme (RTI2018-101193-B-I00) and the Maria de Maeztu Units of Excellence Programme (MDM-2015-0502).
Contents
1 Introduction 3
1.1 Clinical context . . . 3
1.2 Methodological context . . . 6
1.3 Objectives and organisation of the thesis . . . 8
1.4 Publications and software packages . . . 10
1.5 Data availability . . . 10
1.6 Code availability . . . 11
2 Heart & Brain: Physiological Relationship 13 2.1 The Heart . . . 13
2.2 Vascular system . . . 18
2.3 The Brain . . . 24
2.4 CSF circulation and waste clearance . . . 27
2.5 Heart & Brain Relationship . . . 30
3 Biophysics-constrained Statistical Learning for Heart & Brain Analysis 33 3.1 Introduction . . . 34
3.2 Methodological context . . . 35
3.3 Methodological framework . . . 36
3.3.1 Cardiovascular biophysical model . . . 37
3.3.1.1 The BCS model: modelling sarcomere contraction . . . 38
3.3.1.2 Overall constitutive law . . . 39
3.3.1.3 Haemodynamic Model . . . 39
3.3.1.4 Reduced Equations for the 0D model . . . 41
3.3.2 Biophysics-based statistical learning . . . 43
3.4 Application to brain and heart data . . . 46
3.4.1 Clinical data and pre-processing . . . 46
3.4.2 UK Biobank . . . 51
3.4.2.1 Model plausibility . . . 51
3.4.2.2 Analysis of brain-cardiac relationship in the UK Biobank 52 3.4.2.3 Uncertainty Analysis . . . 54
3.4.3 AF subgroup analysis . . . 56
3.5 Discussion . . . 59
3.6 Conclusion . . . 60
4 Cardiac Imputation Method for Incomplete Datasets 61
4.1 Introduction . . . 61
4.2 Methods . . . 63
4.2.1 Problem statement . . . 63
4.2.2 Data processing and cardiovascular model . . . 64
4.2.3 Experiments . . . 65
4.3 Results . . . 66
4.3.1 Data imputation and regression . . . 66
4.3.2 Cardiovascular dynamics simulation and model plausibility . . . 67
4.4 Conclusion . . . 70
5 Alzheimer’s Disease Progression Model including Heart & Brain 71 5.1 Introduction . . . 71
5.2 Methods . . . 73
5.2.1 Data processing . . . 74
5.2.2 Cardiac data imputation . . . 75
5.2.3 Disease progression modeling . . . 76
5.3 Results . . . 76
5.3.1 Imputed data . . . 76
5.3.2 Disease evolution . . . 79
5.3.3 Relationship of estimated disease stage with CSF/PET biomarkers 83 5.4 Discussion . . . 84
5.5 Conclusions . . . 86
6 Conclusions 87 6.1 Main contributions . . . 87
6.1.1 Introduction of prior knowledge in multi-organ analysis . . . 88
6.1.2 Imputation of missing data based on cardiac dynamics . . . 88
6.1.3 Biophysical parameters as biomarkers for risk stratification . . . . 89
6.2 Perspectives and future applications . . . 89
6.2.1 Analysis of wave propagation effects . . . 89
6.2.2 Multi-organ analysis . . . 89
6.2.3 Effect of drugs in longitudinal trajectories and personalised treatment 90 6.2.4 Analysis of CSF and blood flow coupling . . . 90
Appendices 93 A Implementation of a Lattice Boltzmann Solver to Study CSF flow dynamics 95 A.1 Introduction . . . 95
A.2 Navier-Stokes equations . . . 97
A.2.1 Conservation of mass . . . 98
A.2.2 Conservation of momentum . . . 98
A.3.1 Computational aspects . . . 102
A.3.2 Implementation . . . 105
A.3.2.1 Lattice characteristics . . . 106
A.3.2.2 Guo Force . . . 107
A.3.2.3 MRT and TRT . . . 107
A.4 2D Validation of LBM simulator . . . 109
A.4.1 Taylor-Green vortex decay . . . 110
A.4.2 Four rows mill . . . 111
A.4.3 Poiseuille flow . . . 112
A.5 Perspectives and preliminary work . . . 113
Bibliography 117
Glossary:
τ: Arterial compliance.
σ0: Contractility.
C1: Stiffness.
R0: Left ventricle radius.
Rp: Peripheral resistance. AF: Atrial fibrillation.
BSA: Body surface area.
CO: Cardiac output.
DBP: Diastolic blood pressure.
EDV: End-diastolic volume.
EF: Ejection Fraction.
ESV: End-systolic volume.
GM: Grey matter.
IUP: Iteratively updated priors.
MBP: Mean blood pressure.
SBP: Systolic blood pressure.
SV: Stroke volume.
WM: White matter.
WMHs: White matter hyperintensities.
1
Introduction
Contents
1.1 Clinical context . . . 3
1.2 Methodological context . . . 6
1.3 Objectives and organisation of the thesis . . . 8
1.4 Publications and software packages . . . 10
1.5 Data availability . . . 10
1.6 Code availability . . . 11
1.1
Clinical context
In 2018, 48 million people worldwide suffered from dementia with an estimated cost of 819$ billion per year, making dementia one of the leading causes of death and disability. Due to the global ageing of the population, the prevalence of dementia is expected to triple by 2050 [Wolters, 2018; Nichols, 2019]. The growing burden of dementia imposes an increasing level of stress on the families and over the healthcare system, thus curative and preventive measures are urgently needed. Dementia is associated with a broad range of neurological disorders, Alzheimer’s disease (AD) being the most common [Dichgans, 2017]. AD is a neurodegenerative disease in which subclinical alterations in the brain take place decades before the occurrence of clinical symptoms and cognitive decline [Jack, 2013]. During the presymptomatic phase, abnormal deposition of extracellular beta-amyloid (Aβ) as amyloid plaques and intracellular tau as tangles are formed. Amyloid plaques interfere with neuron synapses, while tau tangles block the transport of nutrients inside the neurons, impairing proper functioning and ultimately leading to cell death [Scheltens, 2016]. So far clinical trials have failed to develop a disease-modifying therapy in patients diagnosed with dementia [Wolters, 2018], thereby promoting the focus towards the presymptomatic phase of the disease. Hence, two types of biomarkers are currently needed: 1) biomarkers for a cost-effective screening phase that help to identify individuals at risk, and/or at early stages of the disease; and 2) biomarkers specific of late disease stages to monitor disease evolution.
In this context, studies such as the Alzheimer’s disease neuroimaging initiative (ADNI) [Mueller, 2005], have been established in order to identify useful biomarkers. The core biomarkers defining AD are related to tau and amyloid aggregation [Jack, 2013]. These
biomarkers can be obtained from biofluids, such as cerebrospinal fluid (CSF), or from positron-emission tomography (PET) images. Both methods provide similar informa-tion accurately reflecting AD-specific pathogenic events [Olsson, 2016; Hansson, 2018; Mattsson, 2014]. Moreover, other biomarkers non-specific of AD have been identified related to neurodegeneration and cognitive decline, such as brain morphological changes or reduced glucose metabolic activity [Jack, 2018]. However, these biomarkers reflect late disease stages. Concerning early onset biomarkers, only genetic risk factors have been identified [Broce, 2019; Wolters, 2018]. This is a major inconvenience for clinical routine practice and for clinical trials, since selecting participants based on relatively rare genetic variants could render results less applicable to the large population at risk.
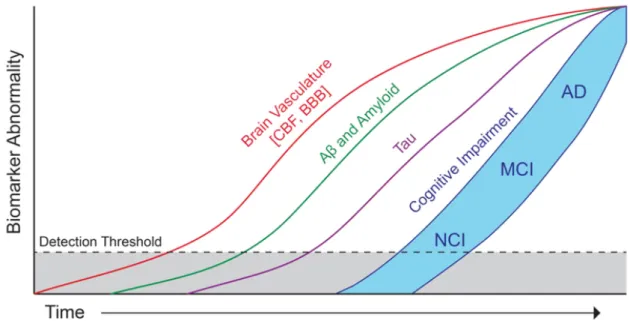
Nevertheless, there is increased evidence from clinical and pathological studies that AD often co-occurs with the presence of a vascular component that contributes to accelerate cognitive decline [Kapasi, 2017]. Microinfarcts, microbleeds or strokes among other cerebrovascular events have been associated to neurodegeneration [Veldsman, 2020], and the resulting cognitive effects are generally defined with the term vascular cognitive impairment (VCI) [Dichgans, 2017]. Moreover, multiple epidemiological and general population studies, such as the UK Biobank [Sudlow, 2015], the Framingham Study [Feinleib, 1975] or the Rotterdam study [Hofman, 2015], have identified several risk factors for dementia, such as midlife hypertension, obesity, smoking or diabetes, which are shared with cardiovascular diseases, such as heart failure (HF) [Doehner, 2018] or atrial fibrillation (AF) [Diener, 2019; Sepehri Shamloo, 2020]. Interestingly, a number of the dementia-associated cardiovascular risk factors are potentially modifiable and are already targeted to prevent cardiovascular diseases in developed countries. This could be related to the fact that in industrialised countries the prevalence of dementia has reduced by about 20% per decade since 1970s [Satizabal, 2016; Matthews, 2016; Schrijvers, 2012]. Nevertheless, this will not be enough to compensate for the rapid ageing of the population. Clinical evidence suggests that abnormal alterations in cardiovascular risk factors and vascular biomarkers may be detectable before neurodegenerative markers, such as brain morphological changes [Friedman, 2014; Lane, 2019], as well as abnormal biomarkers specific of AD [Iturria-Medina, 2016]. According to these findings, the disease evolution timeline may manifest early vascular anomalies prior to brain morphological alterations (Figure 1.1) [Sweeney, 2018]. However, clinical trials aimed at reducing the incidence of dementia based on cardiovascular risk factors have not shown positive results [Wolters, 2018]. These outcomes illustrate that better than assess effects on cognition, we need to understand the underlying physiological pathways connecting cardiovascular diseases and cognitive impairment. This could help to slow down cognitive decline and delay or prevent the onset of dementia.
Neurodegeneration has been linked to microvasculature dysfunction and small vessel disease (SVD), which denotes common abnormalities associated to microvessel damages seen on brain imaging [Wardlaw, 2019], such as white-matter hyperintensities (WMHs)
Fig. 1.1.: Hypothetical model of Alzheimer’s disease biomarkers including brain vasculature changes. Early cerebral blood flow (CBF) and brain-blood-barrier (BBB) dysfunction may contribute to initial stages of Alzheimer’s disease progression. Mainly from no cognitive impairment (NCI) to mild-cognitive impairment (MCI). Reprint with authorization from [Sweeney, 2018].
[Wardlaw, 2015]. In the case of WMHs, these abnormalities have been associated to cognitive decline [Debette, 2010] and abnormal blood pressure [Gupta, 2018; Moroni, 2018]. While the exact etiology of WMHs is unknown, it is believed that they may have a vascular origin and have been linked to capillary transient time heterogeneity (CTH), which takes place when there is a mismatch between capillary flow and oxygen delivery [Østergaard, 2013]. CTH is associated to endothelial dysfunction, which hampers cerebrovascular reactivity, affecting the ability of arterioles and capillaries to modify their radii in response to neuronal activity and direct blood flow where needed. Hypotheses behind the source of microvascular damage point to the increase of arterial stiffness with age and/or pathologies such as hypertension [ORourke, 2007]. This increased stiffness decreases the attenuation of pressure oscillations. Thus, the capillary bed receives a pulsatile flow instead of a steady-flow. This may increase stress on the capillary endothelial wall and trigger neuronal damage [Stone, 2015; Toth, 2017]. Moreover, carotid arterial stiffness is negatively associated with cerebral blood flow in older adults [Tomoto, 2021]. In turn, cerebral hypoperfusion has been associated with accelerated cognitive decline and increased risk of dementia in the general population [Wolters, 2017]. Impaired blood flow has also been associated with increased levels of neuronal oxidative stress, resulting in cerebral inflammation, that can also lead to vascular damage [Iadecola, 2013; Wolters, 2018]. Moreover, the pulsatility in cerebral arteries is thought to be involved in the brain waste clearance process through the regulation of CSF circulation and the flow in perivascular spaces of the brain [Wardlaw, 2020]. However, this process is not yet well understood and is currently focus of active research [Agarwal, 2021; Mestre, 2020].
At the same time, the brain can regulate the cardiac function altering heart’s contractility or heart rate depending on its perfusion needs. However, stiffening of the arteries affects cardiovascular coupling; the decreased elasticity of the main arteries rises the systolic pressure, which in turn forces the heart to increase its contractility or heart rate in order to supply the same amount of blood. Therefore, a prolonged hypertension may result in cardiac remodelling processes such as left-ventricular hypertrophy, which has been associated to a lower brain volume [Patel, 2017] and a higher burden of WMHs [Ryu, 2014]. Moreover, reduced cardiac output and brain blood flow were also associated to greater WMHs burden [Jefferson, 2009; Bahrani, 2017]. Hence, impaired cardiac function may result in impaired brain perfusion, and may explain the relationship between heart failure (HF) [Doehner, 2018] or atrial fibrillation (AF) [Diener, 2019; Sepehri Shamloo, 2020] with cognitive decline. However, due to the tight relationship between heart and brain through numerous physiological feedback mechanisms, it is difficult to elucidate which mechanism initiates the pathological cycle. Moreover, the lack of datasets combining joint heart and brain information in neurodegenerative disease hampers their joint study.
This context motivated recent initiatives such as the Heart-Brain study [Hooghiemstra, 2017], in which researchers seek to quantify the haemodynamic status of the heart and of the brain through image-derived biomarkers, assessing their contributions to vascular cognitive impairment by means of statistical association analysis. In this study it has been reported that a substantial number of patients with HF and carotid occlusive disease (COD) present cognitive impairment [Hooghiemstra, 2019]. However, in opposition to [Wolters, 2017], an association between reduced cerebral blood flow (CBF) and decreased cognitive function has not been found [Leeuwis, 2020].
1.2
Methodological context
As introduced in the previous section, epidemiological datasets contain multimodal patient-specific data, and allowed to identify several risk factors shared between cardio-vascular diseases and dementia. Moreover, these datasets open the door to study diverse phenotypes, based for example on imaging, genomics and demographic data. Therefore, a number of hypotheses can be tested, such as the association between cardiovascular risk factors and brain imaging features [Cox, 2019] or the association between lifestyle and genetic risk factors with dementia [Lourida, 2019]. Most of these hypotheses are tested through standard statistical tools such as univariate or multivariate regression analysis and survival analysis models.
There are two main drawbacks associated to the current analyses: 1) the heterogeneity of the epidemiological datasets limits the number of subjects diagnosed with a
neurodegen-erative disease and disease-specific biomarkers, such as PET imaging or CSF measures are scarce; 2) while statistical association analysis allows to easily formulate and test association hypotheses, it offers a limited interpretation of the complex relationship between organs.
Hence, we need computational tools making full use of the large-scale biological informa-tion available in epidemiological datasets to obtain models that allow us to extrapolate the learned associations from these datasets to clinical and disease specific cohorts. To achieve that, we need deeper physiological and biomechanical insights than the ones ob-tained from pure association analysis. In this context, mechanistic and biophysical models represent an opportunity to introduce physiological knowledge in the links between the available measurements.
Biophysical models allow to estimate in-silico biomarkers representing physiological properties that cannot be measured in-vivo, such as the contractility or the stiffness of the heart fibres. These models allow for example to describe the brain vasculature, and to quantify physiological aspects such as blood flow auto-regulation effects in the brain [Acosta, 2018], or the simulation of the whole-body circulation with detailed compartmental components [Blanco, 2015]. Recently, mechanistic approaches have been used to study the effect of atrial fibrillation (AF) in brain perfusion and determined that the loss of periodicity in the AF beat-series may lead to a higher occurrence of hypoperfuse and hypertense events in the distal regions of the cerebrovascular circulation (arterioles and capillaries) [Scarsoglio, 2017]. Additionally, Aghilinejad et al. [Aghilinejad, 2020] determined that the stiffening of the aorta relative to the carotid arteries increased the pulsatility of blood flow in the brain vasculature, leading to increased microvascular damage. However, although these approaches offer a high level of interpretability, their personalisation is not trivial.
Personalising a cardiovascular model for a given subject implies solving an inverse problem to estimate the model parameters such that the generated simulations are as close as possible to the available clinical data. This problem is usually severely ill-posed and requires large data samples and arrays of measurements to opportunely tune their parameters. Several approaches have been proposed for cardiac-related inverse problems. When sequential data is available, it is common to rely on filtering methods such as the unscented Kalman filter (UKF) [Pant, 2017], that correct the model based on the discrepancy between upcoming input data and model’s prediction. Other options involve data-driven approaches such as reinforcement learning [Neumann, 2016], gradient-based solutions based on the adjoint method [Delingette, 2012] or gradient-free approaches such as genetic algorithms [Khalil, 2006]. Moreover, in the case of high-order biophysical models, such as 3D models, these methods are computationally expensive. Thus, multi-fidelity approaches, based on evolutionary algorithms [Molléro, 2017] or
filtering methods [Pant, 2014], have been used to combine the computational efficiency of reduced-order models with the accuracy of higher-order models.
Nevertheless, personalisation is commonly carried out at most in tens or a few hundreds of subjects [Molléro, 2018]. Hence, those approaches are typically oriented towards obtaining solutions that mimic the observed clinical features but they do not prioritise obtaining homogeneous solutions in groups of subjects. Therefore, a large variability between solutions in similar subjects can be found. This hampers the significance and conclusions drawn from statistical association analyses that include the estimated cardiac model parameters.
Thus, approaches allowing to bridge the gap between statistical association analysis and personalised mechanistic models have the potential to give insights impossible to obtain through standard statistical analysis, thanks to the estimation of non-measurable physiological properties. In turn, the mechanistic constraints introduced in these models can help to extrapolate the knowledge learned in large-scale population studies to pathological studies where cardiac data is limited but there is a rich set of disease-specific biomarkers.
1.3
Objectives and organisation of the thesis
In this thesis we explore the use of personalised biophysical models as a method to introduce prior knowledge of the cardiac function in the analysis of heart-brain interac-tions through their internal dynamics. We hypothesise that these models could allow to obtain early biomarkers with the potential to identify individuals at risk of dementia. In particular, we investigate the following research questions:
• How can we obtain comparable population-wise estimations of cardiovascular model parameters, and use them to analyse the heart-brain interaction?
• How can we study the interplay between cardiac function and brain imaging markers in disease-specific datasets with limited cardiac information?
• What is the potential of biophysical model parameters as non-specific biomarkers to identify individuals at risk of dementia?
In Chapter 2, we give an introduction of the heart electromechanical behaviour, the brain anatomy and their physiological relationship, relating the cardiac physiological properties to the model parameters used in our work.
InChapter 3, we investigate how to incorporate prior knowledge encoded in a biophysi-cal model to study the relationships between brain and cardiac function. We tackle the problem of obtaining a population-wise homogeneous solution in an ill-posed setting and how the use of external information, such as brain imaging data, aids to simplify the problem. Moreover, we demonstrate the potential of our approach by assessing differences in a pathological subgroup diagnosed with atrial fibrillation (AF).
InChapter 4, we present a framework that allows to infer the parameters of a biophysical cardiovascular model from incomplete brain-specific datasets, using the heart-brain dynamics learned in a large-scale complete cohort, the UK Biobank. The parameters of the cardiovascular model are obtained using the personalisation approach presented in Chapter 3. We show how the developed imputation framework allows to accurately impute the missing information and simulate the evolution of the model parameters as brain features change.
InChapter 5, we explore the potential of the biophysical model parameters as biomarkers to identify population at risk of dementia. Leveraging on the tools described in Chapter 3 and 4, we can infer the missing cardiac information in a longitudinal study focused on Alzheimer’s disease, ADNI. Next, we use disease progression modelling to estimate the disease stage of every subject based on the evolution of their biomarkers. This allows to study the role of cardiac function in relation to brain morphological changes and cognitive scores during disease progression. The obtained results show that abnormal alterations in cardiovascular biomarkers take place before alterations in other biomarkers associated to neurodegeneration. The results are in-line with hypothetical disease evolution timelines proposed previously [Sweeney, 2018].
InChapter 6, potential future work and perspectives are discussed.
InAppendix, we present ongoing work aimed to study the influence of cardiac function in the cerebrospinal fluid (CSF) flow. We introduce our implementation of a compu-tational fluid dynamics (CFD) solver based on the lattice Boltzmann method (LBM), and preliminary results based on the processing of quantitative flow images of CSF and carotid blood flow.
1.4
Publications and software packages
The described contributions led to the following peer-reviewed publications:
Journal articles
• Banus J., Lorenzi M., Camara O., Sermesant M. Biophysics-based Statistical Learn-ing: Application to Heart and Brain Interactions. In MedIA (in reviews)
• Banus J., Sermesant M., Camara O., Lorenzi M. Alzheimer’s Disease Progression Model including Heart & Brain (in preparation)
Conference articles
• Banus J., Sermesant M., Camara O., Lorenzi M. (2020) Joint Data Imputation and Mechanistic Modelling for Simulating Heart-Brain Interactions in Incomplete Datasets. In: Martel A.L. et al. (eds) Medical Image Computing and Computer Assisted Intervention – MICCAI 2020. MICCAI 2020.
• Yang Y., Gillon S., Banus J., Moceri P., Sermesant M. (2020) Non-invasive Pressure Estimation in Patients with Pulmonary Arterial Hypertension: Data-Driven or Model-Based?. In: Pop M. et al. (eds) Statistical Atlases and Computational Models of the Heart. Multi-Sequence CMR Segmentation, CRT-EPiggy and LV Full Quantification Challenges. STACOM 2019.
• Banus J., Lorenzi M., Camara O., Sermesant M. (2019) Large Scale Cardiovascular Model Personalisation for Mechanistic Analysis of Heart and Brain Interactions. In: Coudière Y., Ozenne V., Vigmond E., Zemzemi N. (eds) Functional Imaging and Modeling of the Heart. FIMH 2019.
Software packages
• Imputation framework: https://gitlab.inria.fr/epione/hdcob.git
1.5
Data availability
UK Biobank data are available through a procedure described at http://www.ukbiobank. ac.uk/using-the-resource/. ADNI data are publicly available at http://adni.loni.
usc.edu/. The exact number of samples currently available in both datasets may differ slightly from those described in this thesis.
1.6
Code availability
The source code for the imputation model is publicly available at https://gitlab. inria.fr/epione/hdcob/, and for the disease progression model at https://gitlab. inria.fr/epione/GP_progression_model_V2/.
2
Heart & Brain: Physiological
Relationship
Contents
2.1 The Heart . . . 13
2.2 Vascular system . . . 18
2.3 The Brain . . . 24
2.4 CSF circulation and waste clearance . . . 27
2.5 Heart & Brain Relationship . . . 30
A deep in-detail physiological analysis of both organs is out of the scope of this thesis. However, we would like to provide an overview of the most important concepts and knowledge required to understand the basis of the heart-brain relationship, the role of the parameters of the personalised biophysical model, and the conclusions drawn from the results obtained at the different chapters. Most information and concepts illustrated in this chapter come from cardiovascular physiology [Herring, 2018; Sevre, 2015; Prabhakar, 2020; Pappano, 2013] and neuroanatomy books [Vanderah, 2015]. However, papers tackling controversial and ongoing research topics are cited when needed.
2.1
The Heart
The heart is a viscoelastic muscular organ whose main function is to periodically pump the blood throughout the circulatory system. It can be divided in two pumping systems in series, the right and the left side, each with two separate chambers, a ventricle and an atrium. The left side receives oxygenated blood from the lungs and pumps it to the rest of the body (systemic circulation). The right side receives deoxygenated blood and pumps it to the lungs, where it exchanges CO2 for O2 (pulmonary circulation).
The heart is made of three tissue layers, the epicardium, myocardium and endocardium. The endocardium is the layer in the inner surface of the chambers, it is comprised mainly of endothelial cells over connective tissue. The epicardium is the outermost layer, it is a visceral layer made of mesothelial cells, adipose and connective tissue, it cushions the heart and nerves and blood vessels are located in it. At the roots of the great vessels
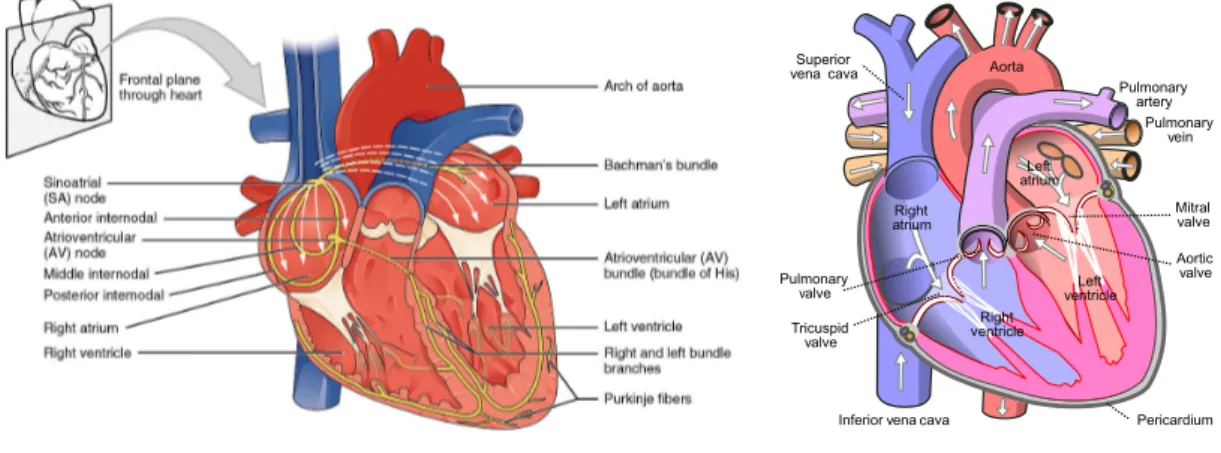
(a)Conduction system (b)Anatomy and flow direction
Fig. 2.1.: Diagrams of the human heart a) Heart conduction system, represented in yellow. It
in-cludes the sinoatrial node (SA),the atrioventricular (AV) node and Purkinje fibres. The white arrows indicate the propagation of the depolarization induced by the SA; image from https://commons.wikimedia.org/ b) Main aspects of the heart anatomy, the white arrows indicate the blood flow direction; image from https://commons.wikimedia.org/. Details are available in the text.
it reflects back and continuous to form the pericardial sac, filled with pericardial fluid that prevents friction during heart contractions. In between, we find the myocardium, it is a muscle layer composed of cardiomyocytes that enables the contraction of the heart. It is the thickest layer, being thicker in the ventricles than in the atria, due to the higher pressures generated in the ventricles. The myocytes of the ventricles are organised primarily in a circumferential orientation, originating from the base of the heart (near the aortic orifice) and sweeping towards the apex, they gradually undergo a 180-degree change where fibres vary transmurally from approximately -70 in the epicardium to +80 degrees in the endocardium. When they contract they twist and shorten longitudinally, with the base descending towards the apex. Moreover, the heart has a system of valves structurally designed to allow flow in only one direction, the valves passively open and close in response to the direction of the pressure gradient across them. There are two types of valves in the heart: the atrioventricular valves that regulate the flow from the atrium to the ventricles, and the semilunar valves, that regulate the flow from the ventricles to the arteries.
The contraction of the myocardium is caused by a multi-scale physical phenomena, known asexcitation-contraction coupling process whose basic unit is the sarcomere. The sarcomeres are composed of long, fibrous proteins. The two main proteins are the myosin and the actin, which form the thick and thin filaments respectively. The myosin head binds to the actin active sites forming a cross-bridge, this allows the myosin head to ’pull’ the actin along its length, this generates a power stroke, forcing the actin to slide along the myosin filament. The myosin-actin interactions are mediated mainly by calcium and ATP. The phosphorylation of ATP gives the energy to the myosin heads, and the concentration of calcium determines the number of active actin binding sites. In our
work, the mechanistic modelling of the excitation-contraction coupling is done using the Bestel-Clement-Sorine (BCS) model. An important parameter of the model is σ0, which
represents the maximum contraction strength generated by the sarcomere. The model is described in detail in Section 3.3.1.1.
The cascade of events inducing the calcium release inside the cardiomyocytes is initiated by a membrane depolarization that triggers an action potential in the cell, which is dependent on the electrochemical gradients of sodium, potassium and calcium. However, as opposite to the skeletal muscle, the cardiac cells do not need an external stimulus. Cer-tain cardiomyocytes have the ability to fire action potential spontaneously (automaticity) at a regular frequency (rhythmicity). They act like pacemakers controlling the heartbeat frequency. There are three regions that have this ability: the sinoatrial node (SA), the atrioventricular (AV) node and the bundle of his/Purkinje. Usually, the SA node controls the heartbeat, and the AV creates a delay between the atrium contraction and the ven-tricle to ensure proper ventricular filling. However, if the SA node fails the other nodes can take over. The action potential generated in these nodes propagates through the gap junctions that exist in the borders between myocardial fibres, in contact with each other longitudinally. Thus, the cardiac impulses progress more rapidly in a direction parallel to the long axes of the fibres. The cardiac depolarisation is modelled in our work using Equation 3.11, which links the fraction of the ventricle that is depolarised to the BCS model, by determinig the relaxation and contraction rates of the sarcomere.
The sequence of electrical changes, pressures, and mechanical events within the heart during each beat is known as the cardiac cycle. Each cycle has two periods, diastole and systole. During diastole the heart muscle relaxes and refills with blood, then during systole the heart ventricles contract and blood is pumped towards the arteries. Moreover, each cycle can be divided in four stages based on the positions of the inlet and outlet valves:
• Ventricular filling: The AV valves are open, the ventricles are in diastole, and initially also the atria. Thus, blood flows passively from the superior and inferior vena cava through the relaxed atria and into the ventricles. At the end of the phase there is the atrial systole, atrial kick, which pumps extra blood into the ventricle. The volume of blood in the ventricle at the end of this phase is called end-diastolic volume (EDV).
• Isovolumetric contraction: The ventricle starts to contract, as soon as the pressure rises above the atrial pressure the AV valves are closed and ventricular pressure rises quickly. The maximum rate of rise of pressure dP/dt is often used as an index of contractility.
(a)Pressure-volume loop (b)Wiggers diagram
Fig. 2.2.: a) Pressure-volume (PV) loop: it represents the changes in left ventricular pressure
and volume throughout the cardiac cycle. Diastolic filling starts at A when the mitral valve opens and terminates at B, when the mitral valve closes. With isovolumetric contraction there is a steep rise in pressure and no change in ventricular volume. At C, the aortic valve opens, and ejection begins. During the first phase of ejection, rapid ejection, there is a continued but less steep increase in ventricular pressure. This is followed by reduced ejection and a small decrease in ventricular pressure. When it falls below the aortic pressure the aortic valve closes, D, and isovolumetric relaxation takes place, characterized by a sharp drop in pressure and no change in volume. The mitral valve opens again to complete one cardiac cycle. b) Wiggers diagram: in this diagram the cardiac cycle is often represented as beginning midway through diastole, the top row shows the pressure temporal profile for the left ventricle (LVP), the left atrium (LAP) and the aorta (AP). The bottom row, shows the evolution of the left ventricle volume and the ECG signal; LVEDV, left ventricle end-diastolic volume; LVESV, left ventricle end-systolic volume. Images from https://www.cvphysiology.com/
• Ventricular ejection: When ventricular pressure becomes higher than the atrial pressure (afterload), the semilunar valves are pushed open and the blood is ejected into the arteries. Initially the blood is ejected faster than it can drain away through the peripheral vessels, (rapid ejection phase), and most of the blood is accommodated temporally in the distended elastic arteries. Later, the ejection rate slows down and pressure begins to fall, when if falls below the arterial pressure a brief backflow closes the valve, the closure creates a notch in the arterial pressure trace, called the incisura. For the rest of the cycle the arterial pressure decays gradually towards its diastolic minimum. The ejected volume is known as stroke volume (SV), and the residual volume in the ventricle is the end-systolic volume (ESV). The proportion, SV/EDV, is the ejection fraction (EF).
• Isovolumetric relaxation: The relaxing myocardium causes the ventricular pressure to fall rapidly, when it falls below atrial pressure the pressure gradient opens the AV valves, and the ventricular filling begins.
In our work, Equation 3.7 is used to model the phases of the cardiac cycle by linking the ventricular blood flow to the atrial, ventricular and arterial pressures.
The examination of the relationship between pressure and volume in the heart during each cardiac cycle reflects the properties and conditions of the myocardial cells and pro-vides a haemodynamic characterisation of the heart. For example, during the ventricular filling the pressure increases due to the stretching of the ventricle induced by the blood volume. Overall, the resulting relationship between pressure and volume reflects the length-tension relationship of the ventricular cells. As can be seen in Figure 2.2b, from A to B the pressure-volume curve in diastole is initially quite flat (compliant), indicating that large increases in volume can be accommodated with only small rises in pressure. The ventricle becomes much less distensible with greater filling, as evidenced by the sharp rise of the diastolic curve at large intraventricular volumes. This resistance to stretch of the myocardium at high filling pressures serves as a safety factor protecting against overloading of the heart in diastole. The stretching of the sarcomeres at the end of the filling determines thepreload. In our model this property is linked to the parameter C1, which determines the stiffness of the cardiac fibres, as can be seen in
Equation 3.6.
An important indicator on how the heart is meeting the body’s demands is the cardiac output (CO), which measures the volume of blood in a given minute. It is obtained multiplying the stroke volume by the heart rate (HR), i.e. the number of heartbeats per minute (bpm). In a normal individual at rest CO ranges between 4 and 6 L/min. However, in certain situations the hart may need to adapt this quantity. There are three main factors that determine CO: 1) myocardial contractility (i.e., excitation-contraction coupling processes); 2) preload; and 3) afterload. These three factors determine the strength and velocity of the myocardial contraction. The CO is regulated mainly by two systems:
• Intrinsic cardiac regulation: Based on theFrank–Starling mechanism. As we said, the stretching of the sarcomeres (preload) varies based on the volume of blood flowing into the ventricle, known asvenous return. This stretching influences the ability of the actin and myosin to form cross-bridges. Therefore, up to a certain range the contractility increases as the EDV increase, but after a given stretching it plateaus. It should also be noted that the “stretch” of the atrial wall can directly increase the rate of the SA node by 10–20 %; this also aids in the amount of blood that will ultimately be pumped per minute by the heart.
• Autonomous nervous system: Heart rate and cardiac contractility can be regulated via reflex mechanisms that involve baroreceptors and chemoreceptors that modulate the sympathetic and parasympathetic activity of the nervous system. Substantial
groupings of such baroreceptors can be found at the arch of the aorta and on the internal carotid arteries (carotid sinus). Those specifically located in the carotid help to maintain normal blood pressure in the brain, whereas those located in the area of the ascending arch of the aorta help to govern general systemic blood pressure. Baroreceptors are sensitive to the stretching of the arterial walls, which will results in changes of the firing rate of these receptors. Chemoreceptors monitor the chemical composition of blood, and are located close to the baroreceptors in small structures known as the carotid and aortic bodies. The chemoreceptors within these bodies detect changes in blood levels of O2 , CO2 , and H+. In order to
detect hypoxia (low availability of O2 ), acidosis (increased blood concentrations
of H+ ), and/or hypercapnia (high concentrations of CO
2). In response to these
receptors the central nervous system regulates the vascular tone, the release of hormones, and/or the respiratory function.
2.2
Vascular system
The blood is a non-Newtonian fluid whose viscosity depends on the haematocrit, i.e: the proportion of red cells, an increase in haematocrit increases the internal friction of blood and hence, viscosity. Nevertheless, the viscosity falls in microvessels, facilitating microvascular perfusion. The viscosity drops as flow and shear rate increase, this is called shear thinning, in blood it is attributed to the deformation and lining up of red cells along the laminar flow lines. This effect is important because it greatly reduces microvascular resistance, and therefore the arterial pressure needed to perfuse the microcirculation. The blood is distributed throughout the entire body by the vascular system, a schematic representation is available in Figure 2.3. The blood vessels can be divided in different segments based on their physiological properties:
• Main arteries: such as the aorta or the carotids, are very elastic and present a pulsatile flow. The elasticity allows them to maintain the blood pressure throughout the body. When the aorta receives the blood from the heart, it recoils and stores mechanical energy, once the ejection phase is over the distention is used to push the blood during the diastole, this is known as theWindkessel effect. Around 67%–80% of the stroke volume is temporarily stored in the elastic arteries during systole, while 20%–33% runs off through the peripheral resistance.
• The arterioles: are relatively rigid, its function is to impose a steady flow by means of a higher frictional loss. They represent most of the vascular resistance to blood flow and is where the biggest pressure drop occurs, as can be seen in Figure 2.4. Changes in the total peripheral resistance (TPR) are mostly due to changes in them. In fact, they can regulate the percentage of the total blood flow to individual organs.
Fig. 2.3.: Schematic representation of the vascular tree: we can see how most of the organs are arranged in parallel with respect to the aorta. However, some specific cases like the liver, are arranged in-series with other organs. This type of arrangement is called a portal system, and is used to transport substances from one site to another. Reprint with authorisation from [Herring, 2018].
However, individual arteriole do not usually remain relaxed or contracted for long; its muscle tone changes constantly (vasomotion), and in some tissues vasomotion has a regular rhythm.
• The capillaries: are the smallest and most numerous blood vessel resulting from the continuous branching of the vascular tree, they have a very thin wall composed of only an endothelial cell and the supporting basement membrane. The circulation broadening slows down the blood, this slow velocity in capillaries is key for the nutrients and gas exchange. The forces that drive the movement of fluid into and out of the capillaries,Starling forces, depend on the balance of hydrostatic and osmotic pressures. The hydrostatic pressure tends to push the fluid out of the capillaries, and inversely for the osmotic pressure. Hence, if the hydrostatic pressure is higher than the osmotic there is a filtration of fluid towards the interstitial space, while the opposite process, absorption, takes place when osmotic pressure is dominant. Usually both process are in equilibrium along the capillaries, i.e: there is no net flow of filtration. However, if there is a net flow it resolves into an
edema, which can be caused by changes in the hydrostatic pressure due to cardiac dysfunction.
• Venules and veins: On its return to the heart from the capillaries, blood passes through venules and then through veins of increasing size, reaching a diameter similar to the arteries but half as thick. Veins support much lower pressures, are very compliant and present a steady flow. The veins acts as a volume reservoir, and can accommodate high increases in blood volume. Contractions of the skeletal muscles aid in returning blood to the heart. The increased blood flow due to the contractions is only towards the heart due to the valves that are present within the veins. The venous pressure influences the end-diastolic volume, which as we saw in the previous section, increases stroke volume and cardiac output according to Frank-Starling’s law.
The flow of any liquid, such as the blood, can be described by the Navier-Stokes equations, which are based on the conservation of momentum (Newton’s second law), energy and mass. However, they result in a non-linear system without a general solution, except under certain assumptions and simplifications. For example, if we consider an incompressible fluid and a steady-flow along a rigid tube driven by a constant pressure, the flow Q[l/min] is proportional to the pressure drop between the inlet and outlet ∆P = P2− P1[mmHg], this proportionality will depend on how difficult it is for the
liquid to flow in the tube, the resistance to flow R[(mmHg × min)/l], and can be expressed as: Q = ∆P/R. This is calledDarcy’s law of flow, and is equivalent to Ohm’s law for the electrical flow. Hence, the bigger the resistance, the bigger the pressure needed to drive the same flow. This equation can be applied to a network of vessels, such as the vascular bed of an organ or the entire systemic circulation to obtain a general approximation. Actually, assuming axisymmetry, the flow through a cylindrical tube can be estimated by means of the Poiseuille equation, Q = π∆P r8µL4, where r[m] is the radius,
L[m]the length, and µ[kg/(m s)] the dynamic viscosity of the fluid. It is important to note that according to this equation a small change in vessel radius will have a very large influence on its resistance to flow. From these equations we can observe two points: 1) flow will only occur when a pressure difference exists, and the flow will be directed from high to lower pressure regions; 2) the diameter of the vessels is critical to the total resistance to flow. Hence, it is not surprising that arterial blood pressure is principally regulated by controlling the radii of the vessels within a given tissue or organ system.
The analogy between Darcy’s and Ohm’s law, can be extended, referring to it more generally of the electronic–hydraulic analogy. By using it, the pressure difference is equivalent to the voltage difference, the blood flow to the current flow, and the compliance of the vessels is equivalent to a capacitor. Indeed, the Windkessel effect that takes place in the main arteries can be emulated by an RC circuit [Shi, 2011]. Therefore,
(a)
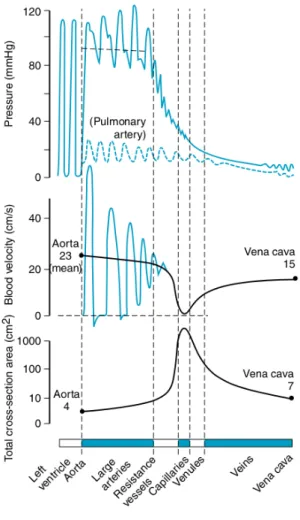
Fig. 2.4.: The top row shows the pressure oscillations along the vascular tree for the systemic
(solid line) and pulmonary circulation (dashed line). We can see how the pressure oscillations, as well as the pressure itself, decrease downward the vascular tree, being the biggest drop at arterioles level. The bottom row shows the total cross-sectional area, we can see how initially it increases from the main arteries to the capillaries, and then it decreases as venules converge to veins. Moreover, we can see how cross-sectional area is a mirror image of the blood flow velocity. Reprint with authorisation from [Herring, 2018].
we can see the vascular system as many blood vessels arranged in series and parallel with respect to the heart, and we can use Kirchhoff’s circuit laws to derive the equivalent properties, as we did for our haemodynamic model in Equation 3.10. In general the systemic circulation is divided into specialized, individual circuits, each supplying a specialized tissue or organ, with the arterial supply coming from the aorta. Thus, forming a parallel arrangement. Considering each organ as a resistance, all the elements in parallel experience the same driving pressure. Hence, this arrangement of the vascular system allows to regulate the flow through each organ independently without greatly affecting the total flow or blood pressure.
(a)Pulse pressure propagation (b)Effect of stiffening in pressure oscillations
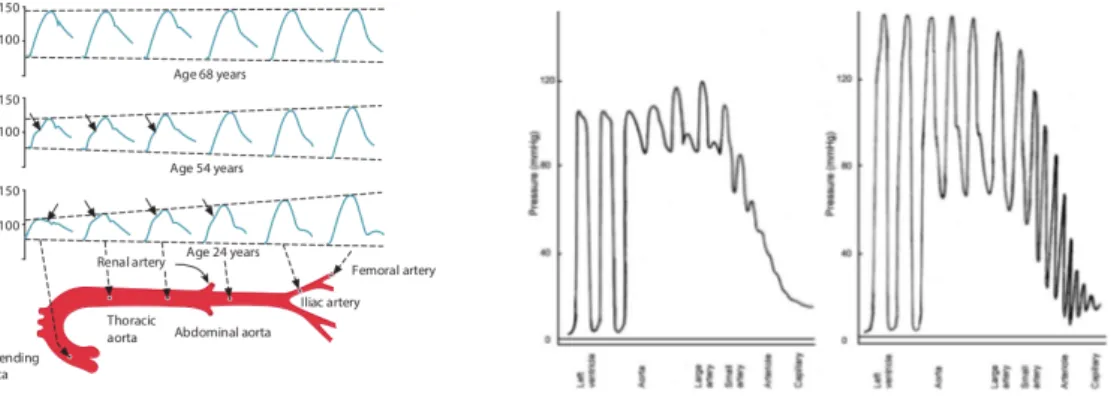
Fig. 2.5.: a) Pulse pressure wave propagation along the main arteries, reflection, refraction, and
interference distort the pressure waveform. In young people it causes an additional diastolic wave in the proximal aorta and an exaggeration of systolic and pulse pressures in the distal arteries. Arrows show systolic inflection, marking the arrival of the reflected wave. Reprint with authorisation from [Herring, 2018] b) Effect of arterial stiffening in the attenuation of pulse pressure. Due to the increased stiffening of the arteries the pulsatile flow is transmitted to the microvasculature. Reprint with authorisation from [ORourke, 2007].
However, the electronic-hydraulic analogy fails to capture spatio-temporal effects such as the ones due to pressure wave propagation [Shi, 2011]. If arteries had rigid walls, blood pressure would rise virtually instantaneously throughout the arterial system during systole. However, arteries are not rigid, so the proximal pressure rise takes a finite time to spread to distal arteries. The pressure pulse travels at around 4–5 m/s in young people, and 10–15 m/s in older people, much faster than the blood velocity ( 0.2 m/s) in the ascending aorta. The pulse transmission is due to the ejected blood into the proximal aorta pushing to create space and initiating a chain reaction downwards. However, due to the peripheral resistance the amount of ejected blood is more than the one displaced. Hence, the additional blood distends the proximal aorta, which raises the blood pressure. As the displaced blood moves forwards it does partly distend the wall downstream (which raises the pressure there) and partly by displacing the blood ahead. This sequence repeats itself in rapid succession along the arterial tree. The pulse is thus transmitted by a wave of wall distension at 4–15 m/s. Since pulse propagation involves wall deformation, the stiffness of the wall affects the transmission velocity and transmission velocity increases with wall stiffness. The effect of this stiffening in the pressure oscillations along the vascular tree is visible In Figure 2.5b. Moreover, depending on the wall stiffness the pressure wave in a human proximal artery may show two additional features, namely a
diastolic wave or a systolic inflection.
At low propagation velocities the decay of pressure in diastole is interrupted by a transient rise in pressure, called a diastolic or dicrotic wave, caused by wave reflection. This is not present at higher propagation velocities, in which the reflected wave returns to the proximal arteries in time to interact with the initiating wave, as can be seen in
(a)
Fig. 2.6.: Summary of the regulatory mechanisms of the mean blood pressure, which depends
on cardiac output (CO) and total peripheral resistance (TPR). Cardiac output depends on a complexity of numerous factors including: preload, contractility, afterload and heart rate. Peripheral resistance is equally complex and controlled by many additional factors including vasomotor tone of arterioles, metabolic activity, and response to blood flow by what is know as myogenic response, which modulates the arterial radii to compensate for pressure changes. Reprint with authorisation from [Herring, 2018].
Figure 2.5a. Thus the reflected wave is added to the late part of the systolic wave, raising the peak systolic pressure and creating a kink or flexion in the systolic wave. Reflected waves are important because they affect cardiac performance. The slow return of the reflected wave augments the diastolic pressure, which boosts coronary artery perfusion. By contrast, the early return of the reflected wave increases systolic pressure (systolic pressure augmentation). Therefore, the left ventricle must eject blood against an increased afterload, which increases cardiac work and O2 demand.
Sometimes, these propagation effects must be accounted for to calculate the mean blood pressure (MBP). The MBP has an important clinical significance due to its close relation-ship to tissue perfusion. The two major determinants of MBP are cardiac output and total peripheral resistance, which regulate it through numerous physiological feedback mechanisms, as can be seen in Figure 2.6. However, in routine clinical practice only systolic and diastolic pressures are measured, not the complete pulse pressure waveform,
and usually in the brachial artery rather than aorta. In the aorta, mean pressure is approximately halfway between systolic and diastolic pressures; thus it can be obtained as M BP = (SBP + DBP )/2. Nevertheless, in the brachial artery the narrowing of the systolic peak, caused by distal transmission, shifts the time-averaged mean in the diastolic direction and the mean pressure is approximated as: M BP = SBP + (2 ∗ DBP )/3.
2.3
The Brain
(a)Brain outside-in vascularisation (b)Main arteries of the brain vascular tree
(c)Schematic of the vascular wall, from the large brain arteries until the capillaries
Fig. 2.7.: a) Brain outside-in vascularisation pattern. Arterioles penetrate the brain parenchyma
from the pial arteries branching from the large arteries arising from the Circle of Willis. Reprint with authorisation from [Iadecola, 2017] b) Main arteries providing the blood supply to the brain. Details in the text. Image from www.joeniekrofoundation.com/ c ) Schematic of the vascular wall anatomy from the large brain arteries to the capillaries. It can be seen that the perivascular spaces disappear at the arterioles and that the pericytes together with the endothelial cells give rise to the blood-brain barrier (BBB). Further details in the text. Reprint with authorisation from [Iadecola, 2013]
The brain is contained within the skull and is covered by three membranous layers, the meninges. From external to internal the meninges include the dura, arachnoid, and pia mater. The arachnoid and the pia are known as leptomeninges, or “thin” meninges, and the space between them is the subarachnoid space (SAS), which is filled with
cerebrospinal fluid (CSF). Many large blood vessels travel in the SAS and trabeculae (strings or sheets of leptomeningeal cells) cross the SAS connecting the arachnoid and pia. Beneath the pia lies the brain.
The brain can be divided in multiple cortical and subcortical structures. However, more generally it can be differentiated in two main tissues, grey matter (GM) and white matter (WM). Grey matter contains numerous cell bodies and relatively few myelinated axons, while white matter contains relatively few cell bodies and is composed mainly of long-range myelinated axons. Hence, white mater modulates the distribution of action potentials, coordinating communication between different brain regions. While, the human brain ( 1.5 kg) forms only 2% of the total body mass it receives 14% of the cardiac output and accounts for nearly 20% of resting O2 consumption. Most of the
blood goes to the grey matter (40% of brain mass), which has a very high basal blood flow, 100 mL/min/100g, 10 times the whole-body average and the double of the whole brain average, 55 mL/min/100g. Because of its high metabolic activity, grey matter is highly sensitive to hypoxia (deprivation of O2); consciousness is lost after a few seconds
of cerebral ischaemia, and irreversible neuronal damage follows within 4 min. Therefore, the primary task of the cerebral circulation is to maintain O2 delivery at all costs.
The brain receives its blood supply from two paired arteries: the vertebral arteries, and the internal carotid arteries. These arteries arise in the neck, and ascend to the cranium, as can be seen in Figure 2.7b. The internal carotid arteries branch to form two major cerebral arteries, the anterior and middle cerebral arteries. The right and left vertebral arteries come together at the level of the pons on the ventral surface of the brainstem to form the basilar artery. The confluence of the internal carotid arteries and the basilar artery at the base of the brain forms an anastomotic circle, the Circle of Willis, which presumably improves the chances of any region of the brain to receive blood if one of the major arteries becomes occluded. From the Circle of Willis branches arise which supply the majority of the cerebrum. The main vessels arising from the circle of Wills form a dense, anastomotic network on the brain surface (pial arteries and arterioles), illustrated in Figure 2.7a. Pial arterial branches penetrate into the brain, giving rise to smaller arterioles surrounded by an extension of the subarachnoid space filled with CSF, the perivascular space or Virchow-Robin space, delimited by the vascular basement membrane and the basement membrane of the glia limitans [Dyrna, 2013; Mastorakos, 2019]. The perivascular space has emerged as critically important for removal of waste and unwanted proteins and peptides such as Aβ [Iliff, 2013; Bakker, 2016; Wardlaw, 2020]. These spaces disappear as intracerebral arterioles reach deeper into the brain parenchyma and become smaller (diameter <100 µm), as seen in Figure 2.7c. Then, as we reach the capillary level, vessel’s basement membrane enters in direct contact with the glial basement membrane and give rise to the blood-brain-barrier (BBB). The capillary endothelial cells and pericytes interact with astrocytes, oligodendrocytes and microglia, to form together theneurovascular unit. The neurovascular unit is involved