HAL Id: hal-00620707
https://hal.archives-ouvertes.fr/hal-00620707
Submitted on 8 Sep 2011
HAL is a multi-disciplinary open access archive for the deposit and dissemination of sci-entific research documents, whether they are pub-lished or not. The documents may come from teaching and research institutions in France or abroad, or from public or private research centers.
L’archive ouverte pluridisciplinaire HAL, est destinée au dépôt et à la diffusion de documents scientifiques de niveau recherche, publiés ou non, émanant des établissements d’enseignement et de recherche français ou étrangers, des laboratoires publics ou privés.
A solid-state NMR study of C70: a model molecule for
amorphous carbons
M. Deschamps, S. Cadars, E. Gilbert, P. Azaïs, E. Raymundo-Pinero, F.
Béguin, D. Massiot
To cite this version:
M. Deschamps, S. Cadars, E. Gilbert, P. Azaïs, E. Raymundo-Pinero, et al.. A solid-state NMR study of C70: a model molecule for amorphous carbons. Solid State Nuclear Magnetic Resonance, Elsevier, 2012, 42, pp.81-86. �10.1016/j.ssnmr.2012.01.001�. �hal-00620707�
A solidstate NMR study of C
70: a model molecule
for amorphous carbons.
Michaël Deschamps,1,2 Sylvian Cadars,1,2 Edouard Gilbert,2,3 Philippe Azaïs,4 Encarnacion Raymundo‐Pinero,2,3 François Béguin,2,3 Dominique Massiot1,2
1 CNRS‐CEMHTI, UPR 3079, 1D Avenue de la Recherche Scientifique, 45071 Orléans cedex 2, France. 2 Département de Chimie, Université d’Orléans, Avenue du Parc Floral, BP 6749, 45067 Orléans cedex 2, France 3 CNRS‐CRMD, 1B rue de la Férollerie, 45071 Orléans cedex 2, France 4 Batscap, Odet Ergué Gabéric, 29556 Quimper cedex 9, France
Submitted to Solid‐State NMR, special issue
Date: Friday, September 2, 2011
Abstract We show that natural abundance, solid‐state MAS‐NMR 13C INADEQUATE spectra can be recorded for crystallized C70, using the through‐bond J‐coupling for the magnetization transfer. The effect of strong Jcoupling can be lessened at high magnetic fields, allowing the observation of cross‐peaks between close resonances. DFT calculations of the chemical shifts show an excellent agreement with the experimental values. A correlation is observed between the average CCC bond angles and the 13C chemical shift, offering a way to understand the dispersion of 13C chemical shifts in nanoporous activated carbons in terms of local deviations from planarity. IntroductionElectrochemical double‐layer capacitors are made of porous carbon electrodes containing an electrolyte. Upon charging, the electronic charges are stored on the carbon electrode surface while the electrolyte structure is reorganized to maintain local electroneutrality.
The carbon materials used for the electrodes, including materials originating from biomass, such as coconut shells, have been shown to have a large impact on the energy and power densities, which can be obtained in supercapacitors. Recent research using more sophisticated materials such as curved graphene sheets1,2,3,4 or nanotubes5,6,7,8 have shown that these carbon structures can be used as electrode materials and provide very promising strategies for the electrochemical storage of energy.
However, little is known concerning the interplay between the carbon atomic structure and the repartition of electronic charges on the carbon surface. The molecules of the fullerenes family may be interesting models for the understanding of more complicated carbon structures. First, it has been shown that the charge distribution in C706‐ is not uniform and is concentrated near the poles of the C70 molecule (Figure 1A) and the presence of electronic charges mainly affects five‐ members rings.9 Second, the 13C chemical shifts have been shown to depend upon the local curvature of the fullerene molecule10,11 and upon the local charge density when anions9 or cations12 are considered.
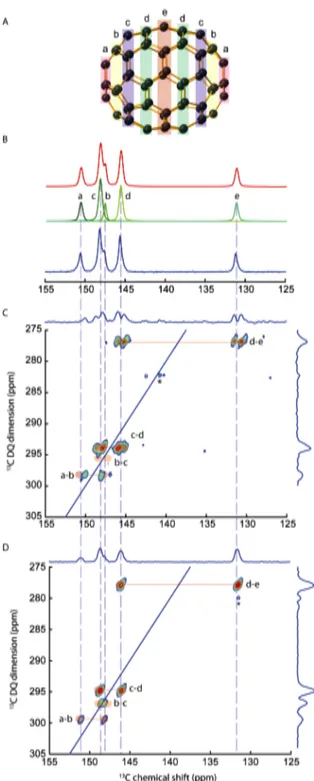
Figure 1. A: C70 molecule showing the five classes of
equivalent carbon atoms in the room‐temperature structure where C70 rotates along one of the
symmetry axis. B: 1D quantitative 13C solid‐state NMR
spectrum of C70 (blue), recorded at 7 T, with the 5
corresponding resonances (green) and the resulting model (red). The results of the fit are shown in Table S2 of the Supplementary Material section. C: Double‐ Quantum/Single‐Quantum natural abundance 13C
refocused INADEQUATE spectrum recorded at 7T, showing the expected pairs of cross‐peaks (red) and the missing pair b‐c, which vanishes because of the strong coupling effect (the J‐coupling and the chemical shift difference between the coupled spins are of the same order). The star (*) indicates zero‐quantum (ZQ) artifacts. D: the same spectrum, recorded at 20 T, showing all the expected pairs of cross‐peaks,
including the b‐c cross‐peaks. Again, ZQ artifacts are observed (*).
In order to assign the 13C NMR resonances of fullerenes, INADEQUATE spectra have been recorded using 13C‐ enriched samples since the low 13C natural abundance (1.07%) makes the probability of finding naturally occurring 13C‐13C pairs quite low.13,9 Otherwise, ab initio calculations have been performed to assign the observed lines in 13C, 3He or 7Li NMR.14,15 NMR has also been used for the characterization of more complicated molecules of the same family such as C80.16 To probe the magnetic properties of fullerene molecules, 3He NMR on He@C70 complexes where the He atoms are located inside the C7017,18 has been successfully used, while the surface properties have been characterized using 1H and 13C NMR of surface groups grafted on reduced C70 molecules.19 Crystallized solvated C70 molecules have also been studied by solid‐state NMR using 1H‐13C cross‐polarization to enhance the 13C signal.20 In the solid‐ state, pure C70 molecules have been shown to rotate freely around their symmetry axis at room temperature using longitudinal relaxation (T1) and Chemical Shift Anisotropy (CSA) considerations.21
In this paper, we show for the first time that naturalabundance 13C INADEQUATE solid‐state NMR spectra can be recorded for C70 samples, using the J‐couplings between naturally occurring 13C‐13C pairs for magnetization transfer. The 2D INADEQUATE can be recorded at “low” magnetic fields (7 T or 300 MHz for 1H) where the line widths are narrower (in Hz) and the J‐splittings can be resolved. However, the T1 values are longer at low fields, and the strong Jcoupling effect between two close resonances additionally leads to vanishing cross‐ peaks.22 At higher magnetic fields (20 T
or 850 MHz for 1H), the Boltzmann population difference is enhanced, the longitudinal relaxation is faster, and the
strong Jcoupling effects are lessened
even if the broader line widths (in Hz) preclude the direct observation of J‐ splittings.
The 13C chemical shifts can be calculated using a DFT approach. The calculated values show an excellent agreement with the experimental measurements. The 13C chemical shifts of these carbons (experimental and calculated) are shown to correlate with the average bond angles with the three neighboring carbons. The presence of a broad contribution between 140 and 160 ppm in the 13C NMR spectra of nanoporous amorphous activated carbons can be explained by the presence of carbon atoms with smaller CCC angles in regions of higher carbon surface curvatures.
Experimental NMR
The solid C70 powder have been purchased from Sigma‐Aldrich and used as is, without further purification. The supercapacitor electrode was provided by Batscap and was obtained from carbonized and activated coconut shell, with a PVDF binder and carbon black additive for conductivity. The carbon powders have been placed in a 4 mm Bruker ZrO2 rotor. The NMR spectra have been obtained with Bruker NMR spectrometers operating at 7 and 20 T, corresponding to Larmor frequencies of 75.5 and 213.8 MHz for 13C (300 and 850 MHz for 1H), using Magic Angle Spinning (MAS) rates of 10.000 and 14.286 kHz in Bruker double resonance MAS‐NMR probes. The 13C chemical shifts are referenced to TMS at 0 ppm. The longitudinal relaxation times for C70 have been found to range between 2.6 and 2.9 s at 7 T, and 1.6 to 2 s at 20 T. The recovery delays have been set to 5xT1 for the quantitative 1D spectra and 3 and 2.4 s to obtain the best signal‐to‐
noise ratio in the INADEQUATE spectra. The 1D 13C MAS‐NMR spectrum of the supercapacitor electrode was recorded with a recovery delay of 60 s (due to the slower longitudinal relaxation of PVDF, compared to T1 ≤ 5 s for the disordered nanoporous carbon). The 90° excitation pulses have been performed using B1 RF fields of 68 and 50 kHz respectively, and trains of eight 90° pulses 20 ms apart were used for presaturation. The INADEQUATE spectra were recorded using a refocused INADEQUATE sequence, followed by a 20 ms Z‐filter to obtain a pure phase spectrum.23 2048 transients have been recorded for each natural‐abundance 13C INADEQUATE, using conversion and reconversion delays of 8.2 ms (≈1/2J) to allow for the build‐up of antiphase magnetization considering that 2J(13C‐13C) ≈ 60 Hz. In the indirect dimension, spectral widths of 2000 and 7143 Hz have been recorded using 100 and 50 increments at 7 and 20 T, respectively. The experiments lasted 7 and 3 days, respectively. Single component baseline corrections and exponential broadenings of 20 and 100 Hz have been applied on the INADEQUATE spectra in both dimensions. The 1D spectra and the INADEQUATE slices have been fitted and/or extracted using the dmfit software.24 The simulations showing the
strong Jcoupling effects were performed
using SPINEVOLUTION.25 DFT
First principles calculations with periodic boundary conditions were achieved using the CASTEP code,26,27 which relies on a plane‐wave‐based density functional theory (DFT) approach. The electron correlation effects are modeled using the Perdew‐ Burke‐Ernzerhof (PBE) generalized gradient approximation (GGA).28 For geometry optimizations we employed a planewave cut‐off energy of 450 eV and the default “ultrasoft”29 pseudo‐
potentials of CASTEP 5.5 (described in Supporting Information, Table S1). Convergence thresholds were set to 10‐5 eV/atom for the total energy, 3.10‐2 eV/Å for the maximum ionic force, and 10‐3 Å for the maximum ionic displacement. Weak non‐bonding forces, which are generally absent in DFT calculations and yet crucial in the description of π‐π interactions, for example, were accounted for here by the damped atom‐pairwise semi‐empirical dispersion corrections of Tkatchenko and Scheffler.30 The NMR calculations were performed using the Gauge Including Projector Augmented Wave approach (GIPAW),31,32 at the same cut‐ off energy of 450 eV.
The crystal structure of C70 was previously determined by diffraction.33 For gas‐phase calculations on isolated C70, one of the four C70 molecules was put in a cell of 15x15x15 Å3 to avoid inter‐molecular interactions, with a 2x2x2 Monkhorst‐Pack (MP) grid34 to sample the Brillouin zone. The solid‐ state calculations were conducted with and without the symmetries of the Pbmn (#62) space group, with unit cell parameters a = 10.016 Å, b = 17.349 Å, c = 18.530 Å, and α = β = γ = 90° kept fixed during geometry optimizations, and a 2x1x1 MP grid. An internal reference was used to calculate chemical shifts using the expression δcalc = σref ‐ σcalc + δref, where σref is the average of all calculated shieldings for a given calculation, and δref the corresponding average of all experimental 13C shifts of C70 (weighed by populations) with respect to TMS.
Results and discussion
Although the low‐temperature XRD structure of crystallized C70 shows 40 inequivalent sites,33 rotation about the polar axis21 at room temperature reduces the number of inequivalent sites to five, with populations in a 1:1:2:2:1
ratio. These sites are labeled from a to e and the lines were first assigned using the local curvature and the population ratio.10 The assignment has been confirmed with a 13C liquid‐state NMR 2D refocused INADEQUATE recorded on isotopically enriched C70.13 The C70 molecule with the a‐e sites and the quantitative 1D 13C MAS‐NMR spectrum are shown in Figure 1. The results from the fits are provided in Table S2. The longitudinal relaxation time constants (T1) are rather small for these compounds (between 1.5 and 3s) and become smaller with increasing B0 strength. This is expected given the large chemical shift anisotropies (CSA) calculated by DFT (190 ppm) for the (static) low‐temperature Pbmn structure and the comparatively small values (30‐50 ppm) measured at room temperature, where C70 molecules undergo free rotation around the polar axis.21 CSA fluctuations are thus expected to be the main source of relaxation,21 which are consequently more efficient at higher magnetic fields. It is possible as a result to directly record a natural‐abundance 13C spectrum in a short time without cross‐ polarization for C70.
No 1H or paramagnetic defect is found in the crystallized C70 samples. The loss of coherence is consequently slow (long T2), no decoupling is needed, and MAS easily removes the CSA sidebands and is expected to quench any undesired cross‐ term.35 The J‐coupling between adjacent 13C spins, around 60 Hz,13 is then sufficient to mediate the creation of antiphase coherences between chemically bound 13C pairs and thus to allow acquisition of J‐mediated correlation experiments. The optimum refocused INADEQUATE signal was found for conversion and reconversion delays of 8.2 ms before and after the double‐quantum evolution time, which is equal to the theoretical optimum of
1/(2J), as expected for comparatively long T2.
The 2D refocused INADEQUATE spectra recorded at 7 and 20 T are shown in Figure 1C and D. For the first time, these spectra were recorded using non‐ enriched C70 samples. Whereas a few examples of 13C‐13C correlation spectra collected at natural abundance in the solid state have been reported36 (most of which with the refocused INADEQUATE experiment), this is also the first example using direct 13C excitation rather than the 13C{1H} cross‐ polarization (CP) classically employed in organic solids. The spectrum obtained at 7 T shows three pairs of cross‐peaks, a‐ b, c‐d and d‐e. The b‐c pair of cross‐ peaks is missing because the frequency separation of b and c (40 Hz) remains too small as compared to the J‐coupling (60 Hz) inducing strong Jcoupling
effects, i.e. the J‐coupling Hamiltonian
(2πJIS) cannot be reduced to 2πJIzSz.22,37
In such a case, antiphase terms are not created, and simulations performed with SPINEVOLUTION confirm this result.25 The line widths (≈ 40 Hz) of the 13C lines are small enough to allow direct observation of the 2J(13C‐13C) splitting, as illustrated in the corresponding slices (Figure 2). The SPINEVOLUTION simulations accurately reproduce the distortion of the multiplets stemming from the strong Jcoupling effect (“roof” effect, shown in Figure 2).
To observe the missing b‐c cross‐peaks, the frequency separation between b and c lines (in Hz) must be increased, which is easily achieved by using a stronger B0 field. At 20 T, the frequency separation between b and c (113 Hz) becomes large enough to observe the b‐c cross‐peaks in the 2D INADEQUATE spectrum (Figure 1D). However, the line widths (resulting from the interplay of J‐splitting and chemical shift distribution stemming from structural disorder) become larger (≈ 150 Hz full width at half maximum,
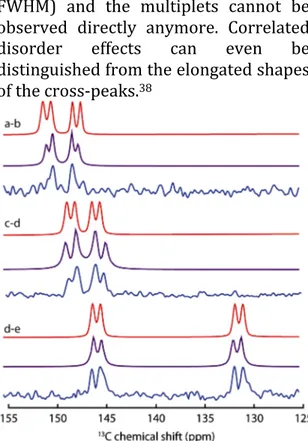
FWHM) and the multiplets cannot be observed directly anymore. Correlated disorder effects can even be distinguished from the elongated shapes of the cross‐peaks.38
Figure 2. 1D slices of the refocused 13C INADEQUATE
spectrum of C70 obtained at 7T (blue), for each
observed pair of cross‐peaks (a‐b, c‐d and d‐e). The b‐ c pair is not observed because of the strong coupling effect as the spectral separation between b and c (40Hz) becomes small and interferes with the J‐ coupling (≈ 60 Hz). The theoretical spectra with no strong J‐coupling effect are shown in red (obtained with dmfit24) and the simulated spectra obtained with SPINEVOLUTION25 are shown in purple to
illustrate the “roof” effect resulting from the strong J‐ coupling.
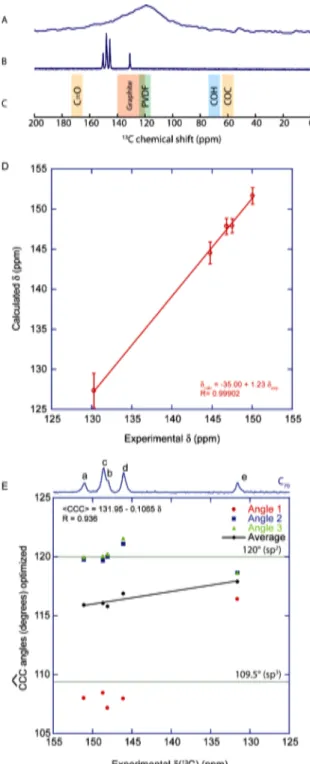
The main interest behind studying C70 lies in its ability to mimic on a small scale the expected structure of nanoporous carbons.39,40 The 13C MAS‐ NMR spectrum of a supercapacitor electrode made with a nanoporous carbon is compared to the C70 MAS‐NMR spectrum in Figure 3. The expected chemical shifts of commonly found moieties are also represented. In the nanoporous carbon, the signals appearing between 140‐160 ppm does not correspond to commonly found chemical groups and therefore may indicate sp2 carbons with stronger curvatures, as seen in the C70 NMR spectrum.
Figure 3. 13C MAS‐NMR spectra of a supercapacitor
electrode (A) and solid‐state C70 (B) with the expected
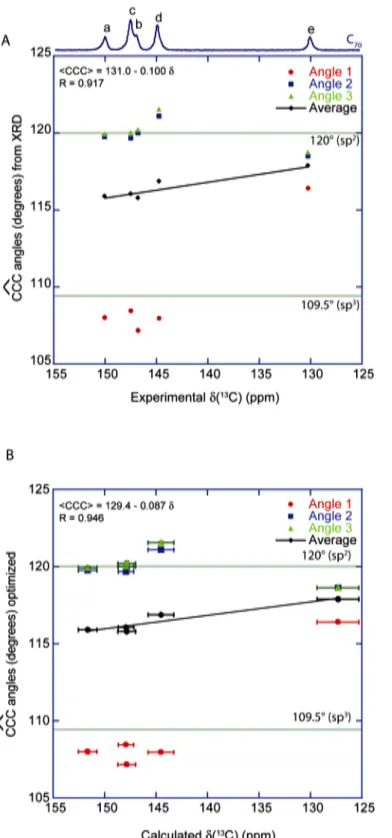
chemical shift ranges for the commonly found chemical entities (C). , D: Plot of the 13C chemical
shifts calculated by DFT (obtained with the low‐ temperature Pbmn structure, in which the C70
molecules do not rotate, as opposed to the room‐ temperature behavior21) vs the experimentally
measured 13C shifts. We assumed that the C70 rotation
averaged the chemical shifts in each class of a‐e atoms, and the error bars represent the standard deviations observed for each set of calculated chemical shifts. E: Plot of the three CCC angles obtained from the DFT‐optimized structure and their average as a function of the experimental 13C chemical
shifts measured for C70. The error bars correspond to
the standard deviations for each set of angles. The
green lines indicate the CCC bond angles obtained for sp2 carbons (120°) and sp3 carbons (109.5°).
To understand the origins in terms of local structure of the chemical shift variations in C70, the chemical shifts have also been calculated with DFT. Three cases have been considered: isolated C70 molecules and crystalline C70 with and without the symmetries of the original Pbmn space group of the low‐temperature structure. Although the solid‐state calculations provide slightly better agreement with the experimental values, the three calculations methods provided chemical shifts with strong linear correlation to the experimental values. Systematic deviations from the perfect 1:1 correlation are not unusual for DFT calculations of NMR parameters. They are most probably accounted for by approximations of the exchange‐ correlation functional and, in the presence case, by the comparison of a static model and a strongly dynamic experimental system. The results are provided in the supplementary materials section (Table S3). The values obtained with the immobile C70 molecules in the Pbmn structure have been averaged to reproduce the effect of the molecular rotation about the polar axis. The resulting values are shown in Figure 3, and the standard deviations of the calculated shifts for each type of 13C site are plotted as error bars thus reflecting the spread in chemical shifts expected when the C70 rotation is stopped. One can see that the linear correlation is excellent, with R=0.9990, showing that the DFT calculations are perfectly able to offer an alternate way to assign the 13C resonances. Interestingly, the average shifts calculated for each type of site do not significantly differ when the C70 molecule is considered in isolation (see Supplementary Material, Table S3). The spread of calculated values for each 13C
site, in contrast, varies considerably between the isolated molecule and the solid‐state model. Specifically, calculated shifts are virtually identical of every atom of a given type in isolated C70 (standard deviations of 0.01 to 0.03 ppm, see Table S3) and are substantially distributed for crystalline C70 with and without symmetry (standard deviations of 0.8 to 2.0 ppm). This result clearly indicates that the spread of calculated 13C shifts for static crystalline C70 is entirely due to inter‐molecular effects due to ring currents induced by the magnetic field in adjacent C70 molecules. At ambient temperature, fast rotation of the molecules is expected to reduce these effects to zero.
Translating the observed chemical shift values into simple geometric considerations is more difficult, but important trends can nevertheless be obtained based on the combination of experimental NMR and diffraction data and DFT calculations.As shown in Figure 3E, for each carbon in C70, the three CCC bond angles (obtained from the DFT‐ optimized structure) can be divided into two groups: two large angles with values close to 120°, which correspond to the typical angles observed for sp2 carbons, and one smaller angle, close to 109°, which is close to the CCC angle observed for sp3 carbons. Therefore, we may expect activated carbons to have similar behaviors for the CCC bond angles, where the curvature of graphene layer is achieved with similar bond angles variations by including five‐members rings among the network of 6‐members rings.
The best linear correlation we found was between the average of the three CCC angles and the 13C chemical shift of the carbon atom in the center. The correlation obtained between the experimental shifts and the CCC angles obtained from XRD, CCC = 131.0 ‐ 0.100 δ, is quite good (R = 0.916, see Figure
S4A from the Supplementary Materials). Furthermore, this correlation improves with the angles obtained from the DFT‐ optimized structure: CCC = 131.95 ‐ 0.1065 δ, with R = 0.936 (Figure 3E). It is a common finding that, for crystal structures obtained with powder diffraction rather than on single crystals, the precision of atomic positions, and ‐as a result‐ of calculated NMR parameters, can be significantly improved by a DFT minimization with fixed unit cell parameters41. In this case the variations in atomic positions between the powder XRD and the DFT‐optimized structure are small (RMSD of 0.051 Å), but nevertheless sufficient to improve the trend between experimental NMR results and structural features. Finally, further improvement of the correlation is obtained when considering calculated rather than experimental chemical shifts and the average CCC angles from the DFT‐optimized structure: CCC = 129.4 ‐ 0.087 δ, with R = 0.946 (Figure S4B from the Supplementary Materials). This improvement may be primarily due to a compensation of small residual errors on the atomic positions as minimized by DFT. In the three cases, some discrepancies are observed and must result from other effects which have not been accounted for. Nonetheless, using this linear correlation, one can assume that the chemical shift range between 120 and 160 ppm corresponds to average CCC angles between 119.2 and 114.9°. It is also interesting to notice that the deviation from the planar sp2 carbons found in C70 remains quite small, with only one angle expected to deviate significantly from 120°.
Conclusion
Carbon materials are now used in supercapacitors, graphite electrodes in batteries, and hybrid systems, “supercapattery”, try to take advantage of the best of the two worlds. Therefore,
with nanotubes, graphene and graphite oxide, elaborated carbon compounds have a bright future ahead in the search for better energy storage strategies. In this paper, we show that natural abundance 13C correlation spectra can be recorded owing to the short longitudinal relaxation times of 13C in C70. A similar effect may be expected in some of the more complex carbon materials, either because of the CSA induced relaxation, or due to the presence of paramagnetic centers. Moreover, experimental chemical shifts
can be reproduced with a reasonable accuracy using DFT, and the 13C chemical shift may be translated in terms of average CCC bond angles, offering a plausible interpretation of the 13C MAS‐NMR spectra of activated carbons in terms of deviations of graphene layers from planarity.
Acknowledgements
For DFT calculations, we thank the “Centre de Calcul Scientifique en region Centre” (Orléans, France).
Supplementary materials
Table S1. Description of pseudopotential used for planewavebased DFT calculations.
Atom Corestates Local channel rloc
(a.u.) rnonloc (a.u.) raug (a.u.) Pseudopotential projectors PAW projectors C 1s D 1.4 1.4 1.3 2x2s, 2x2p 2x2s, 2x2p
Where rloc is the pseudisation radius for the local component of the pseudopotential,
rnonloc is the pseudisation radius for the non‐local components of the pseudopotential,
and raug is the pseudisation radius for the charge augmentation functions.
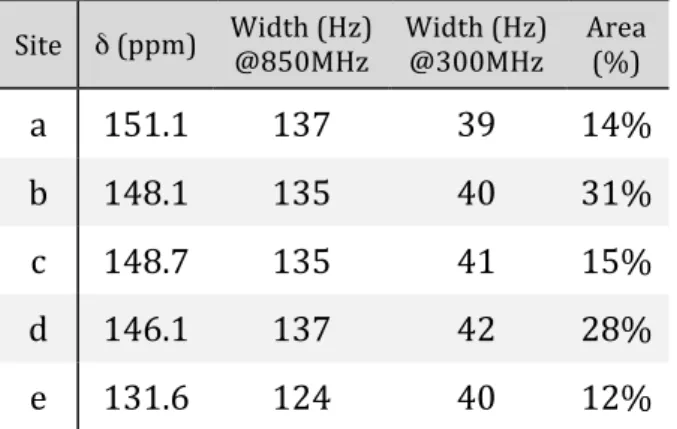
The corresponding castep on‐the‐fly string used to generate these potentials is: C 2|1.4|1.4|1.3|6|10|12|20:21(qc=6) Table S2. Results from the fit of the 1D NMR spectra.
Site δ (ppm) Width (Hz) @850MHz Width (Hz) @300MHz Area (%)
a 151.1 137 39 14% b 148.1 135 40 31% c 148.7 135 41 15% d 146.1 137 42 28% e 131.6 124 40 12% Table S3. Chemical shifts obtained by DFT. Site Average δ (ppm) Isolated C70 StDev (ppm) Isolated C70 Average δ (ppm) P1 C70 StDev (ppm) P1 C70 Average δ (ppm) Pbmn C70 StDev (ppm) Pbmn C70 Multiplicity a 151.58 0.02 151.64 0.87 151.65 0.89 10 b 146.61 0.01 147.85 0.86 147.85 0.86 10 c 148.25 0.02 147.93 0.74 147.92 0.75 20 d 145.13 0.03 144.52 1.26 144.52 1.25 20 e 126.79 0.02 127.31 2.02 127.32 2.03 10
Figure S4. A: Plot of the three CCC angles obtained from the XRD structure and their
average as a function of the experimental 13C chemical shifts measured for C70. The green lines indicate the CCC bond angles obtained for sp2 carbons (120°) and sp3 carbons (109.5°). B: Same graph with the 13C chemical shifts calculated with the DFT. The horizontal error bars correspond to the standard deviations for each set of chemical shifts from the a‐e sites. The vertical bars are very small and correspond to the standard deviations obtained for each set of CCC angles.
References
1 C.Liu, Z.Yu, D.Neff, A.Zhamu, B.Z.Jang, « Graphene‐Based Supercapacitor with an Ultrahigh Energy
Density », Nano Lett. 10, 4863–4868 (2010)
2 Y.Zhu, S.Murali, M.D.Stoller, K.J.Ganesh, W.Cai, P.J.Ferreira, A.Pirkle, R.M.Wallace, K.A.Cychosz,
M.Thommes, D.Su, E.A.Stach, R.S.Ruoff, « Carbon‐Based Supercapacitors Produced by Activation of Graphene », Science 332, 1537‐1541 (2011).
3 J.J.Yoo, K.Balakrishnan, J.Huang, V.Meunier, B.G.Sumpter, A.Srivastava, M.Conway, A.Leela Mohana Reddy,
J.Yu, R.Vajtai, P.M.Ajayan, « Ultrathin Planar Graphene Supercapacitors », NanoLet. 11, 1423‐1427 (2011).
4 J.R.Miller, R.A.Outlaw, B.C.Holloway, « Graphene Double‐Layer Capacitor with ac Line‐Filtering
Performance », Science 329, 1637 (2010).
5 C.Niu, E.K.Sichel, R.Hoch, D.Moy, H.Tennent, « High power electrochemical capacitors based on carbon
nanotube electrodes », Appl. Phys. Lett. 70, 1480 (1997).
6 E.Frackowiak, K.Metenier, V.Bertagna, F.Béguin, « Supercapacitor electrodes from multiwalled carbon
nanotubes », Appl. Phys. Lett. 77, 2421 (2000).
7 D.N.Futaba, K.Hata, T.Yamada, T.Hiraoka, Y.Hayamizu, Y.Kakudate, O.Tanaike, H.Hatori, M.Yumura,
S.Iijima, « Shape‐engineerable and highly densely packed single‐walled carbon nanotubes and their application as supercapacitor electrodes », Nature Mater. 5, 987 ‐ 994 (2006).
8 A.Izadi‐Najafabadi, S.Yasuda, K.Kobashi, T.Yamada, D.N.Futaba, H.Hatori, M.Yumura, S.Iijima, K.Hata,
« Extracting the Full Potential of Single‐Walled Carbon Nanotubes as Durable Supercapacitor Electrodes Operable at 4 V with High Power and Energy Density », Advanced Mater. 22, E235 (2010).
9 T.Sternfeld, R.E.Hoffman, I.Aprahamian, M.Rabinovitz, « Fullerene anions: Unusual charge distribution in
C706‐. » Angew. Chem. Int. Ed. 40, 455‐457 (2001).
10 R.Taylor, J.P.Hare, A.K.Abdul‐Sada, H.W.Kroto, « Isolation, Separation and Characterisation of the
Fullerenes C60 and C70: The Third Form of Carbon », Chem. Commun., 1423 (1990).
11 R.C.Haddon, « Chemistry of the Fullerenes: The Manifestation of Strain in a Class of Continuous
Aromatic Molecules », Science 261, 1545‐1550 (1993).
12 C.A.Reed, K.‐C.Kim, R.D.Bolskar, L.J.Mueller, « Taming Superacids: Stabilization of the Fullerene Cations
HC60+ and C60.+ », Science 289, 101 (2000).
13 R.D.Johnson, G.Meijer, J.R.Salem, D.S.Bethune, « 2D Nuclear Magnetic Resonance Study of the Structure
of the Fullerene C70 », J. Am. Chem. Soc. 113, 3619‐3621 (1991).
14 M.Bühl, W.Thiel, H.Jiao, P.von Ragué Schleyer, M.Saunders, F.A.L.Anet, « Helium and Lithium NMR
Chemical Shifts of Endohedral Fullerene Compounds: An ab Initio Study »
J. Am. Chem. Soc. 116, 6005‐6006 (1994).
15 M.S.Meier, H.P.Spielmann, R.G.Bergosh, R.C.Haddon, "A 13C INADEQUATE and HF‐GIAO Study of C60H2
and C60H6 Identification of Ring Currents in a 1,2‐Dihydrofullerene", J. Am. Chem. Soc. 124, 8090‐8094
(2002).
16 F.H.Hennrich, R.H.Michel, A.Fischer, S.Richard‐Schneider, S.Gilb, M.M.Kappes, D.Fuchs, M.Bürk,
K.Kobayashi, S.Nagase, « Isolation and Characterization of C80 », Angew. Chem. Int. Ed. 35, 1732‐1734
(1996).
17 M.Saunders, H.A.Jiménez‐Vázquez, R.J.Cross, S.Mroczkowski, D.I.Freedberg, F.A.L.Anet, « Probing the
interior of fullerenes by 3He NMR spectroscopy of endohedral 3He@C60 and 3He@C70 », Nature 367, 256‐
258 (1994).
18 T.Sternfeld, M.Saunders, R.J.Cross, M.Rabinovitz, « The Inside Story of Fullerene Anions: A 3He NMR
Aromaticity Probe », Angew. Chem. Int. Ed. 42, 3136 – 3139 (2003).
19 T.Sternfeld, R.E.Hoffman, C.Thilgen, F.Diederich, M.Rabinovitz, « Reduction of Fulleroids C71H2: Probing
the Magnetic Properties of C706‐ », J. Am. Chem. Soc. 122, 9038‐9039 (2000).
20 W.Kolodziejski, J.Klinowski, « 13C‐1H and 1H‐13C cross‐polarization NMR in toluene‐solvated fullerene‐
70 », Chem. Phys. Lett. 247, 507‐509 (1995). 21 L.Firtej, Z.Belahmer, P.Bernier, A.Zahab, M.Ribet, N.Coustel, R.Aznar, « Molecular Motion in Solid C70 by 13C High‐Resolution NMR », Solid State Commun. 87, 669‐673 (1993). 22 A.Bax, R.Freeman, “Investigation of 13C‐ 13C Couplings in Natural Abundance Samples: The Strong Coupling Case”, J. Magn. Reson. 41, 507‐511 (1980). 23 (a) C.A. Fyfe, H. Grondey, Y. Feng, G.T. Kokotailo, “Natural‐Abundance 2‐Dimensional 29Si MAS NMR investigation of the 3‐dimensional bonding connectivities in the zeolite catalyst ZSM‐5”, J. Am. Chem. Soc. 112, 8812–8820 (1990), (b) A. Lesage, C. Auger, S. Caldarelli, L. Emsley, “Determination of through‐bond carbon‐carbon connectivities in solid‐state NMR using the INADEQUATE experiment”, J. Am. Chem. Soc. 119, 7867–7868 (1997).
24 D.Massiot, F.Fayon, M.Capron, I.King, S.Le Calvé, B.Alonso, J.O.Durand, B.Bujoli, Z.Gan, G.Hoatson,
“Modelling one and two‐dimensional solid‐state NMR spectra”, Magn. Reson. Chem. 40, 70‐76 (2002). 25 M.Veshtort, R.G.Griffin, “SPINEVOLUTION: A powerful tool for the simulation of solid and liquid state NMR experiments”, J. Magn. Reson. 178, 248‐282 (2006). 26 M.D.Segall, P.J.D.Lindan, M.J.Probert, C.J.Pickard, P.J.Hasnip, S.J.Clark, M.C.Payne, « First‐principles simulation: ideas, illustrations and the CASTEP code », J. Phys.: Condens. Matter 14, 2717‐ 2744 (2002). 27 S.J.Clark, M.D.Segall, C.J.Pickard, P.J.Hasnip, M.J.Probert, K.Refson, M.C.Payne, « First principles methods using CASTEP », Z. Kristallogr. 220, 567‐570 (2005). 28 J.P.Perdew, K.Burke, M.Ernzerhof, « Generalized Gradient Approximation Made Simple », Phys. Rev. Lett. 77, 3865‐3868 (1996). 29 D.Vanderbilt, « Soft self‐consistent pseudopotentials in a generalized eigenvalue formalism », Phys. Rev. B 41, 7892‐7895 (1990).
30 A.Tkatchenko, M.Scheffler, « Accurate Molecular Van Der Waals Interactions from Ground‐State
Electron Density and Free‐Atom Reference Data », Phys. Rev. Lett. 102, 073005 (2009).
31 C.J.Pickard, F.Mauri, «All‐electron magnetic response with pseudopotentials: NMR chemical shifts »,
Phys. Rev. B 63, 245101 (2001).
32 J.R.Yates, C.J.Pickard, F.Mauri, « Calculation of NMR chemical shifts for extended systems using ultrasoft
pseudopotentials », Phys. Rev. B 76, 024401 (2007).
33 S.van Smaalen, V.Petricek, J.L.de Boer, M.Dusek, M.A.Verheijen, G.Meijer, « Low‐temperature structure of
solid C70 », Chem. Phys. Lett. 223, 323‐328 (1994).
34 H.J.Monkhorst, J.D.Pack, « Special points for Brillouin‐zone integrations », Phys. Rev. B 13, 5188‐5192
(1976). 35 F.Fayon, D.Massiot, M.H.Levitt, J.J.Titman, D.H.Gregory, L.Duma, L.Emsley, S.P.Brown, “Through‐space contributions to two‐dimensional double‐quantum J correlation NMR spectra of magic‐angle‐spinning solids”, J. Chem. Phys. 122, 194313 (2005). 36 (a) R.A.Olsen, J.Struppe,D.W.Elliott, R.J.Thomas, L.J.Mueller,”Through‐Bond 13C−13C Correlation at the Natural Abundance Level: Refining Dynamic Regions in the Crystal Structure of Vitamin‐D3 with Solid‐ State NMR”, J. Am. Chem. Soc. 125, 11784‐11785 (2003) ; (b) H.Kono, T.Erata, M.Takai, “Determination of the Through‐Bond Carbon−Carbon and Carbon−Proton Connectivities of the Native Celluloses in the Solid State”, Macromolecules 36, 5131‐5138 (2003); (c) G. De Paëpe, A.Lesage, S.Steuernagel, L.Emsley, “Transverse dephasing optimised NMR spectroscopy in solids: Natural‐abundance 13C correlation spectra”, ChemPhysChem 5, 869‐875 (2004) ; (d) R.K.Harris, S.A.Joyce, C.J.Pickard, S.Cadars, L.Emsley, “Assigning carbon‐13 NMR spectra to crystal structures by the INADEQUATE pulse sequence and first principles computation: a case study of two forms of testosterone”, Phys. Chem. Chem. Phys. 8, 137‐143 (2006) ; (e) R.K.Harris, S.Cadars, L.Emsley, J.R.Yates, C.J.Pickard, R.K.R.Jetti, U.J.Griesser, “NMR crystallography of oxybuprocaine hydrochloride, Modification II”, Phys. Chem. Chem. Phys. 9, 360 – 368 (2007). 37 M.H.Levitt, “Spin Dynamics. Basics of Nuclear Magnetic Resonance.”, Wiley, Chichester, England (2001). 38 S.Cadars, A.Lesage, L.Emsley, "Chemical Shift Correlations in Disordered Solids", J. Am. Chem. Soc. 127, 4466‐4476 (2005). 39 P.J.F.Harris, “New Perspectives on the Structure of Graphitic Carbons”, Critical Reviews in Solid State and Materials Sciences 30, 235 (2005). 40 A.Kumar, R.F.Lobo, N.J.Wagner, “Porous amorphous carbon models from periodic Gaussian chains of amorphous polymers”, Carbon 43, 3099‐3111 (2005). 41 R.K. Harris, P. Hodgkinson, C.J. Pickard, J.R. Yates, V. Zorin, “Chemical shift computations on a crystallographic basis: some reflections and comments”, Magn. Reson. Chem. 45, S174‐S186 (2007).