similarity indices analyses (CoMFA and CoMSIA) of
N-Phenyl-N'-(2-chloroethyl)urea targeting the colchicine-binding site as
anticancer agents
Sébastien Fortina,b, *, Philippe Labriea,b, Emmanuel Moreauc, Lianhu Weid,e, Lakshmi P. Kotrad,e, René C.-Gaudreaulta.
aUnité des Biotechnologies et de Bioingéniérie, Centre de recherche, C.H.U.Q., Hôpital Saint-François d’Assise, Université Laval, Québec, Que., Canada, G1L 3L5 bFaculté de Pharmacie, Université Laval, Pavillon Vandry, Québec, Que., Canada, G1K
7P4
cUniversité Clermont 1, UFR Pharmacie, Laboratoire de Chimie Organique, Clermont-Ferrand, F-63001, France
dDepartments of Pharmaceutical Sciences and Chemistry, University of Toronto, Toronto, Ont., Canada, M5S 2S2
eCenter for Molecular Design and Preformulations, Toronto General Research Institute, University Health Network, Toronto, Ont., Canada, M5G 1L7
*Corresponding author. Phone: (418) 656-2131x7989. Fax: 418 525-4372. E-mail:
Abstract
To decipher the mechanism underlying the covalent binding of N-phenyl-N'-(2-chloroethyl)urea (CEU) to the colchicine-binding site on II-tubulin and to design new and selective antimitotic drugs, we developed 3D quantitative structure-activity relationships (3D-QSAR) models using CoMFA and CoMSIA analyses. The present study correlates the cell growth inhibition activities of 56 structurally related CEU derivatives to several physicochemical parameters representing steric, electrostatic, and hydrophobic fields. Both CoMFA and CoMSIA models using two different optimum numbers of components (ONC) 10 and 4, respectively, gave good internal predictions and their cross-validated r2 values were between 0.639 and 0.743. These comprehensive CoMFA and CoMSIA models are useful in understanding the structure-activity relationships of CEU. The two models were compared to the X-ray crystal structure of the complex of tubulin-colchicine and analyzed for similarities between the two modes of analysis. These models will inspire the design of new CEU derivatives with enhanced inhibition of tumor cell growth and targeting specificity of II-tubulin and the cytoskeleton.
Keywords. CoMFA, CoMSIA, phenyl chloroethylurea, antimicrotubule agents, colchicine-binding site, tubulin
1 Introduction
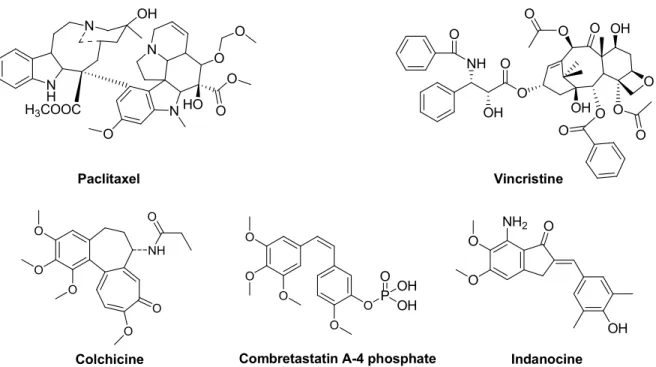
Microtubules are ubiquitous structures in eukaryotic cells and are involved in a wide range of cellular functions. Microtubules are composed of alternating - and -tubulin heterodimers, this dynamic structure rapidly assembles and disassembles depending on the cell’s needs.1 Tubulin is a major target for many anticancer drugs, clinically used or in development, because it is a key element in the cellular division process. There are three major binding sites identified on the tubulin heterodimers: the taxus-, the vinca- and the colchicinoid binding sites. Drugs acting in the taxus (e.g., paclitaxel2) and the vinca (e.g., vincristine3) binding sites are very important in the management of several cancers such as ovarian, breast, and prostrate cancers.4 Unfortunately, several chemoresistance mechanisms in tumor cells impede the treatment of such cancers.5 Thus, the research to find new antimicrotubule agents exhibiting optimal biopharmaceutical and pharmacological properties while dodging chemoresistance is the focus of numerous academic and industrial groups.6 N H N OH N N O O HO O O O H3COOC O O NH O OH O O O O O OH O O OH O O O O O O NH O O O O O O OH O O NH2 O
Colchicine Combretastatin A-4 phosphate Indanocine
Paclitaxel Vincristine
P OH O
OH
Figure 1 Molecular structure of paclitaxel, vincristine, colchicine, combretastatin A-4 and indanocine.
Scientists have been focusing their efforts for several decades on the development of drugs acting on the colchicine-binding site (C-BS) such as indanocine,7 curacin,8 and 3-aminobenzophenone.9 Drugs binding to the C-BS such as combretastatin A-4 have a great potential for the treatment of cancer (figure 1).10 Among the new drugs acting on C-BS, our laboratory has developed in the past decade a novel class of antimitotics called N-phenyl-N’-(2-chloroethyl)ureas (CEU).11 CEU are protein monoalkylating agents that covalently bind via the N’-(2-chloroethyl)urea moiety to the Glu198 residue, an amino acid adjacent to the colchicine-binding site.12 CEU do not alkylate most powerful nucleophilic cellular entities such as DNA, glutathione, or glutathione reductase, unlike most clinically relevant alkylating agents.13 CEU exhibit cell growth inhibition (IC
50) on numerous cancer cell lines and on various chemoresistant tumor cell lines (e.g., CEM/VLB500, LoVo, HT-29, CHO).14–16 Moreover, CEU block efficiently angiogenesis and tumor growth in three distinct animal models: the MatrigelTM plug assay, the CT-26 tumor growth assay in mice, and the chick chorioallantoic membrane tumor assay, respectively.13 On the basis of the apparent innocuousness of CEU and on their specific biodistribution to organs of the gastrointestinal tract, CEU represent a promising new class of anticancer drugs for the treatment of colorectal cancers.13, 17, 18 Many structure-activity relationship studies were conducted to optimize the biopharmaceutical and the pharmacological properties of CEU.14, 15 These studies showed that: (i) the modification of the urea group by a carbamate or a thiourea decreased the growth inhibition activity, (ii) the presence of an alkyl chain, an halogen, or a polycyclic group substituted at position 3 or 4 of the phenyl ring is essential to the inhibitory activity, and (iii) the introduction of a R-methyl group instead of a S isomer in position 2 of the chloroethyl moiety increased the activity of the drug, while the insertion of an alkyl group in position 2 of the phenyl ring abrogated the cytotoxic activity. In this paper, we assessed the A and B moieties of the pharmacophore and the biofunctional group, part C of CEU (figure 2).
N H N H O Cl Decrease Decrease Increase
Biofunctionnal
group
Phenyl substituted at position 4 bya branched alkyl chain
or halogen or
polycyclic aromatic ring
Optimum when they have an urea group and a chloroethyl group Part A Part B Part C
Pharmacophore
group
1 2 3 4 5 6Figure 2 Molecular structure of CEU and important SAR elements, notably, for part A, B and C.
The aim of this investigation was to determine the most essential structural elements to optimize the antimitotic activity of CEU. The CoMFA and CoMSIA models were compared to the colchicine-binding site model realized from the X-ray structure at 3.58 Å of the stathminlike domain complex (PDB code 1SA0) of the tubulin-colchicine.19
2 Computational details
2.1 Data sets and biological activity
Training set and test set for the QSAR analyses were taken from three samples data sets.14–16 Some structures were rejected because they were active on another protein. For example, 1-(2-chloroethyl)-3-[4-(cyclohexyl)phenyl]urea acts on thioredoxin isoform 1 and 1-(2-chloroethyl)-3-(4-heptylphenyl)urea acts on the mitochondrial voltage-dependent anion channel.20 In the case where the data were not obtained from the same experiment, they were normalized by a linear regression to the experimental value of 1-(4-tert-butylphenyl)-3-(2-chloroethyl)urea (42) published by Mounetou et al.14 to ensure that there is consistency between cell lines (HT-29) in determining the biological activities.21 When the IC50 of CEU on HT-29 cells was unavailable, the IC50 was obtained from
MDA-MB-231; cells that were shown to give IC50 in the same order of magnitude. In addition, the mechanism of action of CEU is the same on both cell lines.13 The IC
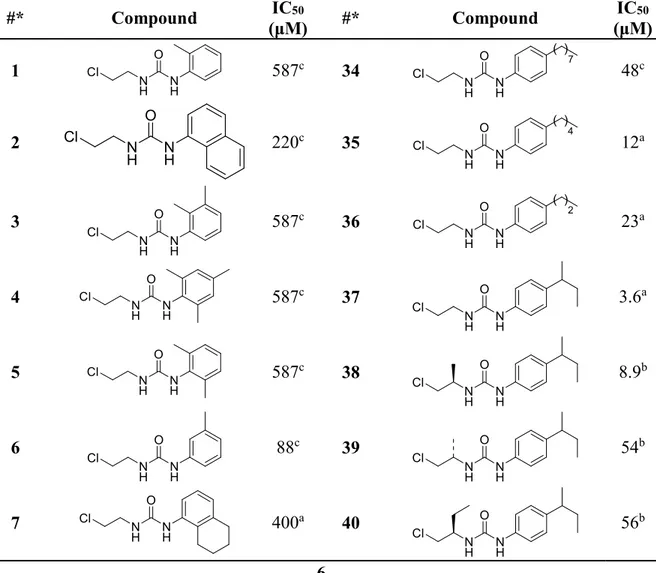
50 obtained from MDA-MB-231 cells were normalized by a linear regression based on compound 42. Fiftysix compounds were selected for the training set, and nine compounds were selected for the test set and were different from those of the training set. The molecules of the test set represent 16% of the training set, which is a good ratio to validate a molecular model. The strategy for the selection of the compounds included in the test set was a random selection of a family of compounds that exhibited a wide range of inhibitory activities. The structure and the IC50 values of the compounds of the training and the test sets are listed in Table 1.
Table 1 Molecular Structure and the Antiproliferative Activity (IC50) of the Molecules Selected in the Training and the Test Sets.
#* Compound (μM) IC50 #* Compound (μM) IC50 1 N H O N H Cl 587c 34 N H O N H Cl ( ) 7 48c 2 N H N H O Cl 220c 35 N H O N H Cl ( ) 4 12a 3 N H O N H Cl 587 c 36 N H O N H Cl ( ) 2 23a 4 N H O N H Cl 587c 37 N H O N H Cl 3.6 a 5 N H O N H Cl 587c 38 N H O N H Cl 8.9 b 6 N H O N H Cl 88 c 39 N H O N H Cl 54 b 7 N H O N H Cl 400a 40 N H O N H Cl 56 b
8 N H O N H Cl 5.4 a 41 N H O N H Cl 109 b 9 N H O N H Cl 20 a 42 N H O N H Cl 9.1 a 10 N H O N H Cl Br 9.0a 43 N H O N H Cl 8.9 b 11 N H O N H Cl Cl 14a 44 N H O N H Cl 55 b 12 N H O N H Cl 13a 45 N H O N H Cl 56b 13 N H O N H Cl 6.6b 46 N H O N H Cl 109 b 14 N H O N H Cl 28b 47 N H O N H Cl 21a 15 N H O N H Cl 10a 48 N H O N H 400a 16 N H O N H Cl 6.4b 49 N H O N H 132a 17 N H O N H Cl 100b 50 N H O N H 83a 18 N H O N H Cl ( ) 10 587c 51 N H O N H 400a 19 N H O N H Cl ( ) 12 587c 52 N H O N H 400a
20 N H O N H Cl N H N 48a 53 N H O N H 400a 21 N H O N H Cl I 3.9a 54 N H O N H 76a 22 N H O N H Cl I 0.85b 55 N H O N H 133a 23 N H O N H Cl I 49b 56 N H O N H 35a 24 N H O N H Cl I 22b t_57 N H O N H Cl 400 c 25 N H O N H Cl I 51b t_58 N H O N H Cl 16 c 26 N H O N H Cl 21a t_59 N H O N H Cl 6.4a 27 N H O N H Cl 23a t_60 N H O N H Cl 33 a 28 N H O N H Cl 5.5a t_61 N H O N H Cl 5.0 a 29 N H O N H Cl 4.9b t_62 N H O N H Cl 1.1 b 30 N H O N H Cl 181b t_63 N H O N H Cl 69 b 31 N H O N H Cl ( ) 3 22a t_64 N H O N H Cl 30 b
32 N H O N H Cl 36a t_65 N H O N H Cl 54 b 33 N H O N H Cl ( ) 5 12a
*Molecules used in the test set are identified by the prefix “t”. aData obtained from HT-29 tumor cells.14 bData normalized obtained from HT-29 tumor cells.15 cData normalized obtained from MDA-MB-231.14-16
2.2 Template selection
In the development of 3D-QSAR models, the choice of the template conformation is important to provide the illustration of a reliable pharmacophore model. X-ray structure of tubulin complexed with colchicine was available (PDB 1SA0).19 CEU is hydrophobic in nature and has a mainly rigid molecular frame. However, CEU does not exhibit the same mechanism of action (acylation of Glu198) on tubulin when compared to colchicine (anchoring Cys239 and Cys354)22 that was co-crystallized with tubulin in the X-ray structure.19 CoMFA and CoMSIA experiments not only provide additional tools to design new CEU but also comparative tools to validate whether the X-ray structure is appropriate to the modelization using CEU. Compound 1-(1-chloropropan-2-yl)-3-(4-iodophenyl)urea (22) was selected as a molecular template because it is the most potent compound of the series, being active in vitro and in vivo on a murine colon carcinoma.17,18 This compound was chosen mainly for its importance as a lead compound for the pharmacomodulation of CEU. It has been described in the literature23,24 that a combination of experimental data and theoretical calculations may improve statistical values of a 3D-QSAR analysis but at the present time there are no experimental NMR nor other experimental data to confirm the structure of the active conformation. The optimal number of components (ONC) varied according to two different parameters, namely, optimum q2 and ONC with 5 components and optimum q2 with 15 components, to assess their effect on the determination of valid 3D-QSAR models. Initial structures were generated using the cleanup procedure within SYBYL and energy-minimized using MAXIMIN2 (Powell method, 2000 iterations, and 0.05 kcal mol-1 Å-1 energy gradient convergence criteria). It is known that the conformation representing the global minimum of the ligand may not bind to the receptor and some
degree of torsional freedom is required for the drug to adapt to the receptor-binding site to yield a drug-receptor complex of lower energy.25 But in our case, we have mainly rigid structures to limit the possible active conformations and the ‘minimum’ energy conformation resulting from a MAXIMIN2 procedure is an excellent starting point to identify possible active candidate conformations for the compound of interest.
2.3 Structure alignment
All compounds of the training and the test sets contained a common fragment: a substituted phenyl methyl urea group (Figure 3). This structure was mainly rigid (limited number of possible conformations) and it was chosen to align all molecules of the training and the test sets. Thus, that frame structure was introduced in the database and the database was aligned using command ‘align database’.
N H N H
O
Figure 3 Template alignment of the training set and the test set database.
3 Results and discussion
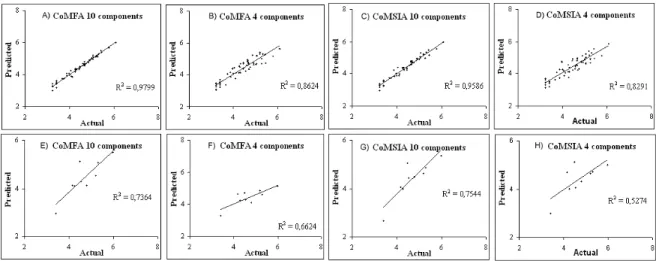
A data set of 56 CEU derivatives for the training set and 9 CEU for the test set was used with a wide spectrum of activities against tumor cells. The test set was used to determine the accuracy of the model. The training set and the test set were aligned to derive both the conventional CoMFA and CoMSIA models as shown in Figure 4. Thus, a total of 4 models were generated with two different ONC (10 and 4 components). The cross-validated r2(q2) values for the 4 models relating the tumor cell growth inhibition are shown in the Supporting Information.
Figure 4 Alignment of: (A) the training set and (B) the test set.
3.1 CoMFA analysis
By use of the default CoMFA settings, which included steric and electrostatic fields and molecular weight (MW) parameters, cross-validated coefficient (q2) 0.743 with 10 ONC was observed (model A) (Table 2). With the same fields without MW parameter, cross-validated coefficient (q2) 0.664 with 4 ONC was observed (model B) (Table 2). The choice of the CoMFA options described below was based on maximizing the q2 value.26 The statistical parameters associated with all models are shown in Table 2. The predicted pIC50 values for each training set of compounds and the residual values are given in Table 3.
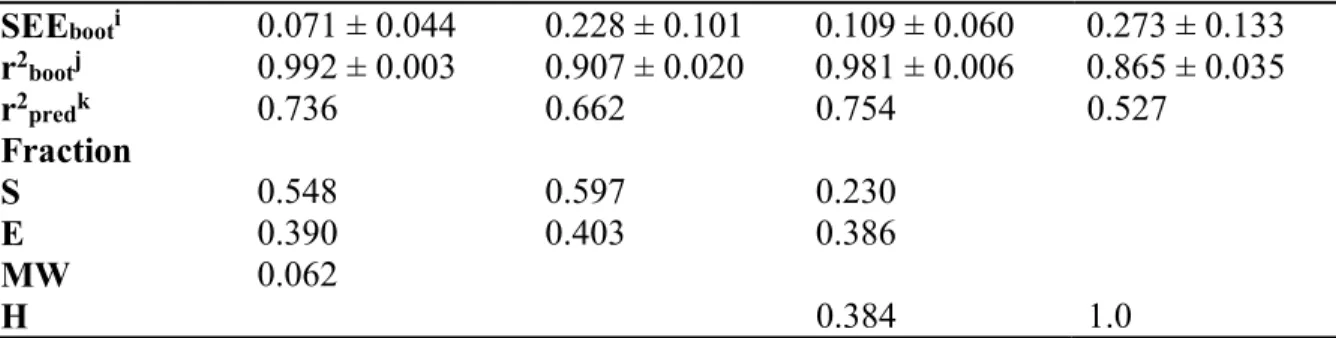
Table 2 Statistical Data for QSAR Method with CoMFA and CoMSIA for Two Different ONC.
Model namea CoMFA CoMSIA
Model A Model B Model C Model D
Fields and parametersb S, E, MW S, E S, E, H H q2c 0.743 0.664 0.720 0.639 r2 cvd 0.700 0.624 0.673 0.589 STEPe 0.726, 0.632, 0.529, 0.468, 0.433, 0.441, 0.442, 0.440, 0.442, 0.440 0.692, 0.603, 0.491, 0.463 0.669, 0.567, 0.509, 0.463, 0.452, 0.458, 0.463, 0.456, 0.455, 0.469 0.663, 0.589, 0.529, 0.484 ONCf 10 4 10 4 SEEg 0.113 0.281 0.163 0.313 r2 0.980 0.862 0.959 0.829 F valueh 221.907 (n1=10, n2=45) 79.469 (n1= 4, n2=51) 105.318 (n1=10, n2=45) 61.605 (n1= 4, n2=51) Prob. of r2 = 0 0 0 0 0
SEEbooti 0.071 ± 0.044 0.228 ± 0.101 0.109 ± 0.060 0.273 ± 0.133 r2bootj 0.992 ± 0.003 0.907 ± 0.020 0.981 ± 0.006 0.865 ± 0.035 r2predk 0.736 0.662 0.754 0.527 Fraction S 0.548 0.597 0.230 E 0.390 0.403 0.386 MW 0.062 H 0.384 1.0
aModel name: Model A and C = optimum q2 and ONC with 15 components, Model B and D = optimum q2 and ONC with 5 components. bFields used: S = steric, E = electrostatic, H = hydrophobicity. Parameters used: MW = molecular weight. cq2 = cross-validated correlation coefficient from LOO. dr2cv = cross-validated correlation coefficient. eSTEP = standard error of prediction. fONC = optimal number of components. gSEE = standard error of estimate. hF = r2/(1 -r2). iSEEboot = standard error of estimate from bootstrapping. jr2boot = correlation coefficient from bootstrapping. kr2pred = correlation coefficient of the prediction of the test set.
Table 3 CoMFA and CoMSIA Actual and Predicted Activities (-log (IC50)) for the Training Set Molecules.
Model Name CoMFA CoMSIA
Model A Model B Model C Model D
Compd Actual Calcd Res Calcd Res Calcd Res Calcd Res
1 3.23 3.24 -0.01 3.33 -0.10 3.31 -0.08 3.61 -0.38 2 3.66 3.75 -0.09 3.37 0.29 3.72 -0.06 3.63 0.03 3 3.23 3.29 -0.06 3.26 -0.03 3.32 -0.09 3.61 -0.38 4 3.23 3.43 -0.20 3.47 -0.24 3.38 -0.15 3.71 -0.48 5 3.23 (out2.98 a) 0.25 3.05 0.18 2.96 0.27 3.31 -0.08 6 4.06 4.24 -0.18 4.45 -0.39 4.41 -0.35 4.19 -0.13 7 3.40 3.41 -0.01 3.47 -0.07 3.25 0.15 3.40 0.00 8 5.27 5.11 0.16 4.73 0.54 (out4.95 a) 0.32 4.68 0.59 9 4.70 4.64 0.06 4.37 0.33 4.71 -0.01 4.22 0.48 10 5.05 5.14 -0.09 5.21 -0.16 5.06 -0.01 5.03 0.02 11 4.85 4.77 0.08 5.26 -0.41 4.84 0.01 4.76 0.09 12 4.89 4.92 -0.03 4.78 0.11 4.96 -0.07 5.13 -0.24 13 5.18 5.13 0.05 5.42 -0.24 5.25 -0.07 5.42 -0.24 14 4.55 4.54 0.01 4.23 0.32 4.52 0.03 4.30 0.25 15 5.00 5.01 -0.01 4.69 0.31 4.93 0.07 4.90 0.10 16 5.19 5.2 -0.01 5.33 -0.14 5.21 -0.02 5.17 0.02
17 4.00 3.96 0.04 4.08 -0.08 3.88 0.12 4.27 -0.27 18 3.23 3.23 0.00 3.44 -0.21 3.26 -0.03 3.46 -0.23 19 3.23 3.23 0.00 3.1 0.13 3.16 0.07 3.12 0.11 20 4.32 4.35 -0.03 4.72 -0.40 4.22 0.10 4.13 0.19 21 5.41 5.51 -0.10 5.27 0.14 5.48 -0.07 5.57 -0.16 22 6.07 6 0.07 5.64 0.43 5.98 0.09 5.89 0.18 23 4.31 4.3 0.01 4.49 -0.18 4.40 -0.09 4.41 -0.10 24 4.66 4.55 0.11 4.92 -0.26 4.61 0.05 4.94 -0.28 25 4.29 4.31 -0.02 4.15 0.14 4.35 -0.06 3.75 0.54 26 4.68 4.79 -0.11 4.71 -0.03 4.84 -0.16 5.00 -0.32 27 4.64 4.7 -0.06 4.96 -0.32 4.75 -0.11 4.55 0.09 28 5.26 5.19 0.07 5.03 0.23 5.00 0.26 4.92 0.34 29 5.31 5.31 0.00 5.32 -0.01 5.34 -0.03 5.31 0.00 30 3.74 3.75 -0.01 4.04 -0.30 3.72 0.02 4.09 -0.35 31 4.66 4.64 0.02 4.83 -0.17 4.79 -0.13 4.83 -0.17 32 4.44 4.33 0.11 4.71 -0.27 4.31 0.13 4.84 -0.40 33 4.92 4.92 0.00 4.63 0.29 4.93 -0.01 4.72 0.20 34 4.31 4.29 0.02 4.12 0.19 4.25 0.06 4.13 0.18 35 4.92 4.93 -0.01 4.77 0.15 4.97 -0.05 4.84 0.08 36 4.64 4.61 0.03 4.86 -0.22 4.81 -0.17 4.81 -0.17 37 5.44 5.4 0.04 (out4.76 a) 0.68 5.16 0.28 4.96 0.48 38 5.77 5.7 0.07 (out5.19 a) 0.58 5.57 0.20 (out5.14 a) 0.63 39 4.45 4.44 0.01 4.79 -0.34 4.35 0.10 4.93 -0.48 40 4.74 4.7 0.04 4.51 0.23 4.70 0.04 4.29 0.45 41 4.60 4.69 -0.09 4.61 -0.01 4.57 0.03 4.46 0.14 42 5.04 4.97 0.07 4.73 0.31 4.98 0.06 4.66 0.38 43 5.05 5.22 -0.17 5.20 -0.15 5.33 -0.28 5.23 -0.18 44 3.96 4.06 -0.10 4.39 -0.43 4.01 -0.05 (out4.76 a) -0.80 45 4.25 4.33 -0.08 4.12 0.13 4.36 -0.11 4.11 0.14 46 4.26 4.16 0.10 4.55 -0.29 4.34 -0.08 4.58 -0.32 47 4.68 4.7 -0.02 4.76 -0.08 4.74 -0.06 4.49 0.19 48 3.40 3.53 -0.13 3.69 -0.29 3.54 -0.14 3.5 -0.10 49 3.88 3.92 -0.04 3.87 0.01 3.82 0.06 3.73 0.15 50 4.08 3.88 0.20 3.77 0.31 3.86 0.22 3.86 0.22 51 3.40 3.18 0.22 3.25 0.15 3.28 0.12 3.20 0.20
(outa) 52 3.40 3.45 -0.05 3.39 0.01 3.53 -0.13 3.42 -0.02 53 3.40 3.58 -0.18 3.54 -0.14 3.60 -0.20 3.53 -0.13 54 4.12 (out3.86 a) 0.26 4.11 0.01 3.98 0.14 4.03 0.09 55 3.88 4.06 -0.18 4.16 -0.28 (out4.24 a) -0.36 4.25 -0.37 56 4.46 4.47 -0.01 4.40 0.06 4.23 0.23 4.21 0.25 aOut: outlier.
The following options: steric field with 30 kcal/mol cutoffs, electrostatic fields with 2 kcal/mol cutoffs, 1/r for the dielectric function, 2.0 Å step size, a C+
sp3 probe atom, and a grid box set at SYBYL’s default position were used to create the CoMFA model A. The model A has 10 ONC, a conventional r2 value of 0.980, and a standard error of estimate (SEE) of 0.113. This analysis yielded an F(10, 45) value of 221.907. The model B uses the following options: steric field with 30 kcal/mol cutoffs, electrostatic fields with 5 kcal/mol cutoffs, 1/r for the dielectric function, 2.0 Å step size, a C+
sp3 probe atom, and a grid box set at SYBYL’s default position. This model had a conventional r2 value of 0.862, and a standard error of estimate (SEE) of 0.281. The analysis yielded an F(4, 51) value of 79.469. The other descriptors used with CoMFA were discarded because the q2 was lower than without descriptor. A q2 of 0.5 is generally considered an indication that the model is internally predictive; thus, the q2 values obtained in the present case are higher than the numbers obtained for models A (0.743) and B (0.664). To validate our models, the bootstrapping function was used to determine the error on the r2 (r2
boot) and the SEE (SEEboot) of the model. This statistical parameter gave an idea of the accuracy of the model. In fact, the best model of each conformation had a small error on the SEE and r2. The models A and B have an r2
boot of 0.990 ± 0.003 and 0.907 ± 0.020, respectively. They also have a SEEboot of 0.071 ± 0.044 and 0.228 ± 0.101, respectively. Furthermore the tumor cell growth inhibition activity for the 9 compounds was predicted from the corresponding external test set. These compounds were used to validate our CoMFA models that are representing 16% of the training set. Both models predicted the efficacy of the external test set. These results were expected and they follow the statistical values r2 (r2
pred) of every model. In fact, r2 (r2
model B. Furthermore, each CoMFA model had three and two outliers in the training set, respectively. In general, a residual value greater than two times the standard error of the residuals generated in the validation procedure is considered as an outlier.27 In the CoMFA model A, the outliers were compounds 5, 51, and 54. In CoMFA model B, the outliers were compounds 37 and 38, respectively. The graphs of the actual pIC50 versus the predicted pIC50 values for the training set and test set by the conventional CoMFA models based on the tumor growth inhibition are shown in Figure 5.
Figure 5 Prediction for training set of CoMFA and CoMSIA (A-D) and prediction of test set of CoMFA and CoMSIA (E-H) for 10 and 4 ONC.
3.2 CoMSIA analysis
Two CoMSIA models with 10 ONC (model C) and 4 ONC (model D) were generated from the same training set and the same alignment rule used in CoMFA. The cross-validated r2(q2) values of the two models, which result from the various CoMSIA options, are shown in the Supporting Information. The statistical parameters associated with two models are shown in Table 2. CoMSIA model C used the steric, electrostatic, and hydrophobicity fields and had a q2 value of 0.720, a conventional r2 value of 0.959, and a SEE of 0.163. This yielded an F(10, 45) value of 105.318. The CoMSIA model D used only the hydrophobicity field. This model had a q2 value of 0.639, a conventional r2 value of 0.829, and a SEE of 0.313. This yielded an F(4, 51) value of 61.605. The predicted pIC50 values for each training set compound and the residual values are given in Table 3. The CoMSIA model C has an r2 of 0.981 ± 0.006 and a SEE of 0.109 ± 0.060. The
CoMSIA model D had an r2
boot of 0.865 ± 0.035 and a SEEboot of 0.273 ± 0.133. Furthermore, the same external test set of CoMFA was used to validate the CoMSIA models. The external test set was predicted more efficiently when using model C comparatively to model D showing an r2 (r2
pred) of 0.754 and 0.527, respectively. These results were expected and they follow the statistics of every model. In addition, each CoMSIA model had two outliers in the training set. In the CoMSIA model C, compounds 8 and 55 were greater than two-times the standard error and were considered as outliers. In the CoMSIA model D, the outliers were compounds 38 and 49. The graphs of the actual pIC50 versus the predicted pIC50 values for the training set and test set by the conventional CoMSIA models C and D based on the tumor cell growth inhibitory activity are shown in Figure 5.
The explanation for the outliers in different models was difficult to determine, the molecular structure of compounds 5, 8, 37, 38, 44, 51, 54, and 55 exhibiting good similarities with compound 22. To explain the different outliers, we have assessed the relationship between themselves and the source of the outliers. Firstly, the outliers are all different with the exception of compound 38 that is used as an outlier in model B (CoMFA 4 ONC) and model D (CoMSIA 4 ONC). Therefore, there are no relationships between the outliers used in the different models. In addition, there is only in model A (compound 5) that an outlier is based on the “normalization” of IC50 obtained from MDA-MB-231 tumor cells. Consequently, the hypothesis that outliers could be related to the use of two cell lines to determine the IC50 was ruled out.
3.3 CoMFA and CoMSIA contour maps
The q2 values in the training set associated with the CoMFA models are superior to those obtained from the CoMSIA models. The predictive r2 of the external set of CoMFA model B and CoMSIA model D (with 4 ONC) follows the same trend of the q2 and r2 of the training set (0.527 vs 0.662). In addition, the predictive r2 of the external set of CoMSIA model C exhibits better external predictive power than the CoMFA model A (0.754 comparatively to 0.736). In the CoMFA steric field, the green (sterically favorable) and yellow (sterically unfavorable) contours represent 80% and 20% level contributions,
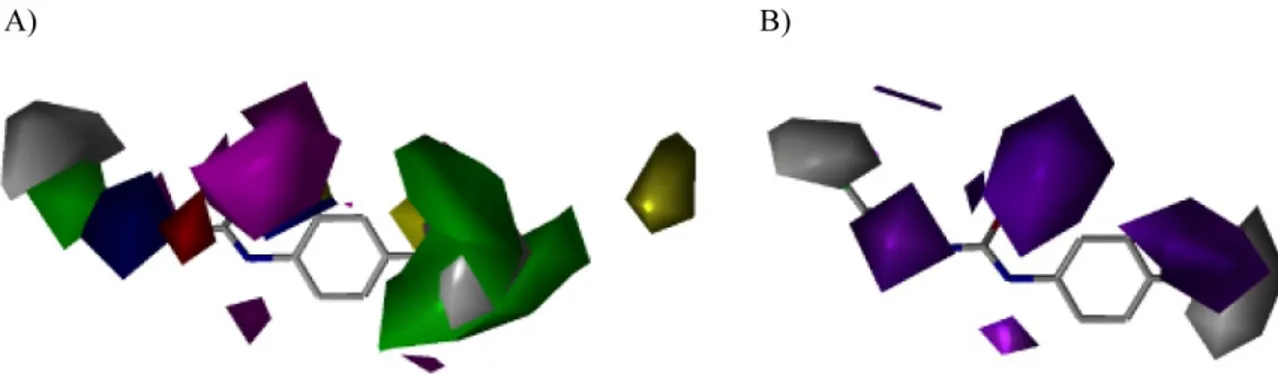
respectively. The blue (negative charge favorable) and red (negative charge unfavorable) contours in the CoMFA electrostatic field contours also represent 80% and 20% level contributions (Figure 6), respectively. CoMSIA analyses were selected also to construct contour maps (Figure 7). In the CoMSIA electrostatic field, the red (negative charge favorable) and blue (negative charge unfavorable) contours represent 80% and 20% level contributions, respectively. In the steric field, the green (sterically favorable) and yellow (sterically unfavorable) contours represent 80% and 20% level contributions, respectively. In the hydrophobic field, gray (favorable) and magenta (unfavorable) represent 80% and 20% level contributions, respectively. The contour maps of the CoMFA models were distributed in the entire molecule.
Figure 6 Contour map of steric and electrostatic fields (standard deviation x coefficient) generated with the CoMFA model based on growth inhibition activity: (A) and (B) model generated with 10 ONC and (C) model generated with 4 ONC. Color-coding is as follows: Blue indicates that a positive charge favors high affinity, whereas red indicates that a positive charge does not favor high affinity. Yellow indicates regions where bulky groups increase activity, whereas green indicates regions where bulky groups decrease activity.
Part A
In part A of the molecule for both models, the presence of a 2-chloroethyl group is a key element of the pharmacological activity of CEU. The presence of a chlorine atom falls into a negative favorable blue region, suggesting that a negative charge is important to the antiproliferative activity. The position of the chlorine atom in space seems to be critical. To that end, the homologous propyl chain bearing a chlorine atom decreases significantly the antiproliferative activity (compound 47) and generates an unfavorable red electrostatic region at the end of the chloroethyl moiety. The weak biological activity of compounds 54-56 that are bearing a propyl group produces a favorable green steric bulky region. The large blue electrostatic favourable region nearby the 2-chloroethylamino moiety was generated by the good antiproliferative activity of unsubstituted 2-chloroethylamino and the weak potency of 1-methylamino derivatives (compounds 51-53). The CoMFA model A generates an unfavorable yellow bulky region in the vicinity of the S-methyl substituent and the CoMFA model B produces a favorable green bulky region in the R-methyl group region. These two different combinations lead to the same conclusion: R-methyl group increases significantly the antiproliferative activity (compounds 13, 16, 22, 29, and 43) while the R-ethyl, S-methyl and S-ethyl decrease the activity (shown by compounds 14, 17, 23-25, 30, 39-41, and 44-46). The influence of the urea moiety has not been evaluated in the QSAR but that group is important for the activity of CEU as suggested by the favourable blue region.
Part B
In part B, a blue favorable electrostatic region is above the aromatic ring in each CoMFA model. This particularity explains the importance of the phenyl group for / or Van der Waals interactions with -tubulin. Moreover, a yellow unfavorable steric bulky region is present at position 2 of the phenyl ring. This particularity is reality-representative since compounds 1 and 3-5 having a methyl group at this position are inactive.
Part C
The part C was the most studied region in these models. In each CoMFA model, a red unfavourable electrostatic region far from the phenyl ring (a chain length >7 atoms)
suggests that the presence of a negatively charged group decreases the antiproliferative activity of CEU. In addition, substituent on the phenyl ring having an alkyl chain longer than 7 carbon atoms seems to decrease also the antiproliferative activity of CEU (e.g., compounds 18 and 19). In the CoMFA model A, a blue favorable electrostatic region near the phenyl ring and the iodine atom explains the increased antiproliferative activity of CEU substituted by an iodine atom instead of a chlorine or a bromine atom. This increase of the antiproliferative activity of iodo-substituted CEU might be explained also by changes in the Van der Waals interactions of the phenyl ring that becomes a weaker electron-acceptor when substituted by a chlorine or a bromine atom. In the same region, there is a favorable green steric bulky region in each model that may explain the increased antiproliferative activity of CEU substituted with a branched lower alkyl chain or an aromatic ring.
Figure 7 Contour maps generated with the CoMSIA model based on growth inhibition: (A) model generated with 10 components and (B) model generated with 4 components. Color-coding is as follows: blue indicates that a positive charge favors high affinity, whereas red indicates that a positive charge does not favor high affinity. Yellow indicates regions where bulky groups decrease activity, whereas green indicates regions where bulky groups increase activity. The gray color indicates regions where hydrophobic groups increase the cytotoxicity of CEU, whereas magenta indicates regions where hydrophobic groups decrease the biological activity.
The contour maps of CoMSIA models also indicate features in part A-C. CoMSIA model C is based on three parameters: steric, electrostatic, and hydrophobic fields while the CoMSIA model D takes into account the hydrophobic field only.
Hydrophobic field
Hydrophobic field had equivalent regions in two CoMSIA models. For these reasons, we have described the hydrophobic field for both models. In part A, the weak
antiproliferative activity of compounds 49, 50, 54, 55 and 56 that are substituted by ethyl or propyl groups is depicted by the gray favourable hydrophobic region near the chlorine atom. The presence of R-ethyl, S-methyl, and S-ethyl groups decreased the activity and generated a magenta unfavourable hydrophobic region around the ethyl region. The presence of a methyl or ethyl group at position 2 or 6 of the phenyl ring in part B abrogates the antiproliferative activity and consequently induces two magenta unfavourable regions. In part C, compounds 18 and 19 with a chain length of 10 and 12 carbon atoms, respectively, are inactive. Consequently, a magenta unfavorable region was created in this part. A good activity of lower alkyl chain substituents at position 4 of the phenyl ring has generated a gray favorable hydrophobic region.
Steric field
For the steric field of CoMSIA model C, the weak activity of the propyl group in part A produced a green favorable steric region. Unexpectedly, there was no unfavorable steric region in the urea region of the CEU. This unexpected result might be related to the unfavourable hydrophobic region in this area. Similarly to the CoMFA model, the CoMSIA model generated a yellow unfavorable steric in part B that explains the biological inactivity of compounds 1, 3-5 in training set and compound 57 in the test set bearing a methyl or ethyl group at the 2 or 6 position of the phenyl ring. Moreover, in part C, a good antiproliferative activity of CEU substituted by lower alkyl chains produced a green favorable region in this area. As aforementioned, model C showed two sterically green favorable regions in proximity to the iodo group and generated two sterically yellow unfavorable regions at the same chain length.
Electrostatic field
The presence of a 3-chloropropyl group, that decreases the pharmacological activity of the drugs, has generated two unfavorable red electrophilic regions on both sides of the chlorine atom. The presence of the chlorine atom in part A and the urea group has generated two blue favorable electrophilic regions in both areas. There are also two red regions surrounding the urea moiety suggesting the importance of a negatively charged group (acceptor group) such as an urea for the biological activity.
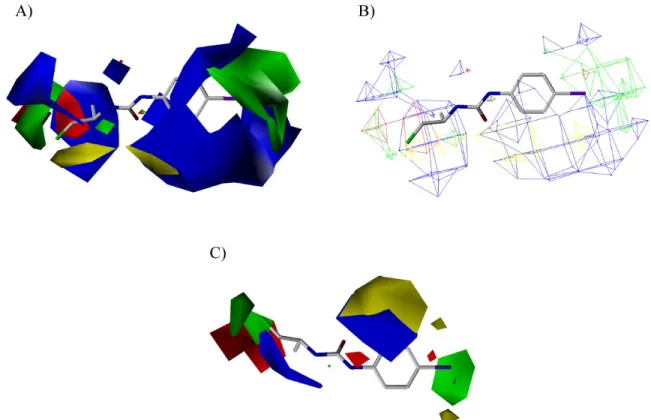
Figure 8 Alignment of the training-set into the colchicine-binding site to highlight the similarities between CoMSIA and CoMFA models. Important amino acids for the mechanism(s) of action such as Glu198, Cys239 and guanosine triphosphate are also showed. The color of the pocket contours represents the hydrophobic (brown) and electrostatic (blue) fields, respectively. The -helices are in red, the -sheets in blue and the protein backbone is in yellow.
The comparison of our CoMFA and CoMSIA models with the C-BS model published by Ravelli et al.19 exposed several similarities between these models. The experiments conducted on tumor cell growth showed that the chlorine atom on the 2-chloroethyl amino moiety of CEU is prerequisite for the acylation of Glu198.12 In that context, CEU were docked in the C-BS as displayed in Figure 8 to highlight Glu198 that is located at the end of the hydrophobic pocket adjacent to the C-BS and involved in the mechanism of action of CEU. All together our experiments using molecular modeling (crankshaft method) and molecular pharmacology methodologies are in good agreement with the X-ray structure described by Ravelli.19 First, in part A of the CEU pocket there is a steric hindrance at the end of the pocket represented in the CoMFA models A, B and CoMSIA model C, respectively, as a green favorable steric field nearby the chlorine atom position. The hydrophobic region in the CEU pocket is illustrated in the CoMSIA models C and D by a magenta unfavourable region around the part A of CEU. Second, the
electrophilic blue region in part A of the CoMFA models A and B and CoMSIA model C are in good agreement with the presence of the nucleophilic Glu198 in the Xray model described by Ravelli. In addition, the same observation was made between the electrophilic blue regions in urea and part B region of the CEU and the nucleophilic Cys239 in the X-ray model. The steric, the electrostatic, and the hydrophobic fields in part C of CEU in all CoMFA and CoMSIA models correlated also to the steric pocket of the C-BS in the X-ray model. However, there is discrepancy between the CoMSIA and the CoMFA, and the X-ray model where the latter model is failing to explain the dramatic differences in the antiproliferative activity related to R or S isomeric CEU (substituted on position 1 of the 2-chloroethylamino moiety). For example, the 2-chloroethyl amino unsubstituted iodinated compound 21, its R-methyl 22, and its S-methyl counterpart 23 exhibited IC50 of 3.9, 0.85, and 22 M, respectively.
4 Conclusion
In this study, we have investigated 3D-QSAR models of CEU. Predictive CoMFA and CoMSIA models were developed for the modulation against tumor cell lines using 56 CEU derivatives in the training set. Each model was validated using external test set of 9 compounds not included in the training set and showed mild to good predictive r2 between 0.527 and 0.754. Model with the best q2 did not give the best external prediction. In fact, the CoMFA model A has a q2 of 0.743 and has a predictive r2 0.736 since the CoMSIA model C has a q2 of 0.720 and has a predictive r2 0.754. The CoMFA and CoMSIA models with 4 ONC (models B and D) have a lower q2 (0.624 and 0.639, respectively) and predictive r2 (0.662 and 0.527, respectively). The best CoMFA model used steric, electrostatic fields, and molecular weight parameters, while the steric, electrostatic, and hydrophobic fields were the most important regions to obtain the best CoMSIA model. Few similarities were established between our CoMFA and CoMSIA models and X-ray structure models: (1) a chlorine atom is essential to the acylation of Glu198 and is also necessary to the cell growth inhibitory activity; (2) a bulky group around the pharmacophore confirms the tightness of the binding pocket; (3) an electrostatic favorable region near the urea moiety is necessary to stabilize the CEU before the acylation; (4) an
important unfavorable steric region at the end of a chain length of 7 carbon atoms showed that bulky groups decrease the activity at that point; (5) an important favourable electrostatic region around the phenyl ring and iodo group showed that weak electro-attractive groups improve the antiproliferative activity of CEU. The derived models in this study explain the observed variance in the activity of CEU. They show a high level of similitude with the models obtained by X-ray structure19 and they establish that their X-ray model is applicable for the particular mechanism of acylation of CEU. They help also to understand the mechanism of action of CEU activity on II-tubulin, and provide important insights into structural variations that may lead to the design of new antitubulin agents exhibiting higher selectivity toward the colchicine-binding site.
5 Experimental
5.1 CoMFA
The initial CoMFA model was calculated using the SYBYL 7.0 molecular modeling software. For the calculation of charges, the Gasteiger-Hückel method was used as implemented in SYBYL 7.0. For the training compounds set, the CoMFA descriptors’ steric (Lennard-Jones 6-12 potential) and electrostatic (Coulombic potential) fields energies were calculated using SYBYL. In general, the following standard characteristics were used to calculate the CoMFA fields: 4.0 Å extension beyond the Van der Waals envelopes of the molecules, a distance-dependent dielectric constant (1/r), and an sp3 carbon atom with +1.0 charge serving as the probe atom to calculate the steric and the electrostatic fields. The following standard CoMFA fields were calculated: steric (S), electrostatic (E), and both (B). The effects of changing several parameters were systematically investigated, including dielectric (function as 1/r vs constant), grid step size (1-3 Å), probe atom type (H+, O3-, and Csp3+), and the cutoff values for the steric and the electrostatic fields. Some other descriptors were also added to see their effects on the correlation such as molecular weight, dipole moment, molar refractivity, logP, polar volume, and polar surface area.
5.2 CoMSIA
CoMSIA analysis was performed using the QSAR module in SYBYL 7.0. The five similarity indices in CoMSIA (steric (S), electrostatic (E), hydrophobic (H), H-bond donor (D), and H-bond acceptor (A) descriptors) were calculated using the probe atom Csp3+ with a radius of 1 Å and a +1.0 charge placed at the lattice points of the same region of grid as it was used for the CoMFA calculations. CoMSIA similarity indices (AF) for a molecule j with atom i at a grid point q are calculated by:
, 2 ,(
)
iq q r ik k probe K Fj
e
A
(1)where k represents the following physicochemical properties: steric, electrostatic, hydrophobic, H-bond donor, and H-bond acceptor. A Gaussian type distance dependence was used between the grid point q and each atom I of the molecule. A default value of 0.3 was used as the attenuation factor (R). Here, steric indices are related to the third power of the atomic radii, electrostatic descriptors are derived from atomic partial charges, hydrophobic fields are derived from atom-based parameters,28 and H-bond donor and acceptor indices are obtained by a rule method based on experimental results.29
5.3 PLS analysis
The conventional CoMFA and CoMSIA descriptors derived above were used as explanatory variables, and pIC50 (-logIC50) values were used as the target variable in PLS regression analyses to derive 3D-QSAR models using the implementation in the SYBYL package. The predictive value of the models was evaluated by leave-one-out (LOO) cross-validation with SAMPLS. The cross-validated coefficient, q2, was calculated using:
2 2 2
)
(
)
(
1
mean actual actual predY
Y
Y
Y
q
(2)where Ypred, Yactual, and Ymean are predicted, actual, and mean values of the target property (pIC50), respectively. Σ(Ypred - Yactual)2 is the predictive sum of squares (PRESS). The number of components giving the lowest PRESS value or the optimal number of
components (ONC) was used to generate the final PLS regression models. The conventional correlation coefficient r2 and its standard error, s, were subsequently computed for the final PLS models. CoMFA and CoMSIA coefficient maps were generated by interpolation of the pairwise products between the PLS coefficients and the standard deviations of the corresponding CoMFA or CoMSIA descriptor values. The bootstrapping procedure was used to validate each model. This is a procedure in which n random selections out of the original set of n objects are performed several times (100-times was used to have good statistical information) to simulate different samplings from a larger set of objects. In each run some objects may not be included in the PLS analysis (same method to determine the q2), whereas some others might be included more than once. Confidence intervals for each term can be estimated from such a procedure, giving an independent measure of the stability of the PLS model.30–32
6 Acknowledgments
L.P.K. gratefully acknowledges the Rx&D HRF-CIHR Research Career Award and Premier’s Research Excellence Award. An infrastructure grant from the Ontario Innovation Trust provides support for the Molecular Design and Information Technology Centre and is gratefully acknowledged. This work was supported by a grant and a studentship from the Canadian Institutes of Health Research (R. C.-G., Grant #MOP-79334; S.F., #CGD-83623).
7 Supplementary data
Supporting information contains tables of results of the CoMFA and CoMSIA options on cross-validated coefficient r2(q2) (SAMPLS) values using templates 10 and 4 ONC. Supplementary data associated with this article can be found, in the online version, at doi:10.1016/j.bmc.2007.11.004 or in the annexe 1.
8 References and notes
1. Rowinsky, E. K.; Donehower, R. C. Pharmacol. Ther. 1991, 52, 35.
2. Wani, M. C.; Taylor, H. L.; Wall, M. E.; Coggon, P.; McPhail, A. T. J. Am. Chem. Soc. 1971, 93, 2325.
4. Attard, G.; Greystoke, A.; Kaye, S.; De Bono, J. Pathol. Biol. 2006, 54, 72.
5. Checchi, P. M.; Nettles, J. H.; Zhou, J.; Snyder, J. P.; Joshi, H. C. Trends Pharmacol. Sci. 2003, 24, 361.
6. Islam, M. N.; Song, Y. J. Mol. Graph. Mod. 2003, 21, 263.
7. Leoni, L. M.; Hamel, E.; Genini, D.; Shih, H.; Carrera, C. J.; Cottam, H. B.; Carson, D. A. J. Natl. Cancer Inst. 2000, 92, 217.
8. Verdier-Pinard, P.; Lai, J. Y.; Yoo, H. D.; Yu, J.; Marquez, B.; Nagle, D. G.; Nambu, M.; White, J. D.; Falck, J. R.; Gerwick, W. H.; Day, B. W.; Hamel, E. Mol. Pharm. 1998, 53, 62.
9. Liou, J. P.; Chang, J. Y.; Chang, C. W.; Chang, C. Y.; Mahindroo, N.; Kuo, F. M.; Hsieh, H. P. J. Med. Chem. 2004, 47, 2897.
10. O'Hanlon, L. H. J. Natl. Cancer Inst. 2005, 97, 1244.
11. Gaudreault, R. C.; Alaui-Jamali, M. A.; Batist, G.; Bechard, P.; Lacroix, J.; Poyet, P. Cancer Chem. Pharmacol. 1994, 33, 489.
12. Bouchon, B.; Chambon, C.; Mounetou, E.; Papon, J.; Miot-Noirault, E.; Gaudreault, R. C.; Madelmont, J. C.; Degoul, F. Mol. Pharm. 2005, 68, 1415.
13. Petitclerc, E.; Deschesnes, R. G.; Cote, M. F.; Marquis, C.; Janvier, R.; Lacroix, J.; Miot-Noirault, E.; Legault, J.; Mounetou, E.; Madelmont, J. C.; C.-Gaudreault, R. Cancer Res. 2004, 64, 4654.
14. Mounetou, E.; Legault, J.; Lacroix, J.; C.-Gaudreault, R. J. Med. Chem. 2001, 44, 694.
15. Mounetou, E.; Legault, J.; Lacroix, J.; C.-Gaudreault, R. J. Med. Chem. 2003, 46, 5055.
16. Legault, J.; Gaulin, J. F.; Mounetou, E.; Bolduc, S.; Lacroix, J.; Poyet, P.; Gaudreault, R. C. Cancer res. 2000, 60, 985.
17. Miot-Noirault, E.; Legault, J.; Cachin, F.; Mounetou, E.; Degoul, F.; Gaudreault, R. C.; Moins, N.; Madelmont, J. C. Invest. New Drugs 2004, 22, 369.
18. Borel, M.; Degoul, F.; Communal, Y.; Mounetou, E.; Bouchon, B.; C.-Gaudreault, R; Madelmont, J. C.; Miot-Noirault, E. Br. J. Cancer 2007, 96, 1684.
19. Ravelli, R. B.; Gigant, B.; Curmi, P. A.; Jourdain, I.; Lachkar, S.; Sobel, A.; Knossow, M. Nature 2004, 428, 198.
20. Patenaude, A.; Deschesnes, R. G.; Rousseau, J. L.; Petitclerc, E.; Lacroix, J.; Cote, M. F.; R, C. G. Cancer Res. 2007, 67, 2306.
21. Zheng, M.; Yu, K.; Liu, H.; Luo, X.; Chen, K.; Zhu, W.; Jiang, H. J. Comp. Aid. Mol. Des. 2006, 20, 549.
22. Bai, R.; Pei, X. F.; Boye, O.; Getahun, Z.; Grover, S.; Bekisz, J.; Nguyen, N. Y.; Brossi, A.; Hamel, E. J. Biol. Chem. 1996, 271, 12639.
23. Durdagi, S.; Kapou, A.; Kourouli, T.; Andreou, T.; Nikas, S. P.; Nahmias, V. R.; Papahatjis, D. P.; Papadopoulos, M. G.; Mavromoustakos, T. J. Med. Chem. 2007, 50, 2875.
24. Kapou, A.; Benetis, N. P.; Avlonitis, N.; Calogeropoulou, T.; Koufaki, M.; Scoulica, E.; Nikolaropoulos, S. S.; Mavromoustakos, T. Bioorg. Med. Chem. 2007, 15, 1252.
25. Bush, C. A.; Martin-Pastor, M.; Imberty, A. Annu. Rev. Biophys. Biomol. Struct. 1999, 28, 269.
26. Benson, A. B., 3rd; Trump, D. L.; Koeller, J. M.; Egorin, M. I.; Olman, E. A.; Witte, R. S.; Davis, T. E.; Tormey, D. C. Cancer Treat. Rep. 1985, 69, 795.
27. Bang, S. J.; Cho, S. J. Bull. Korean Chem. Soc. 2004, 25, 1525.
28. Viswanadhan, V. N.; Ghose, A. K.; Revankar, G. R.; Robins, R. K. J. Chem. Inf. Comput. Sci. 1989, 29, 163.
29. Klebe, G. J. Mol. Biol. 1994, 237, 212.
30. Cramer, R. D., III; Bunce, J. D.; Patterson, D. E.; Frank, I. E. Quant. Struct.-Act. Relat. 1988, 7, 18.
31. Agrafiotis, D. K.; Cedeno, W.; Lobanov, V. S. J. Chem. Inf. Comput. Sci. 2002, 42, 903.