Proceedings of the 6th International Conference on the Application of Physical Modelling in Coastal and Port Engineering and Science (Coastlab16)
Ottawa, Canada, May 10-13, 2016
Copyright ©: Creative Commons CC BY-NC-ND 4.0
PRELIMINARY INVESTIGATIONS OF WAVE IMPACT ON VERTICAL WALLS
WITH/WITHOUT PARAPETS AND TOE PROTECTION ON DEFORMABLE BEACH
JANNETTE B. FRANDSEN, OLIVIER G. TREMBLAY, RÉGIS XHARDÉ University of Québec, INRS-ETE, Canada, [email protected]
ABSTRACT
Large scale flume measurements of wave impact pressures on a 2.5 m high vertical wall with/without parapets have been undertaken in the context of coastal protection. The wall is mounted at the end of 25.5 m long porous-elastic beach on a slope 1:10. The beach material consists of a sand-gravel mixture. Herein, most tests are carried out with toe protection. Analysis of the data set is in progress and preliminary results are reported in terms of the max. pressure found on the wall structure and jet. Primarily, the inlet conditions consist of regular waves which typically transform into plunging breakers in shallow waters in front of the wall. It has been identified that two types of impacts are critical for the wall design: (1) bore-like wave fronts (flip-through impact) and (2) plunging breakers with airpocket trapped below the crest. The pressures on the structure are highly localized and random and vary rapidly. Similar to impact on circular cylinders, the flip-through impact tends to result in max. wall pressures (herein: 3.4 MPa caused by low aerated impact). The cause of the max. wall pressure and the max vertical jet pressures are not correlated. This is an important point with regards to design of walls both with and without parapets. For most of the cases tested, the wall configuration with parapet works well diverting the wave energy offshore (with jet pressures > 10 MPa) and minimizing structural loads with negligible overtopping. However, occasionally the parapet takes a hit (max. 4.2 MPa) and long waves tend to cause overtopping. With an anticipated full-scale wall height between 5 and 10m, this corresponds to a full-scale pressure on the parapet of 122 MPa using the Bagnold-Mitsuyasu law for a 10 m high wall. Low aeration and flip-through impacts were found to generate critical forces on the coastal structure. Without toe protection, scour develops rapidly. In this case, the parapet configuration does not divert the wave energy effectively and occasionally the wall takes a hit (~3.5 MPa). Irregular inlet waves tend to show similar trends. KEWORDS: Wave breaking, impact pressures, vertical walls, parapets, toe protection, deformable bed, large scale flume.
1 INTRODUCTION
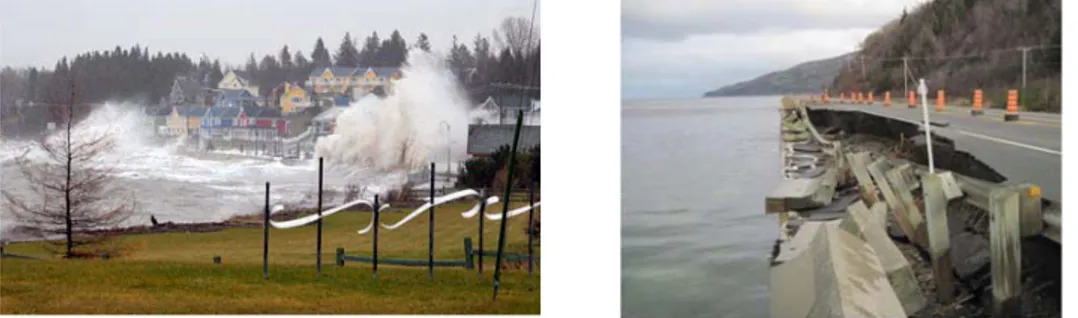
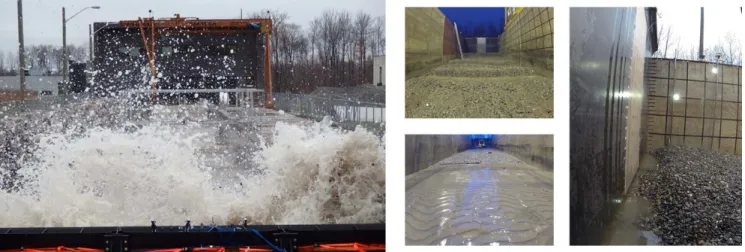
The present work is done in the context of protection of coast and coastal infrastructure. Storm predictions, overtopping and run-up are of interests due to failure of coastal structures during extreme events, as illustrated in figure 1.
Figure 1. Examples of wave impact on coast and coastal infrastructure (St. Lawrence river, Québec).
Specifically, the pressure distributions are investigated with regard to input to design of coastal walls (including parapets) caused by wave impacts. The impact processes are complex in particular due to the rapid varying highly localized peak pressures and the uncertainty of the role of the entrained air below the wave crest (Peregrine, 2003; Kiger & Duncan, 2012).
Few large scale wave impacts on wall experiments have been conducted. In the following three experiments conducted by others are highlighted. These include tests in the outdoor large flume of Deltares (length: 200m, depth: 7 m and width: 5m) in Marknesse, the Netherlands, without beach (Hofland et al., 2010) and in the indoor large wave flume, GWK, (length: 320m, depth: 7 m and width: 5m) of the Coastal Research Centre (FZK), a joint institution of the Leibniz Universität Hannover and the Technische Universität, Braunschweig, Germany. Bullock et al. (2007) conducted wave impact studies in the Hannover canal on a wall (1:4) with 13 pressure sensor mounted at 3 m from channel bed on a site specific rubble surface mound about 21 m long with an average slope of 1:7. On the 3 m exposed wall, one column contained 4 pressure sensors spaced 0.45 m were special designed to record variation in pressure and level of aeration capable of measuring pressure up to 4 MPa. A second column contained 9 Druck PDCR 800 series (no longer in production) with on upper limit of 1.5 MPa. Based on samples of 20 waves of a wave group, a maximum wall pressure of 3.5 MPa with a rise time of 1.2 ms was reported. It was caused by low aeration impact with an inlet condition containing regular waves with initial height, H0 =
1.35 m, wave period, T = 8 s and still water depth in front of wall of 1.25 m corresponding to a flume depth, h0 = 4.25 m.
The other large scale wave impact experiments which are closets to the present experiments have been undertaken by Hofland et al. (2010) in the Marknesse canal. It was done in the context of the Sloshel funded project with application to sloshing in LNG tanks (e.g., Lafeber et al., 2012). In the experimental set-up no beach was installed. Focussed waves impact a 9 m high wall located 145.2 m from the wave maker. The wall contained 23 pressure sensors and a sampling rate of 25 kHz or 50 kHz were applied. A relative dense optical sensor system was mounted on the side wall to record the breaker characteristics. A maximum peak pressure of 2.7 MPa was recorded with rise time less than 0.5 ms.
Recurves with closely spaced pressure sensors gathered in a pad have also been tested in the Hannover canal by Stagonas et al. (2014). A 33 m long beach with a slope of 1:10 was constructed in front of the wall. The wall was 243 m from the wave maker. Three different parapets with recurves of 48°, 70° and 90° were tested. The smallest with a width of 20 cm and height of 45 cm. Besides the Tekscan pressure pad, 8 pressure transducers were mounted on the parapet and 8 pressure sensors on the vertical part of the wall. A sampling frequency of 5 kHz was applied. Regular waves at the inlet were generated and 3 transects on the coastal structure were monitored. Maximum jet velocities in the order of 40 m/s and a maximum parapet force in the range of 6-9 kN were reported generated by initial waves with height, H0 = 0.6 m, wave
periods, T = 6 to 8 s and flume water depth of 4.1 m. It was further reported by Jaime et al. (2014) that for some events the recurves are exposed to pressures 60 % greater than those impacting a vertical wall. However, it is unclear what the absolute max. peak pressures were and what kind of impact conditions caused them. In the same experimental set-up for the recurve of 70°, Shiravani et al. (2014) investigated the jet physics and reported max. vertical jet velocity at the wall of 40 m/s.
The above introduction only highlights three relatively recent experiments due to the large scale. However, the reader should for example be aware of the developments by Oumeraci et al. (1993; 1994, 2001; 2010) and Cuomo et al. (2010).
Prior to the present tests, initial testing in Fall 2014 were conducted on a vertical wall without toe protection on a porous-elastic initial 1:10 sloping beach with initial regular wave train with 3 peaks in constant flume depth of 3.8 m and wave period of 6 s (Frandsen & Bérubé, 2015). It was identified that scour develops relatively fast and effect the wave form near wall significantly and subsequently the pressures on the coastal structure. Herein, we have expanded the data set in which most wave impact tests were conducted on a wall with toe protection for regular wave inlet conditions. Some tests were also done without toe protection for both regular and irregular waves.
2 EXPERIMENTAL SETUP AND TEST SERIES
Experiments in the Québec coastal physics laboratory have been conducted in Fall 2015. The outdoor flume has a depth and width of 5 m and is 112 m long from wave maker to end wall. At the end of the flume, 111.6 m from fixed wave maker position, is mounted a vertical rigid wall with 27 pressure sensor. In addition, a small beam with 5 pressure sensors is located 15 cm of center perpendicular to the top flange of the wall to capture jet pressures, as outlined in figure 2. The wall test area is 1.2 m wide and 2.47 m high consisting of a stiffened aluminum plate (remaining wall part are stiffened steel plates). Full-scale wall heights are anticipated to be 5-10 m. The experiment assumes a geometric scale of 1:4 or 1:2 and is based on existing wall/parapet structures of concrete, as shown in figure 1. The investigations are primarily based on inlet conditions with regular waves (wave trains with 5-15 peaks equivalent to 5-15 impact on wall per test) in intermediate water depth which travels towards a sloping beach 1:10 resulting in plunging breakers in shallow water near the wall. The beach is porous-elastic consisting of a mix of sand (31.8%), gravel (67.5%) and silt/clays (0.7%) with a mean sediment diameter, D50, of about 12 mm. The beach material is easily available in the Québec region of Canada. The beach material is relatively absorbent and could potential reduce some of the wave energy approaching the coastal structure. Therefore the beach material is utilized in the context of coastal protection to nourishing eroded beaches. Herein most tests are conducted with toe protection in form of steel plates located in front of the wall (figure 2) flush with the beach slope to suppress local scour. Bed profiles have been recorded as well as overtopping at the end of each test. It should be noted that the original experiment was scheduled to have a rigid flat bed but due to funding constraints, the beach material from a related former project were used. From this former beach nourishment project some characteristic behaviour of the beach is reported in the beach nourishment study of Frandsen et al. (2015).
On the wall are mounted 22 PCB (model 113B26; max capacity of 6895 kPa) and 5 Kistler (model 4073A50; max capacity of 12500 kPa) pressure sensors with 20 cm spacing. Higher load range PCB sensors (model 113B24; max capacity of 13790 kPa) are used in part on parapets and to measure jet pressure. The horizontal jet beam has pressure sensors with 3.3 cm spacing. The Kistler sensor is piezo-resistive sensor whereas the PCB is a piezo-electric type of sensor. It can sample relatively fast but may suffer from thermal drift especially when the air temperature approaches zero Celsius. The pressure sensors are connected to a high-speed data acquisition system (125 kHz).
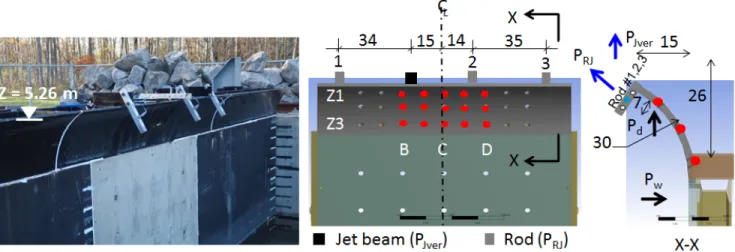
The geometry of the parapet was provided by the Department of Transportation, Québec (MTQ). To our knowledge, an optimization of this structural component has not been conducted. The parapet is 26 cm high, 15 cm wide with a curvature of 30 cm (radius). It is a relative minor geometric change to the vertical wall and some may refer to it as a small recurve. On the center parapet is mounted 15 PCB sensors with 10 cm horizontal spacing and 7.3 cm curved distance between the three center rows. Three rods are mounted with high load range PCB sensors to monitor the reflected jet pressure, as shown in figure 3. The outer roads are located 0.5 m from center and rod no. 2 is 14 cm of center. In the test series with parapets there are only 2 high load range PCB sensors in the horizontal jet beam (ID 2, 3, as shown in figure 2). It should be noted that a max. reflective jet pressure of 14.6 MPa on the parapet has actually been recorded.
It should be noted that the pressures on the coastal structural parts have not exceeded the capacity of the pressure sensors but the jet pressures did reach the limits (the tests without parapets were occasionally affected).
Figure 2. Experimental set-up (wall without parapets).
Figure 3. Experimental set-up (wall with parapets). Values in cm.
The flume is filled with fresh water with initial water depth in the flume, h0 = 3.4 – 3.9 m. The inlet conditions have
primarily been regular waves which typically transform into plunging breakers in front of the wall. A test series consist of small wave trains (5-15 peaks) traveling on an initial flat sloping 1:10 bed with initial wave height variation, H0 = 0.9 – 1.6
m and wave period, T = 4 – 8 s. Typically a test series consist of varying the initial wave height while the wave period and initial water depth was kept constant. Each test started with the same initial still water depth (re-filling the flume after each tests was necessary due to loss of water during overtopping processes at the end of flume and along it). The active control absorbing wave mechanism of the wave maker is activated between each test to aid in calming the free-surface. This
typically takes 1 hour. The most time consuming part of the daily test set-up was the preparation of the 1:10 beach slope which in average took 3.5 hours as the flume had to be emptied and re-filled. The present data set contains 53 days of tests. The test cases without the parapets were more time consuming due to the overtopping monitoring and pumping processes.
After each test overtopping is recorded. Conservation of water mass between each impact is not practicable possible due to the overtopping and overflow of water along the flume. For this reason alone repeatability within a test series is not possible. Other major reasons are real and non-physical induced wave reflectors and the bed deformation. However, many tests with the same initial conditions have been conducted.
Tests with regular wave inlet conditions and toe protection consist of a total of 95 tests without parapets and 107 tests with parapets. 70 tests were carried out for the wall with parapets without toe protection including 20 tests with irregular wave inlet conditions. It should be noted that analysis of the data set is in progress and results are represented from the initial analysis phase. Herein, wall pressures, Pw, reported are based on the Kistler sensor records and parapets pressures, Pd, are from top row only (Z1).
3 PRELIMINARY FINDINGS
In the following, peak pressures on wall and jets and the type of impact which caused them are reported. The preliminary results are listed and grouped, as follows: Regular wave inlet conditions: 1. Wall without parapets with toe protection; 2. Wall with parapets with toe protection; 3. Wall with parapets without toe protection. Irregular wave inlet conditions: 4.Wall with parapets without toe protection.
1.1 Wave impact on wall without parapets with toe protection
In this group of test series, regular waves at the inlet are travelling towards the wall with toe protection. It has been identified that two types of impacts are critical for the wall design: (1) bore-like wave fronts (flip-through impact with rise time: 0.5ms < tr <15 ms) and (2) plunging breakers with air-pocket trapped below the crest. One further need to distinguish
between low (5ms < tr <30 ms) and high (30ms < tr <100 ms) aerated impacts. Herein, is shown some selected test samples
from 6 s-test series at flume depth of 3.8 m (corresponding to the center of the wall) and initial water depth at wall of 1.3 m. A variation of initial wave height, 1m < H0 <1.5 m, resulted in a total 276 impacts recorded over a period 28 days. The
pressures on the structure are highly random and vary rapidly. The impulse duration of the peak is in the order of 1 ms and sometimes an order of magnitude lower. An example in terms of wall pressure, Pw, and vertical jet pressure at top of the
wall, PJver, and wave form near wall for a low aerated impact is shown in Figure 4. This sample had a wave group of 10
regular inlet waves with initial wave height of 1.25 m generating the maximum recorded peak pressure on the wall of 3.4 MPa (occurring on a deformed beach). A rise time, tr = 4.4 ms and peak duration, tp = 11 ms were identified. The max. jet
pressure was recorded to be greater than 7 MPa (reached the sensor limit). The waves caused large volumes of overtopping. 5-6 impacts filling of the 21 m3 overtopping basin. A comparison with incompressible pressure-impulse theory of Cooker & Peregrine (1995) are also outlined in figure 4 showing the pressure impulse, PI, distribution on the wall (z = 0 is referred to
at the bottom of the wall). The peak duration of the impact is used. It was in general observed within a test series that the max. wall pressure and max. jet pressure does not occur simultaneously. Furthermore, no impacts repeat itself in particular because of the strong interaction between reflection from the wall with incoming waves and bed deformation between the impacts which cause the wave to form and break differently.
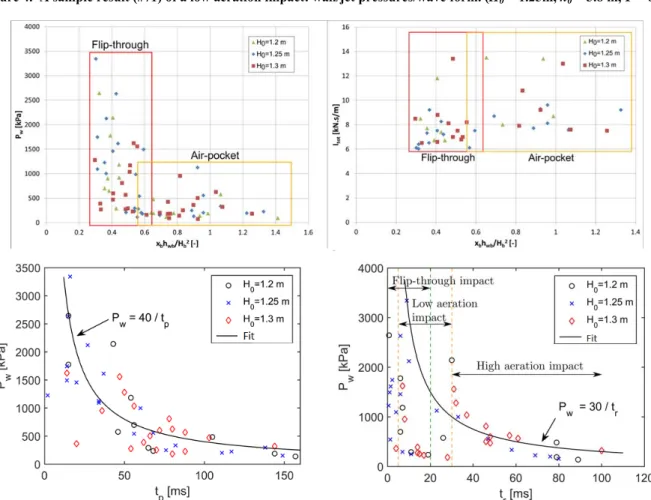
The critical impacts related to the vertical wall without parapets are summarized in figure 5 for the 6s-test series where the maximum peak wall pressure is shown as of a dimensionless parameter containing the distance from wall where the wave is breaking, xb, the breaking wave height, Hb and corresponding water depth, hwb. Results are grouped for flip-through
and aerated impacts and are shown for the max. peak pressures and the total impulse (using total impact duration). Only through the peak pressure data it was possible to clearly identify that the flip-through/low aeration impact are more critical in terms of max. peak pressure on the wall. Figure 5 also shows how max. wall pressures for different impact type vary as a function of peak and rise time. For the wall peak pressure variation an approximate exponential decay function can be fitted to the data set, Pw = a t b where t is either tr or tp and a and b are constant. As shown in Figure 5, b = -1 and a = 30 when t =
tr and a = 40 when t = tp.
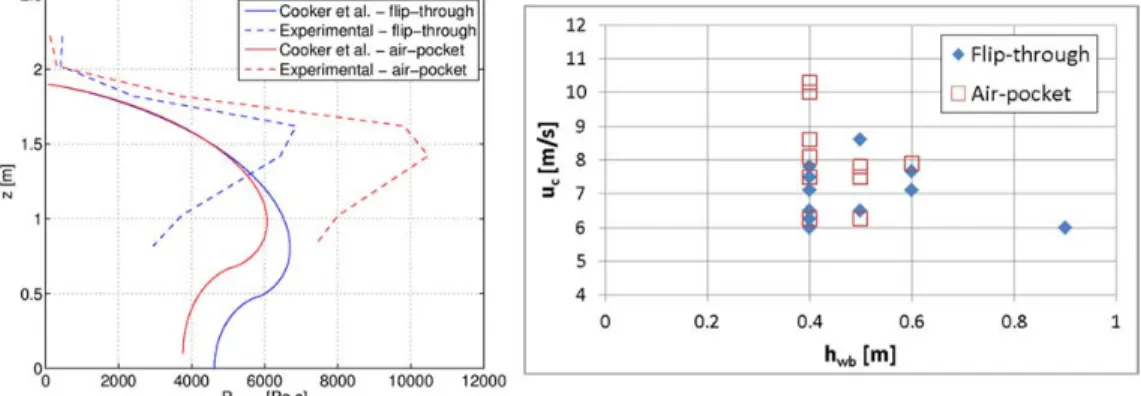
In figure 6, a further specific comparison with the pressure-impulse theory of Cooker & Peregrine (1995) between an air-pocket and flip-through impact was done. It shows that the incompressible solution tend to underpredict pressure-impulses especially for impacts where airpockets are compressed between plunging breaker and wall, i.e. when compressibility effects are expected to play a role. The impact peak duration and/or the total impact duration are highly sensitive parameters in the comparison and present a challenge for a theoretical solution especially if it should be applied in practice when to experimental data is available. Figure 6 further shows, for some selected data, the order of magnitude of the crest velocity, uc, ranging between 6 to 10.5 m/s in which the plunging breakers with airpocket(s) have the max. crest
velocities. The max jet pressures were recorded to 11.3 MPa for H0 = 1.25 m on an initial flat bed, as shown in figure 7. The
P Jv
e
r
[kPa]
Figure 4. A sample result (#71) of a low aeration impact: wall/jet pressures/wave form. (H0 = 1.25m, h0 = 3.8 m, T = 6 s).
Figure 6. Wall without parapets. Sample of pressure-impulse on wall and crest velocity. 1m < H0 <1.5 m, h0 = 3.8 m, T = 6 s.
Figure 7. Wall without parapets. Max. jet pressure (#92). H0 = 1.25 m, h0 = 3.8 m, T = 6 s (initial flat bed).
1.2 Wave impact on wall with parapets with toe protection
In these 15 days of test series the parapets were mounted on top of the vertical wall (figure 3) and inlet regular waves generated for 1 m < H0 < 1.55 m in depth 3.4 m < h0 < 3.8 m with wave periods 4 s < T < 8 s. All wave trains had 15 peaks.
Without the parapets H0 = 1.25 m was critical and most tests series has this initial flat bed conditions (and the following and
last test of the day). Without the parapets it was found that the cause of the max. wall pressure and the max. vertical jet pressures are not correlated and thus two different design conditions should be expected for each structural wall component (the vertical wall part and the parapet). This is an important point with regard to design of parapets.The test series involving a relatively minor geometric change of the wall with parapets result in a significant change of flow patterns. In general, preliminary findings indicate a tendency that the majority of the wave energy is reflected offshore with negligible overtopping. In general, the pressure on the parapet was less than 1 MPa, the wall less than 0.5 MPa, the vertical jet in the order of 1 MPa (similar to the parapet) and reflected jet 10 – 13.5 MPa with no overtopping. However, at one time the parapet did take a hit of 4.2 MPa (figure 8) and long waves of 8 s tend to cause overtopping (figure 9). With an anticipated full-scale wall height between 5 and 10m, this corresponds to a full-scale pressure on the parapet of 122 MPa using the Bagnold-Mitsuyasu law for a 10 m high wall following the generalized scaling form of the law, as suggested by Bredmose et al. (2015). The critical impact on the parapet was caused by a flip-through wave form (figure 8).
Figure 9. Critical impact wrt. parapet design (#164). Inlet: H0 = 1.25 m, T = 8 s and h0 = 3.8m (caused overtopping).
1.3 Wave impact on wall with parapets without toe protection
The toe protection was removed in these tests series with 15 impacts per test series. Based on regular wave inlet conditions, scour was observed to form rapidly. The wave impact caused sediment transport typically with sand movement offshore and gravel transport towards the beach face, as illustrated in figure 10. The wave-sediment interaction was observed occasionally to cause suspended gravel exceeding the height of the wall structure.
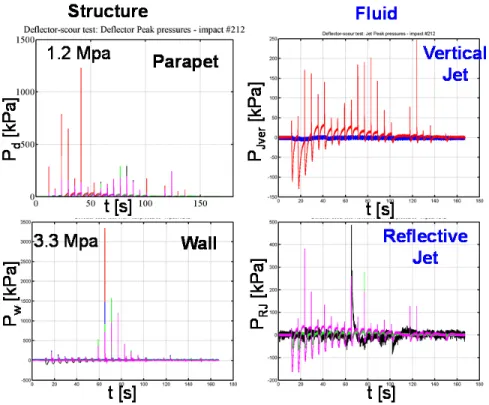
Figure 10. Suspended sediment, sediment transport, beach deformation and local scour (~20 cm/15 impacts). The removal of the toe protection had a tendency of resulting in wall pressures almost as if the parapets were not present showing that wave energy was transferred partly as wave impact on wall and partly as wave-sediment interaction processes rather than reflecting the wave energy offshore. Some scour cases showed that the wall takes a hit of 3.3 MPa for the wall configuration with parapet, as outlined in figure 11. Some tests cases resulted in scour depth of about 20 cm caused by 15 impacts.
Figure 11. Critical wall impact without toe protection (#212). Inlet: H0 = 1.25 m, T = 8 s and h0 = 3.8m.
1.4 Wave impact on wall with parapets without toe protection – irregular wave inlet condition
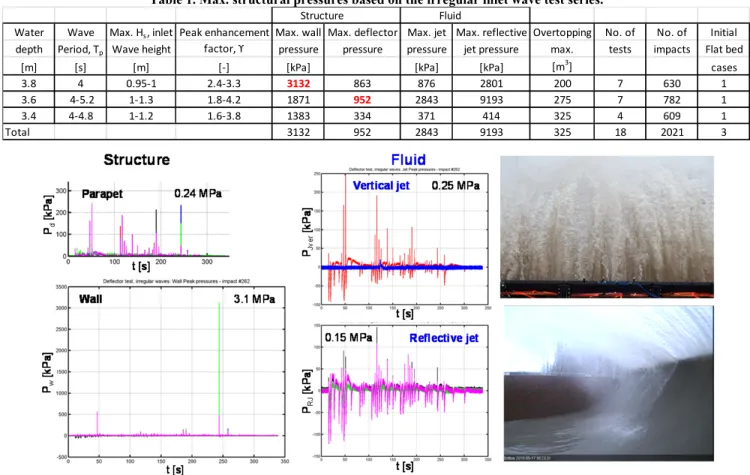
The final test series consist of irregular inlet wave conditions represented by JONSWAP spectra in accordance to DNV-OS-J101 (2010). The inlet spectra are shown for the 3 water depth test series which caused critical structural pressures are shown in figure 12. The test series duration lasted 5-15 minutes and more than 600 impacts were recorded per water depth, as listed in table 1. Each water depth test series were initiated on a flat bed. The critical structural pressure was found on the wall to be 3.1 MPa (figure 13). It was caused by a flip-through type of impact based on an inlet spectrum with a peak enhancement factor, γ, of 2.4, a significant wave height, Hs = 0.95 and peak period, Tp of 4 s. The majority of the wave
energy was absorbed partly by wave-scour interaction processes and partly obtained by the wall structure and negligible energy reflected offshore. This irregular inlet wave based case resulted in similar max. peak pressure at the wall as the test case based on regular waves generated on the wall without parapets and toe protection.
Table 1. Max. structural pressures based on the irregular inlet wave test series.
Figure 13. Critical wall impact without toe protection (#262). Inlet: Hs = 0.95 m, Tp = 4 s, γ = 2.4 and h0 = 3.8m.
Deflected jets at h0 = 3.6 m: critical parapet case (#274) – Pd = 952 MPa.
4 PRELIMINARY CONCLUSIONS AND FURTHER WORK
Preliminary analysis results have been presented in terms of wave induced pressures on a vertical coastal wall mounted at the end of a 1:10 porous-elastic sloping beach (mean sediment diameter of 12 mm). Wave impacts on walls are short duration loading processes which can cause relatively high peak pressure on walls and their parapets. The impact processes are complex. Relative small entrainment of air affects the impact forces and jet pressures. In the present test series, add-on complexity occurs due to beach deformation. The beach behaviour makes it impossible to generate repeated impacts within a test series. Further add-on complexities are present for the case without toe protection due to scour processes.
The critical type of impact on the wall and parapet relates to low aeration and flip-through impacts. The maximum pressures measured on the wall are 3.4 MPa and 4.2 MPa on the parapet. It was found that critical jet pressures are uncorrelated with maximum wall pressures. Therefore, different design conditions must be specified for the design of the wall and parapets. The parapet inclusion is an efficient way of coastal protection. From an overtopping and structural load reduction view point, the wall with parapet configuration works well for most cases tested. It is, however, critical to have a scour solution or some other form protection in front of the wall. It was shown that irregular wave inlet conditions can cause similar order of pressure on the structure as regular wave inlet conditions.
With an anticipated full-scale wall height between 5 – 10m, these max. pressures correspond to a full-scale pressures of 87 MPa on the wall and on the parapet of 122 MPa using the Bagnold-Mitsuyasu law for a 10 m high wall.
It should be noted that the key pressures reported herein may not be max. peak pressure. They may be higher as it was identified that 20 cm spacing between pressure sensors on the wall is inadequate and therefore critical peak pressures may be missed. The 7.3 cm spacing on the curvature of the parapet may also be inadequate since it was identified the that the spacing of 3 cm on the jet beam monitoring bar showed pressures greater than for example 10 MPa but the adjacent sensor 3 cm apart show negligible pressures, i.e. highly localized pressures. Other errors may be introduced by trapped waves due to the side walls, the acoustic waves in front of the wall, the wind, and reflections at the wave maker. In general, the active reflection compensation system of the wave maker could not cope with the large amplitude return waves in front of the wave maker. The worst cases were related to the cases with parapets with irregular inlet wave conditions. When using the wave absorption mechanism, spurious long waves were introduced, as identified between tests to speed-up the calming
Structure Fluid
Water Wave Max. Hs, inlet Peak enhancement Max. wall Max. deflector Max. jet Max. reflective Overtopping No. of No. of Initial
depth Period, Tp Wave height factor, ϒ pressure pressure pressure jet pressure max. tests impacts Flat bed
[m] [s] [m] [‐] [kPa] [kPa] [kPa] [m3]
cases
3.8 4 0.95‐1 2.4‐3.3 3132 863 876 2801 200 7 630 1
3.6 4‐5.2 1‐1.3 1.8‐4.2 1871 952 2843 9193 275 7 782 1
3.4 4‐4.8 1‐1.2 1.6‐3.8 1383 334 371 414 325 4 609 1
down process of the free-surface motions. After, the first impact, it was further found that even for simple regular inlet wave conditions, the incoming waves near wall have complicated non-pure wave forms due to the interaction between the real reflected wave from the wall and the incoming waves. All cases with parapets, typically contained real reflective jets resulting in spilling breakers travelling fast offshore (towards the wave maker), i.e. the wavemaker had to withstand certain impacts. Numerical experiments have been initiated in an attempt to answer some of the physical modelling issues including scale effects (Tremblay & Frandsen, 2016).
The present study has investigated a vertical wall with fixed geometry of the parapet on a constant initial beach slope. One would need to tests other wall configurations, especially with more closely spaced sensors, on a range of beach slopes with reference to a smooth bed. Then different beach material may be tested. Investigations of scour solutions are essential. ACKNOWLEDGEMENT
The authors would like to thank Le ministère des Transports du Québec and Le ministère de la Sécurité publique du Québec for master minding and funding this coastal protection initiative done in preparation for climate change predictions. Thanks to the laboratory staff for helping with planning and preparing the experiment. The funds received from the INRS, centre Eau Terre Environnement, are also gratefully acknowledged.
REFERENCES
Bullock, G.N, Obhrai, C., Peregrine, D.H. & Bredmose, H. 2007. Violent breaking wave impacts. Part 1: Results from large-scale regular wave tests on vertical and sloping walls. Coastal Engineering 54, 602-617.
Bredmose, H., Bullock, G.N. & Hogg, A. J. 2015. Violent breaking wave impacts. Part 3. Effects of scale and aeration. Journal of Fluid Mechanics 765, 82–113.
Cooker, M.J. & Peregrine, D.H. 1995. Pressure-impulse theory for liquid impact problems. Journal of Fluid Mechanics 297, 193-214. Cuomo, G., Allsop, W., Bruce, T. & Person, J. 2010. Breaking wave loads at vertical seawalls and breakwaters. Coastal Engineering
57(4).
DNV-OS-J101 2010 Design of offshore wind turbine structures. Det Norske Veritas.
Frandsen, J. B. & Bérubé, F. 2015. Large scale experimental wave impact on walls in the Québec Coastal Physics laboratory.
Proceedings of the ASME 34th Intl. conference on Ocean, Offshore and Arctic Engineering. St. John`s, Newfoundland,
Canada.
Frandsen, J. B., Xhardé, R, Bérubé, F. & Tremblay, O. G. 2015. Large scale experimental storm impact on nourished beach using cobble-gravel-sand mix. Proceedings of the ASME 34th
Intl. conference on Ocean, Offshore and Arctic Engineering. St.
John`s, Newfoundland, Canada.
Hofland, B., Kaminski, M. L. & Wolters, G. 2010. Large scale wave impacts on vertical wall. 32th Intl. Conf. Coastal Engrg., China. Jaime, F. F., Lara, J. L., Losada, I. J. & Stagonas, D. 2014. Impact induced pressure distributions at the underside of wave recurves.
Proceedings of the 5th Intl. Conference on the Application of Physical Modelling in Coastal and Port Engrg. and Science, Varna, Bulgaria.
Kiger, K. T. & Duncan, J. H. 2012. Air-entrainment mechanisms in plunging jets and breaking waves, Annual Review of Fluid Mechanics 44, 563-596.
Lafeber, W., Brosset, L. & Bogaert, H. 2012. Elementary loading processes (ELP) involved in breaking wave impacts: findings from Sloshel project. Proceedings of 22nd
Intl. Offshore and Polar Engineering Conference, Rhodes, Greece.
Oumeraci, H., Klammer, P. & Partenscky, H. W. 1993. Classification of breaking wave loads on vertical structures. Journal of Waterway, Port, Coastal, and Ocean Engineering 119(4).
Oumeraci, H. 1994. Review and analysis of vertical breakwater failures – lessons learned. Coastal Engineering 22, 3-29.
Oumeraci, H., Kortenhaus, A, Allsop, W., de Groot, M., Crouch, R., Vrijling, H., Voortman, H. 2001. Probabilistic design tools for vertical breakwaters. Balkema.
Oumeraci, H. 2010. Selected research projects using the Grosser Wellenkanal (GWK). Proceedings workshop of the celebration of the 60th anniversary of Tainan Hydraulic laboratory.
Peregrine, D. H. 2003. Water-wave impact on walls. Annual Review of Fluid Mechanics 35, 23–43.
Shiravani, G., Vousdoukas, M., Schimmels, S. & Stagonas, D. 2014. A methodology for measuring the velocity and thickness of wave-induced up-rushing jets on vertical seawalls and superstructure. Proceedings of the 34th
Intl. conference on Coastal Engineering, Seoul, Korea.
Stagonas, D., Lara, J. L., Losada, I. J., Higuera, P., Jaime, F. F., Galani, K., Dimas, A., Vousdoukas, M., Kudella, M., Muller, G. 2014. Large scale measurements of wave loads and mapping of impact pressure distribution at the underside of wave recurves. Proceedings of the HYDRALAB IV Joint User Meeting, Lisbon, Portugal.
Tremblay, O. G. & Frandsen, J. B. 2016. Numerical simulations of compressibility effects in free-surface flow resulting from wave impacts on an idealized seawall. Proceedings of the 6th
Intl. Conference on the Application of Physical Modelling in Coastal and Port Engrg. and Science, Ottawa, Canada.