HAL Id: hal-01896717
https://hal.archives-ouvertes.fr/hal-01896717
Submitted on 4 Mar 2021
HAL is a multi-disciplinary open access
archive for the deposit and dissemination of
sci-entific research documents, whether they are
pub-lished or not. The documents may come from
teaching and research institutions in France or
abroad, or from public or private research centers.
L’archive ouverte pluridisciplinaire HAL, est
destinée au dépôt et à la diffusion de documents
scientifiques de niveau recherche, publiés ou non,
émanant des établissements d’enseignement et de
recherche français ou étrangers, des laboratoires
publics ou privés.
3D bifurcations characterization for intra-cranial
aneurysms prediction
Anass Nouri, Florent Autrusseau, Romain Bourcier, Alban Gaignard, Vincent
l’Allinec, Céline Menguy, Joëlle Véziers, Hubert Desal, Gervaise Loirand,
Richard Redon
To cite this version:
Anass Nouri, Florent Autrusseau, Romain Bourcier, Alban Gaignard, Vincent l’Allinec, et al.. 3D
bifurcations characterization for intra-cranial aneurysms prediction. SPIE Medical Imaging, Feb 2019,
San Diego, CA, United States. �10.1117/12.2504626�. �hal-01896717�
3D Bifurcations characterization for intra-cranial aneurysms
prediction
Anass Nouri
a,c, Florent Autrusseau
b, Romain Bourcier
a, Alban Gaignard
a, Vincent L’Allinec
a,
Celine Menguy
a, Joelle Veziers
b, Hubert Desal
a, Gervaise Loirand
a, and Richard Redon
a aDepartment of Diagnostic and Interventional Neuroradiology, Hospital Guillaume et Ren´
e
Laennec; INSERM, UMR1087, l’institut du thorax, CHU de Nantes, France
b
INSERM U1229-RMeS, Laboratory of Regenerative Medicine and Skeleton, University of
Nantes, UFR Odontologie, 1, place Alexis Ricordeau, 44042, Nantes, France
c
Vision Lab. Isen Brest, L@bISEN, 20 rue Cuirass´
e Bretagne, CS 42807, 29228 Brest Cedex2,
France
ABSTRACT
An aneurysm is a vascular disorder represented by a ballooning of a blood vessel. The blood vessel’s wall is distorted by the blood flow, and a bulge forms there. When ruptured, the aneurysm may cause irreversible damage and could even lead to premature death. Intra-cranial aneurysms are the ones presenting the higher risks. In this work, thanks to a graph based approach, we detect the bifurcations located on the circle of Willis within brain mice cerebral vasculature. Once properly located in the 3D stack, we characterize the cerebral arteries bifurcations, i.e. we gather several properties of the bifurcation, such as their angles, or area cross section, in order to further estimate geometrical patterns that can favor the risk of occurrence of an intra-cranial aneurysm. Effectively, apart from genetic predisposition, and environmental risk factors (high blood pressure, smoking habits, ...) the anatomical disposition of the brain vasculature may influence the chances of an aneurysm to form. Our objectives in this paper is to obtain accurate measurements on the 3D bifurcations.
1. INTRODUCTION
1.1 Project Context
An aneurysm is a bulge of an artery, it may occur on any artery of the human body. The formation of aneurysms could be due to various factors that lead to a weakened vessel wall. Hypertension may increase the risk of formation of an aneurysm and it has recently been showed that a genetical anomaly1could also cause aneurysms. The main complication of aneurysm is the rupture, it may then lead to a subarachnoid hemorrhage2and at last to the death. Commonly, intra-cranial aneurysms are monitored thanks to Computed Tomography Angiography or Magnetic Resonance Angiography. The imaging strategy produces a digital 3D stack. A cerebral angiography thus displays the full brain vasculature as a 3D volume. Regular Magnetic Resonance Imaging, and more particularly T1 acquisitions, can be exploited, but will necessitate a proper blood vessels segmentation in order to be able to distinguish the aneurysms.
This work is part of a wide national research project3 (the ICAN project) which aims to understand the multiple factors that may favor the formation of saccular intra-cranial aneurysms along the4,5 circle of Willis. During the first part of the project, mice are stressed (drinking only salt water) in order to induce saccular intra-cranial aneurysms, and then go through micro scan acquisition. In the second part of this project, the tools for aneurysms detection will be applied directly on human acquisition, on MRI (T1) acquisitions. In this project, we are particularly interested in investigating the saccular aneurysms occurring onto the 9 main bifurcations composing the circle of Willis. We thus need to correctly detect these bifurcations. Unlike most studies from
Further author information: (Send correspondence to F.A.)
F.A.: E-mail: [email protected], Telephone: (+33)240412999
During this project, the author A.N. was with the the lab. “Institut du Thorax, INSERM, UMR 1087, Nantes”, his post-doc was funded by grant ANR-520 15-CE17-0008.
the literature, in this work, the volumes are acquired using a micro-scan instead of MRA or MRI acquisitions. Mice went through a Baryum Sulfate injection in the vascular tree, prior to a cerebral micro-scan acquisition. We have at our disposal the micro scan acquisition of 22 mice brains.
1.2 Related works
In the literature, many studies are devoted to the detection of blood vessels bifurcations, these works may focus on the vascular tree within the liver,6 the lungs7–9 or even10 the retina. Some works do focus on cerebral11,12 vasculature. The reader is directed to two interesting reviews13,14for further details on the various methods for vessels segmentation.
Although many studies can be found on the detection of blood vessels in 3D imaged stacks,13,14fewer works can be found on the arteries characterization. As explained in15the detection of bifurcations in a vascular tree is very important. In their works, the authors propose a parametric geometric deformable model in order to fit the actual 3D medical images of bifurcations. A common method for detecting blood vessels directions, and hence possibly detect bifurcations within CT or MRA images is to use16,17 the Eigenvalues of the Hessian matrix. In,17 the authors use a multi-scale analysis to extract blood vessels of various diameters. They propose several models of vessels, such as Gaussian, toroidal or elliptical-like cross-sections vessels. Using the Eigenvectors and Eigenvalues of the Hessian matrix, the authors then estimate the center-lines and are further able to detect the junctions formed by the modeled vessels. Some authors opt for the use of variational region growing methods, such as in,7 where the authors had to face the delineation of the lung within CT images, in order to properly extract the pulmonary vascular tree. Such methods may suffer from weak performances against the smallest vessels. When cerebral vasculature is considered, it is actually rather difficult to use learning based methods, as there is a significant variability5,11 amongst different vasculatures. In5 a skeletonization method is used to extract the vessels center-lines, but seed points have to be manually determined.
As was pointed out in18 , it has been showed that the geometry of the bifurcation correlates quite well with various diseases, as it influences the fluid mechanics of the blood flow. Again, works in19 show that fluid dynamics play an important role in the formation of aneurysms. Authors in20 studied the deviation of the saccular aneurysm away from the bifurcation. Their study was dedicated to aneurisms occurring on the internal carotid artery. They mostly focused on the angle formed by the three branches of the bifurcation. They measured the bifurcation angles as well as the shift of the aneurysmal neck away from the mother branch of the artery. Among the various factors that may affect the fluid dynamics of the blood flow, the geometry of the bifurcations (angles), the distance separating two consecutive bifurcations, the tortuosity of the artery branch, the diameters of the arteries at the bifurcation are all the parameters that have an impact on the blood speed, and thus the risk of formation of an aneurysm. In this work, we thus intend to propose a method that first searches for the bifurcations, and then automatically computes the various parameters characterizing the arterial tree (see the above mentioned characteristics).
This paper is organized as follows: We first present in section2, the method we use to detect the bifurcations within the 3D stack. In section 3, we propose some new methods to measure the bifurcation’s geometrical properties, such as the angles, geodesic distance, arteries cross-section, or the branches tortuosity. We finally conclude this study in section 4.
2. AUTOMATIC 3D BIFURCATION DETECTION
In this paper, we are interested in the characterization of 3D bifurcations in the cerebral vasculature. Therefore, the first stage of the characterization pipeline consists in the automatic detection of the bifurcations in the vascular tree. We present in this section an accurate and fast approach that detects and provides 3D coordinates of the bifurcations centers in 3D stacks. In the following, a 3D volume is denoted by U .
2.1 Graph-based detection
We first compute the 3D skeleton S associated to the stack U using the method21proposed by Lee at al. . To each voxel si of S are associated its 3D coordinates si = (xi, yi, zi). Exploiting the skeleton instead of the 2D slices
to accurately detect the center of the bifurcation. Afterwards, a non oriented graph G = (V, E, w) is constructed on the entire 3D skeleton where V represents the set of nodes, E ∈ V × V the set of edges and w(vi, vj) the
weight of the edge e(vi, vj) ∈ E connecting the nodes viand vj. Similarly to S, to each node vi∈ V of the graph
are associated its 3D coordinates vi = (x, y, z). The significant benefits from using the graph structure can be
summarized in 3 points: 1) The graph allows to scour the skeleton (and hence the stack) in 3D thus avoiding the 2D slice by slice analysis. This preserves the 3D information that may be lost when moving to 2D analysis. 2) Accurate localization of the bifurcation center in the 3D space. 3) Only locate the bifurcations of interest along the Circle of Willis, since this is where most intra-cranial aneurysms11 occur.
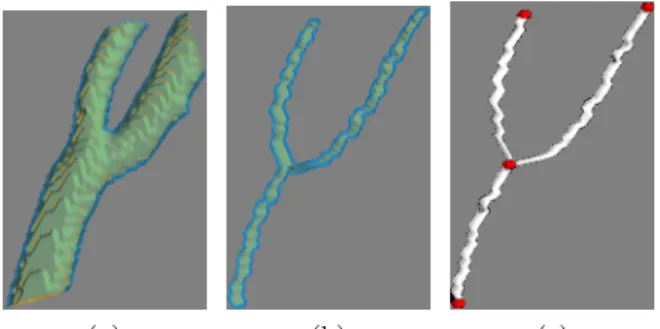
(a) (b) (c)
Figure 1: (a), (b) and (c) respectively represent a bifurcation, its 3D skeleton and the graph with red nodes and white edges.
It is important to note that the graph skeleton of a bifurcation has a Y-junction shape and contains four nodes (see Fig. 1), one node at the center of the 3D skeleton bifurcation and the three remaining at the end points of the three branches. Therefore, if any of the graph nodes has three neighbors, this node is considered as the center of the bifurcation. Such selected point undoubtedly represents a true bifurcation.
2.2 Results
As previously explained, we are strongly interested by the detection of bifurcations belonging to the Circle of Willis since11 intra-cranial aneurysms mainly occur there. Hence, we have tested our approach on different 3D cerebral vasculatures in order to verify if all the bifurcations located in the circle of Willis are detected. We have tested our approach on different 3D cerebral vasculature stacks. Figure2(a) presents a gray level 3D stack of size 1185 × 1008 × 1008 acquired using a micro scan. We can notice that the proposed approach detects all possible 3D bifurcations along the Circle of Willis which are the bifurcations of interest.
2.2.1 Comparison with the state of the art
We compare the proposed approach with two methods of the literature15,22 considering the Vascusynth23,24 database. This database consists of 12 randomly generated 3D stacks with a varying number of bifurcations. The bifurcation centers are given in the form of 3D coordinates (x, y, z).
A subset of the Vascusynth database constituted of 10 volumes with 16 bifurcations each is considered to compare the three methods. We used cumulative histograms of distances from detected center bifurcations (DB) to the closest ground truth locations (GT). Fig. 3 presents the obtained cumulative histograms. We can notice from these histograms that our approach succeeds in detecting all the bifurcations located at most 19 pixels away from the ground truth centers (Fig. 3(a)) while the two competing methods15,22 both require a distance greater than 50 pixels to achieve a complete detection. One can also notice that the curve associated to our approach (Fig. 3(a)) is steeper than the ones of the two competing methods (Figure3(b)). This means that the majority of the bifurcations have been detected with high precision.
Figure 2: Detected bifurcations in a 3D mouse cerebral vasculature. All possible bifurcations in the 3D stack and particularly those located in the Circle of Willis are correctly detected.
0 50 Distance (pixels): DB to GT 0 0.5 1 Pro b a b ili ty 100 Vascusynth 19 (a) (b)
Figure 3: Cumulative histograms of distances between the predicted bifurcation localizations and the ground truth localizations of 10 volumes with 16 bifurcations each:23,24 (a) Our approach and (b) approaches of15,22 (Fig. from15).
3. 3D BIFURCATIONS CHARACTERIZATION
In this section, we present a geometric characterization of 3D bifurcations which is based on different intrinsic attributes of the detected bifurcations geometry. Geometrical characterization of intra-cranial bifurcations can be analyzed for saccular aneurysms prediction18 purpose. This constitutes the second part of the project as described in the introduction.
In the following, we propose some methods to automatically measure the bifurcations angles, their cross-section, as well as the branches’ tortuosity. In this paper, we voluntarily omit the measures of the geodesic distances between bifurcations, as a simple count of the skeleton’s voxels precisely determines the length of the branch.
3.1 Angles computation
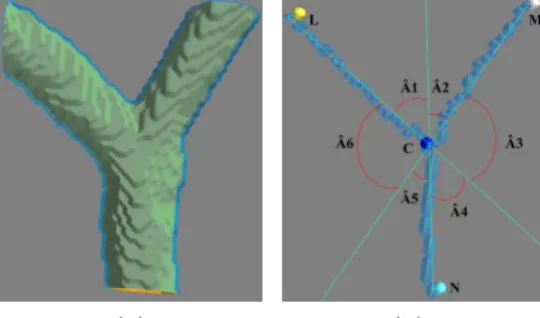
Aneurysms are more prevalent at bifurcations with greater bifurcation angles18(wider angle between the daughter branches). Quantifying automatically this anatomical attribute is of great interest for aneurysms prediction. We thus compute all possible angles in the bifurcations as illustrated in Fig. 4(b). In order to best illustrate the measured angles, a 3D bifurcation B was extracted from the stack within a 20 × 20 × 20 3D block. Then we consider its 3D skeleton SB as well as the graph constructed on the latter GB. Figure 4(b) presents the 3D
skeleton SB with the four graph nodes: the bifurcation center vC, and the three remaining nodes vL, vM, vN
representing the bifurcation end points. Once these nodes defined, the bifurcation angles can be computed as:
c
A1 = atan2(|| − CN•CL||2, −CN · CL) (1)
where the vectors CN and CL are defined respectively as CN = N − C, CL = L − C. The function atan2(y, x) computes the arc tangent of all four quadrants, providing a result in [−π, π]. The symbols•and · respectively
represent the cross and dot product. The notation ||.||2refers the second norm. Each remaining angle is computed
similarly to cA1.
(a) (b)
Figure 4: (a) Bifurcation angles and (b) Graph and target angles.
We have compared the angle values obtained from our approach with those measured using the well known FIJI (ImageJ)25 software. Table1 presents these results. We can notice that the angle values provided by our approach are highly correlated with those given by FIJI. Moreover, these angles are automatically computed, without any user intervention.
Table 1: Comparison between the angle values measured using the FIJI software and those obtained by our approach.
Angles A1 A2 A3 A4 A5 A6 FIJI software 45.70 34.86 100.27 45.70 34.86 100.27 Our approach 45.73 34.87 100.29 45.73 34.87 100.29
3.2 Branches area sections
Yet another significant anatomical property that may explain the occurrence of intra-cranial aneurysms is the thickness of the arteries. Considering a bifurcation B of center vC in the 3D skeleton S, we delimit the latter
with three voxels A1, A2and A3located at a distance of 30 voxels from the bifurcation center vCon each branch.
The aim is to compute three discrete plans P1, P2and P3 in the 3D space which will cut each respective branch
(b1, b2, b3) of the bifurcation B through three respective skeleton voxels A1, A2 and A3.
Suppose that we have to compute the discrete plan P1 cutting the branch b1 through the voxel A1. For this,
we select a voxel A1N ∈ b1 nearby A1(we choose a distance equal to seven voxels) in order to have a cut plane
P1 tangent to the voxel A1 and perpendicular to the vector A1A1N. Once the voxels A1 and A1N determined,
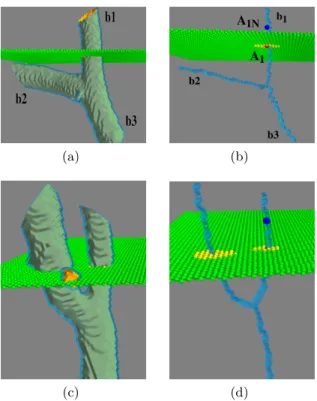
cutting its branch b1. Figure5(b) shows the 3D skeleton of5(a). The voxels located at the intersection between the 3D skeleton and the discrete plane represent the cross section of the branch (see yellow voxels in figure5(b)). These can be easily selected since the 3D skeleton as well as the plan are represented as 3D matrices. The area section is then simply obtained by counting the intersection vertices (yellow vertices). In order to cope with branches having different localized cross sections areas, we propose to compute three different cut planes with three different cross section areas. The final branch cross section area is defined as the average of the three computed areas.
(a) (b)
(c) (d)
Figure 5: Cut plan through the branches of a 3D bifurcation. Left: 3D bifurcations with cutting plane, and right: skeleton and cross section (see text for details).
In some cases, the angle between the daughter branches of a 3D bifurcation is relatively small. This leads to a plane cutting the bifurcation through two branches as presented in5(c). Also, we can remark from figure
5(d) presenting the 3D skeleton of5(c) that the intersection voxels Ii colored in yellow are related to the two
branches at the same time. The aim now is to distinguish between the intersection voxels related to each branch in order to compute their different cross section areas. To tackle this problem, we propose a simple and fast clustering approach. Having the coordinates of the voxel A (red voxel in figure5(d)) through which the plane cuts the bifurcation, we compute the euclidean distance Di between A and all the intersection voxels Ii(colored
in yellow in figure5(d)) and sort them. Afterwards, a clustering method is applied on the inter-voxels distances to separate the two branches.
3.3 Tortuosity estimation
Artery tortuosity is significantly associated26with intracranial aneurysm. Among the tortuosity definitions, we find the curvature degree. Hence, we propose in this section an approach computing the tortuosity of an artery based on the curvature of its voxels. Given a 3D skeleton S0 of an artery, normal vectors of binary voxels are
Algorithm 1 Cut plane of a 3D bifurcation branch in the 3D space
AB ← (Bx− Ax, By− Ay, Bz− Az)
X ← [1 : 120] Y ← [1 : 120]
indicesplan ← List (Indices of voxels constituting the cut plan) for each i in X do
for each j in Y do
z ← (−(ABx∗ (i − Ax)) − (ABy∗ (j − Ay)))/ABz+ Az
if z < 120 then z = bzc indicesplan.push(i, j, z) end if end for end for return indicesplan
first computed and oriented in the same direction (Fig. 6). Then, the curvature of a voxel Si0 is defined as:
Curvature(Si0) = 1 |N (S0 i)| |N (S0 i)| X j=i−1 δj (2)
where |N (Si0)| is the cardinality of the neighborhood of Si0 and δj represents the difference between the normal
vectors, such as:
δi=
(nj− ni) · (Sj0 − Si0)
||S0 j− S0i||22
with Sj0 ∼ Si0 (3)
where ni and nj represent the normal vectors defined on the voxels Si0 and Sj0. The symbol ∼ refers to
adjacency.
Finally, the tortuosity of a 3D artery is defined as the average of its voxels’s curvature. Figure7presents the tortuosity of an artery.
Figure 6: Oriented normal vectors on each skeleton voxel Si0 .
4. CONCLUSION AND PERSPECTIVES
Neuroradiologists suspect that the apparition of intra-cranial saccular aneurysms may be correlated with some particular anatomical properties of the cerebral vasculature. Indeed fluid mechanics of the blood flow within the cerebral arteries could induce the aneurysms. The bifurcations are of particular interest. In this work, we have presented a simple full automatic method for the bifurcation detection and characterization in 3D cerebral vasculature. The proposed approach was tested on different 3D micro scan acquisitions and the associated results show that all bifurcations have been detected and especially those located in the circle of Willis which was our focus in this work. We also compared the proposed approach with two state-of-the-art methods using a ground
(a) Voxel representation of a 3D skele-ton artery
(b) Tortuosity map of (a)
Figure 7: Tortuosity of a 3D artery.
truth providing 3D coordinates of center bifurcations generated randomly with an increasing bifurcation number. Results show that the proposed approach is very competitive and outperforms the two considered state-of-the-art approaches.
Thanks to the use of a 3D graph applied onto the vasculature skeleton, we can accurately determine the bifurcation centers. Once the bifurcations detected, we have proposed some methods to characterize the various geometrical features of the bifurcation. We can thus measure the angles formed by the daughter branches, the cross-sections of the three arteries composing the bifurcation, as well as the tortuosity of the mother branch. The proposed automatic computation of the geometrical features proved to fit very accurately the ground truth (manual measurements). In future works the proposed method will be tested on human brain acquisitions (Magnetic Resonance Angiography volumes). We will also compare the various features estimations (cross-sections, tortuosity) with ground truth measurements (collected from experts). Moreover, we will also conduct an in depth study on the influence of the bifurcation geometry on the probability of aneurysm occurence.
REFERENCES
[1] Bourcier, R., Scouarnec, S. L., Bonnaud, S., et al., “Rare coding variants in angptl6 are associated with familial forms of intracranial aneurysm,” American Journal of Human Genetics 102, 133–141 (Jan. 2018). [2] Ajiboye, N., Chalouhi, N., Starke, R. M., Zanaty, M., and Bell, R., “Unruptured Cerebral Aneurysms:
Evaluation and Management,” The Scientific World Journal 2015, 1–10 (2015).
[3] Bourcier, R., Chatel, S., Bourcereau, E., et al., “Understanding the Pathophysiology of Intracranial Aneurysm: The ICAN Project,” Neurosurgery 80(4), 621–626 (2017).
[4] Kayembe, K. N., Sasahara, M., and Hazama, F., “Cerebral aneurysms and variations in the circle of Willis,” Stroke 15(5), 846–850 (1984).
[5] Bogunovic, H., Pozo, J. M., Cardenes, R., Roman, L. S., and Frangi, A. F., “Anatomical labeling of the circle of willis using maximum a posteriori probability estimation,” IEEE Transactions on Medical Imaging 32(9), 1587–1599 (2013).
[6] Friman, O., Hindennach, M., K¨uhnel, C., and Peitgen, H. O., “Multiple hypothesis template tracking of small 3D vessel structures,” Medical Image Analysis 14(2), 160–171 (2010).
[7] Orkisz, M., Hern´andez Hoyos, M., P´erez Romanello, V., P´erez Romanello, C., Prieto, J. C., and Revol-Muller, C., “Segmentation of the pulmonary vascular trees in 3D CT images using variational region-growing,” Irbm 35(1), 11–19 (2014).
[8] Fotin, S. V., Reeves, A. P., Biancardi, A. M., Yankelevitz, D. F., and Henschke, C. I., “Standard Moments Based Vessel Bifurcation Filter for Computer-Aided Detection of Pulmonary Nodules,” SPIE Medical Imag-ing 7624, 1–10 (2010).
[9] Xiong, G., Chen, C., Chen, J., Xie, Y., and Xing, L., “Tracking the motion trajectories of junction structures in 4D CT images of the lung,” Physics in Medicine and Biology 57(15), 4905–4930 (2012).
[10] Mar´ın, D., Aquino, A., Geg´undez-Arias, M. E., and Bravo, J. M., “A New Supervised Method for Blood Vessel Segmentation in Retinal Images by Using Gray-Level and Moment Invariants-Based Features,” IEEE Transactions on Medical Imaging , 1–13 (2010).
[11] Robben, D., T¨uretken, E., Sunaert, S., Thijs, V., Wilms, G., Fua, P., Maes, F., and Suetens, P., “Simultane-ous segmentation and anatomical labeling of the cerebral vasculature,” Medical Image Analysis 32, 201–215 (2016).
[12] Mill´an, R. D., Dempere-Marco, L., Pozo, J. M., Cebral, J. R., and Frangi, A. F., “Morphological charac-terization of intracranial aneurysms using 3-D moment invariants,” Medical Imaging, IEEE Transactions on 26(9), 1270–1282 (2007).
[13] Kirbas, C. and Quek, F., “A review of vessel extraction techniques and algorithms,” Computing Sur-veys 36(2), 81–121 (2004).
[14] Lesage, D., Angelini, E. D., Bloch, I., and Funka-Lea, G., “A review of 3D vessel lumen segmentation techniques: Models, features and extraction schemes,” Medical Image Analysis 13(6), 819–845 (2009). [15] Zhao, M. and Hamarneh, G., “Bifurcation Detection in 3D Vascular Images Using Novel Features and
Random Forest,” in [IEEE International Symposium on Biomedical Imaging (IEEE ISBI) ], 421–424 (2014). [16] Frangi, A. F., Niessen, W. J., Vincken, K. L., and Viergever, M., “Multiscale vessel enhancement filtering,” Medial Image Computing and Computer-Assisted Invervention - MICCAI’98. Lecture Notes in Computer Science, vol 1496 1496, 130–137 (1998).
[17] Krissian, K., Malandain, G., Ayache, N., Vaillant, R., and Trousset, Y., “Model-Based Detection of Tubular Structures in 3D Images,” Computer Vision and Image Understanding 80(2), 130–171 (2000).
[18] Bor, A. S. E., Velthuis, B. K., Majoie, C. B., and Rinkel, G. J., “Configuration of intracranial arteries and development of aneurysms,” Neurology 70(9), 700–705 (2008).
[19] Otani, T., Nakamura, M., Fujinaka, T., Hirata, M., Kuroda, J., Shibano, K., and Wada, S., “Computational fluid dynamics of blood flow in coil-embolized aneurysms: Effect of packing density on flow stagnation in an idealized geometry,” Medical and Biological Engineering and Computing 51(8), 901–910 (2013).
[20] Sakamoto, S., Ohba, S., Shibukawa, M., Kiura, Y., Okazaki, T., Arita, K., and Kurisu, K., “Characteristics of aneurysms of the internal carotid artery bifurcation,” Acta Neurochirurgica 148(2), 139–143 (2006). [21] Lee, T.-C., Kashyap, R., and Chu, C.-N., “Building Skeleton Models via 3-D Medial Surface/Axis Thinning
Algorithms,” in [CVGIP: Graphical Models and Image Processing ], 462–478 (1994).
[22] Macedo, M., Galarreta-Valverde, M., Mekkaoui, C., and Jackowski, M., “A centerline-based estimator of vessel bifurcations in angiography images,” in [SPIE Medical Imaging 2013: Computer-Aided Diagnosis ], 8670, 86703K (2013).
[23] Hamarneh, G. and Jassi, P., “Vascusynth: Simulating vascular trees for generating volumetric image data with ground truth segmentation and tree analysis,” Computerized Medical Imaging and Graphics 34(8), 605–616 (2010).
[24] Jassi, P. and Hamarneh, G., “Vascusynth: Vascular tree synthesis software,” Insight Journal January-June, 1–12 (2011).
[25] Schindelin, J., Arganda-Carreras, I., Frise, E., et al., “Fiji: an open-source platform for biological-image analysis,” Nature methods 9(7), 676–682 (2012).
[26] Labeyrie, P., Braud, F., Gakuba, C., Gaberel, T., Orset, C., Goulay, R., Emery, E., Courth´eoux, P., and Touz´e, E., “Cervical artery tortuosity is associated with intracranial aneurysm,” International Journal of Stroke 12, 549–552 (July 2017).