R E S E A R C H
Open Access
Anopheles species associations in Southeast Asia:
indicator species and environmental influences
Valérie Obsomer
1,2*, Marc Dufrene
3, Pierre Defourny
2and Marc Coosemans
1Abstract
Background: Southeast Asia presents a high diversity of Anopheles. Environmental requirements differ for each species and should be clarified because of their influence on malaria transmission potential. Monitoring projects collect vast quantities of entomological data over the whole region and could bring valuable information to malaria control staff but collections are not always standardized and are thus difficult to analyze. In this context studying species associations and their relation to the environment offer some opportunities as they are less subject to sampling error than individual species.
Methods: Using asymmetrical similarity coefficients, indirect clustering and the search of indicator species, this paper identified species associations. Environmental influences were then analysed through canonical and discriminant analysis using climatic and topographic data, land cover in a 3 km buffer around villages and vegetation indices.
Results: Six groups of sites characterized the structure of the species assemblage. Temperature, rainfall and vegetation factors all play a role. Four out of the six groups of sites based on species similarities could be discriminated using environmental information only.
Conclusions: Vegetation indices derived from satellite imagery proved very valuable with one variable explaining more variance of the species dataset than any other variable. The analysis could be improved by integrating seasonality in the sampling and collecting at least 4 consecutive days.
Background
Southeast Asia presents a high diversity of Anopheles in-cluding more than 30 Anopheles species present in the do-mestic environment [1]. The major vectors, Anopheles dirus sensu lato, An. minimus s.l., An. epiroticus, are re-sponsible for most malaria cases in the region but second-ary vectors might play a sporadic role [2]. Environmental requirements differ for each species and should be cla-rified because of their influence on malaria transmission potential. Various research studies [3,4] try to relate Anophelesspecies and environmental drivers in the region but are often restricted to small areas and a few species due to the logistic effort necessary to obtain optimal sam-pling. On the other hand, monitoring projects can
generate vast quantities of data on a wider scale, but sam-pling design is often not optimal for exploring biodiversity issues. This is the case of the MALVECASIA project [5], which operated a major collection effort throughout Laos, Cambodia and Vietnam capturing Anopheles between 2003 and 2005 in more than a hundred sites to monitor insecticide resistance. For logistic reasons, surveys were not concurrent. In this context studying species associa-tions and their relation to the environment offer some op-portunities. Associations are less subject to sampling error than individual species. Moreover, some species such as An. dirus s.l.are difficult to collect and abundance varies greatly according to the rain history of the previous days [6]. Occurrence of such elusive species could be revealed by the presence of associated species.
Several concept of species association have been devel-oped [7] but Fager and McGowan [8] simply refer to a recurrent group of co-occurring species. Cole [9] designed a first coefficient measuring the degree of association between pairs of species which was used to identify
* Correspondence:[email protected] 1
Department of Parasitology, Prince Leopold Institute of Tropical Medicine, Nationalestraat 155, Antwerp 2000, Belgium
2
Earth and Life Institute, Environmental Sciences, Université Catholique de Louvain, Croix du Sud 2/16, Louvain-la-Neuve B-1348, Belgium
Full list of author information is available at the end of the article
© 2013 Obsomer et al.; licensee BioMed Central Ltd. This is an Open Access article distributed under the terms of the Creative Commons Attribution License (http://creativecommons.org/licenses/by/2.0), which permits unrestricted use, distribution, and reproduction in any medium, provided the original work is properly cited.
association between larvae [10-12]. The index was further corrected by Hurlbert [13] to account for species frequen-cies bias and used for analysis of mosquito association [14-19]. Other indices target species dominance [20-22]. Southwood [23] also developed an index that takes the number of individuals collected into consideration [24]. However, only pairs of mosquito species were investigated and mostly using a count of common breeding sites at lar-val stages [25].
Studying associations between more than two species and particularly Anopheles species adults associations can be a challenge: (1) abundance data may not reflect the true proportion of species because some species are more eas-ily captured than others, (2) correlation coefficients can’t be used as they associate co-occurring species only if their abundances vary linearly, (3) double absences should be discarded as they do not mean association, and (4) false absence are common in particular when studying a great number of species with different seasonality, behavior and response to sampling [26]. Nevertheless, this paper pro-poses a method to tackle each of the above mentioned is-sues and apply an ecological concept based on indicative species to identify species association.
In this context, this paper aims to (1) define species assemblages and identify indicator species for those as-semblages, and (2) search environmental determinants which could explain or help delineate those assemblages. Methods
Entomological data
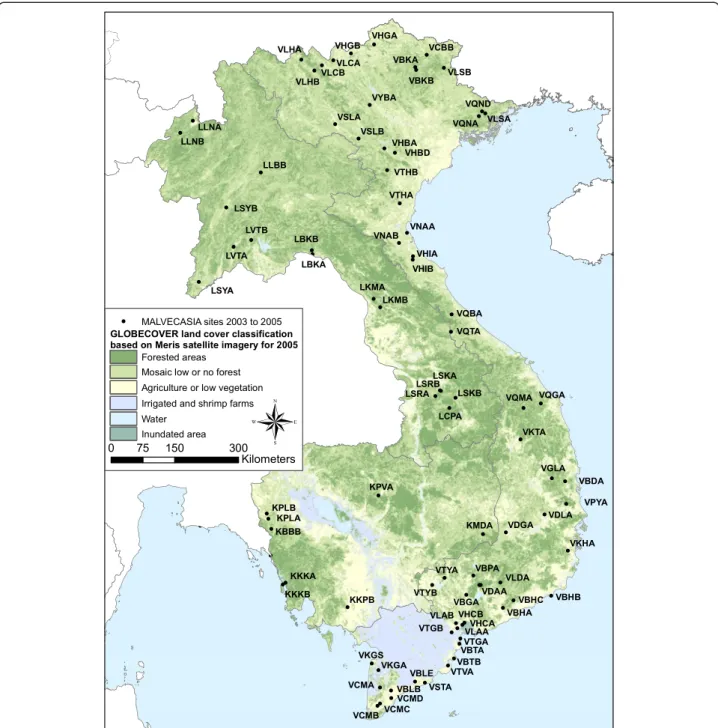
The MALVECASIA dataset described in Van Bortel [5] in-vestigated approximately two sites per province in Laos, Cambodia and Vietnam from 2003 and 2005 (Figure 1) (can be obtained from the author M. Coosemans). The present study concentrates on adult Anopheles captured by human baits indoors and outdoors, which correspond to Anopheles of interest for public health. All sites were surveyed during two to twenty one nights just before or after the rainy season. Sites with less than 3 nights of col-lection were discarded as well as sites with no mosquito recorded. Species were defined on their morphological characteristics and sibling species of the An. dirus, An. minimusand An. maculatus complex were not considered separately. Similarly species members of the Annularis group were mixed together. An. pampanai is also present in the region but was misidentified to be An. minimus in a couple of sites and thus discarded. Species occurring in less than 4 sites were also discarded. This includes An. argyropus, An. baileyi, An. crawfordi, An. indefinitus, An. lesteri, An. lindesayi, An. pseudojamesi and An. varuna (Table 1). The abundance values were weighted per man nights and recorded using the transformation (log (Abun-dance+1)) [27,28] in order to give less weight to the few very abundant species.
Environmental data
Four groups of variables were investigated: (1) XY: Spatial geographical coordinates of latitude and longitude and their second polynomial combinations to evaluate the significance of spatial autocorrelation, (2) CT: abiotic fac-tors such as climatic trends and topography from the Worldclim dataset [29] and the CRU CL2.0 dataset [30] as well as elevation, slope, flow direction, flow accumulation and compound topographic index available from the USGS digital elevation model, (3) GC: variables derived from land cover GLOBCOVER at a resolution of 300 m derived from Meris satellite annual composite image for year 2005 and which provides harmonized classes over the three countries [31], (4) ND: vegetation indices including the annual greenness of vegetation (NDVI) as well as wet-ness index for vegetation (NDWI) derived from spot VEGETATION satellite yearly composite images for 2005 at 1 km resolution. NDVI and NDWI layers were calcu-lated using software ENVI 4.4 and are based on annual composites of daily spot VEGETATION images based on the mean compositing method [32]. The environmental values were extracted at each site. The minimum, max-imum, mean and standard deviation value over a buffer area of 3 km around each site was extracted for vegetation indices (ND) using Arcgis 9.3. The proportion of each land cover classes was also estimated in a buffer or 3 km around each site. Landscape indices including fragmenta-tion were extracted using the software FRAGSTATS [4,33]. The GLOBCOVER dataset has some well known misidentification of forest zones in the south of Vietnam. The layer was corrected using a mask based on NDVI (<0.5) and NDWI (<0.3) value of spot vegetation annual composite for year 2005.
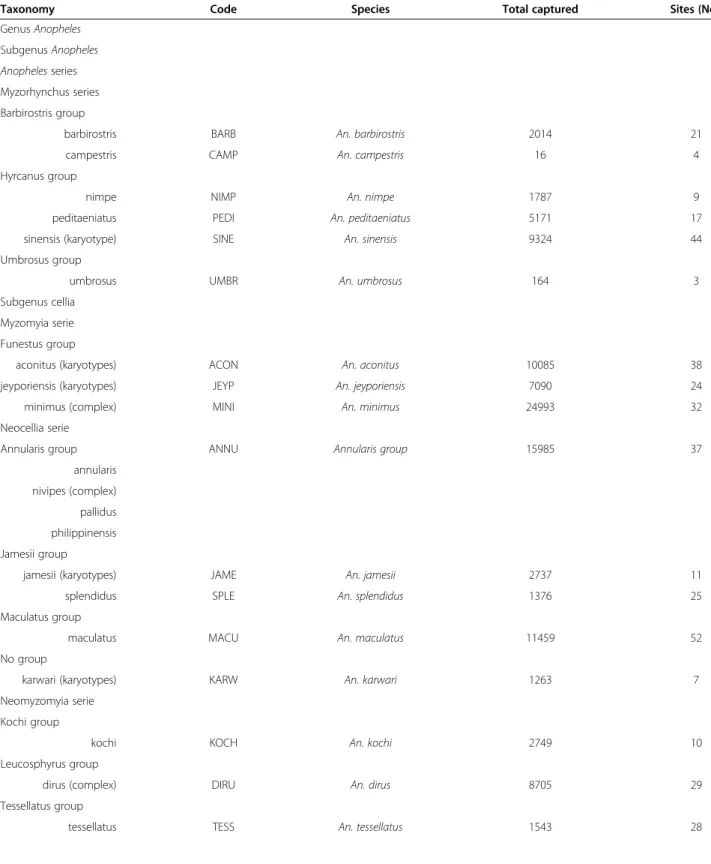
Analytical strategy
Species associations are analyzed using indirect clustering of species through three major steps: calculation of simi-larities between pair of sites according to species, direct clustering of the sites based on those similarities, then analysis of the Indicator Value for each species at each clustering level. Environmental influences are then investi-gated. The general scheme of the analysis is presented in Figure 2.
Similarities between pair of sites according to species are calculated in R software [34] based on Anopheles abundance aggregated per sites using Steinhaus asymmet-ric coefficient [35]. Those similarities are then used for hierarchical clustering of sites with Ward’s minimum vari-ance method [36]. To confirm presence of hierarchical structure in the data, we followed suggestion of Dufrêne and Legendre [28] by using the k-means method [37] on the sites coordinates on the 20 first axis of a Principal Co-ordinates Analysis ordination (PCoA) [38] based on the similarity matrix.
Once sites are classified in clusters, indicator species corresponding to the various clusters of the site typology are identified using the IndVal method [28] (Additional file 1). The most representative species is identified for each cluster of sites and at each level of the cluster tree. The indicator value is calculated independently for each species, thus dealing with differential response to sam-pling. Indicator species are defined as the most character-istic species of each group, found mostly in a single group
and present in the majority of the sites belonging to that group. This index is maximum (= 100%) when all speci-mens of a species are found in a single group of samples and when the species occurs in all samples of that group. The basic idea is to measure the species indicator value for all the levels of a hierarchical typology. The IndVal index allows also identifying species typical for the inter-mediate level of the clustering history. The statistical sig-nificance of the species indicator values is evaluated using
Figure 1 Map of the survey sites. Each site has a 4 digit codes corresponding to description in Van Bortel et al. (2008). Background is based on Globcover (Defourny et al., 2009).
Table 1 MALVECASIA entomological dataset
Taxonomy Code Species Total captured Sites (No.)
Genus Anopheles Subgenus Anopheles Anopheles series Myzorhynchus series Barbirostris group
barbirostris BARB An. barbirostris 2014 21
campestris CAMP An. campestris 16 4
Hyrcanus group
nimpe NIMP An. nimpe 1787 9
peditaeniatus PEDI An. peditaeniatus 5171 17
sinensis (karyotype) SINE An. sinensis 9324 44
Umbrosus group
umbrosus UMBR An. umbrosus 164 3
Subgenus cellia Myzomyia serie Funestus group
aconitus (karyotypes) ACON An. aconitus 10085 38
jeyporiensis (karyotypes) JEYP An. jeyporiensis 7090 24
minimus (complex) MINI An. minimus 24993 32
Neocellia serie
Annularis group ANNU Annularis group 15985 37
annularis nivipes (complex) pallidus philippinensis Jamesii group
jamesii (karyotypes) JAME An. jamesii 2737 11
splendidus SPLE An. splendidus 1376 25
Maculatus group
maculatus MACU An. maculatus 11459 52
No group
karwari (karyotypes) KARW An. karwari 1263 7
Neomyzomyia serie Kochi group
kochi KOCH An. kochi 2749 10
Leucosphyrus group
dirus (complex) DIRU An. dirus 8705 29
Tessellatus group
a randomization procedure [28]. Associated species are species which are indicators of the same cluster of sites.
Environmental influences Select useful environmental data
Canonical Correspondence Analysis (CCA) available in the software canoco 4.5 for windows [39] quantifies and describes the relationship of a particular set of variables with species assemblages [40,41]. CCA has the advantage of being less influenced by noise in species abundance and by inter-correlated environmental variables than other methods. Relevant variables were then selected using a Monte-Carlo randomization test with 499 steps in an
initial CCA with all variables and the ones that proved not to be active (p>0.05) were removed from the analysis [40].
Canonical analysis per groups of environmental variables and variance partitioning
The four groups of variables are analyzed separately to perform variance partitioning [40] and identify which group of factors has an overall influence on the distribu-tion. For each group of variables XY, CT, GC, ND the var-iables were integrated in a stepwise manner into a canonical analysis. The process was continued till a max-imum of 5 variables were integrated and using only signifi-cant variables (Monte Carlo test). The best performing variables were plotted against the species sample in order
Figure 2 General scheme of analysis.
Table 1 MALVECASIA entomological dataset (Continued) Pyretophorus serie
No group
subpictus (complex) SUBP An. subpictus 3068 6
epiroticus (complex) EPIR An. epiroticus 32047 21
vagus (karyotypes) VAGU An. vagus 18714 20
Total 160290 86
to analyze the influence of variables on the occurrence of the species.
Environmental justification to clustering of sites based on species
The best performing environmental variables are used to perform a multivariate discriminant canonical analysis in software SAS 8.2. This process analyzes which groups can be differentiated by linear combinations of environmental variables. The process identifies the best explanatory vari-ables and a discriminant analysis using those varivari-ables gives an idea of the rate of omission and commission er-rors if sites classification were only based on specific linear combination of environmental variables.
Results
Indirect species assemblage
Figure 3 presents the clustering of sites using the Ward method and subsequent indirect clustering of species. The cluster of sites is first built based on site similarities in terms of abundance of species. At each level of separ-ation between groups, the indicator value is calculated for each species. Species presenting an indicator value significant and higher than 20% are associated to the group of sites (Figure 3). A small map is presented at each node of a cluster to see spatial distribution of the two separating clusters. A pie presents the proportion of the various land cover calculated as the mean divided by the sites of the group.
Six groups of sites can be defined with high indicator value for at least one species. The most ubiquitous species seems to be An. tesselatus. This species is indicative of the root node being associated with no site in particular, but the result is non significant. The most different group of sites is Group 6 (first node) with 19 sites characterized by brackish water including mangrove or shrimp farms in South Vietnam and Cambodia. An. epiroticus is very indi-cative of this group (100%) as to a lesser extend An. nimpe (47%) and An. subpictus (21%). Those three species are thus associated. An. subpictus was mostly found in the sites investigated in the first part of the year (season 1).
An. maculatusand An. splendidus are indicator species for the sites not included in Group 6. These species are ubiquitous and can thus be found if all subsequent groups. It is however important to keep in mind that An. maculatus is a complex of species and this ubiquity
might be linked to the occurrence of several sibling spe-cies with different environmental requirements. This group of sites further divides into one group with no specific species and another group represented by An. sinensis. The An. sinensis branch separates in Group 5 characterised by An. sinensis and mostly found in Vietnam, and Group 4 with many sites but only four sites which further associate with An. vagus and An. barbirostris. The land cover class post flooding or irri-gated cropland which includes shrimp farms is clearly present in Group 6 of An. epiroticus but can be found in Group 5 of An. sinensis.
The rest of the sites which separated at node 2 provide Group 3 with only An. dirus as indicator species, sug-gesting no species association. An. dirus is also an indicator for higher hierarchical level (node 2) but reach its max-imum for the group 3, which seems to be thus the typical type of sites for the species, at least in the second part of the year (season 2). A larger proportion of closed evergreen and closed to open deciduous evergreen forest characterize these sites located in Central Vietnam. An. minimus pre-sents the highest indicator value for the rest of the sites. Those sites further separate in Group 1 characterized by the presence of An. jamesi and Group 2 where a large group of species are indicators. Those species include An. peditaeniatus, An. annularis, An. aconitus, An. kochi, An. jeyporiensis and An. umbrosus. No particular land cover could be associated with those species.
Environmental influence
Species and environmental variables
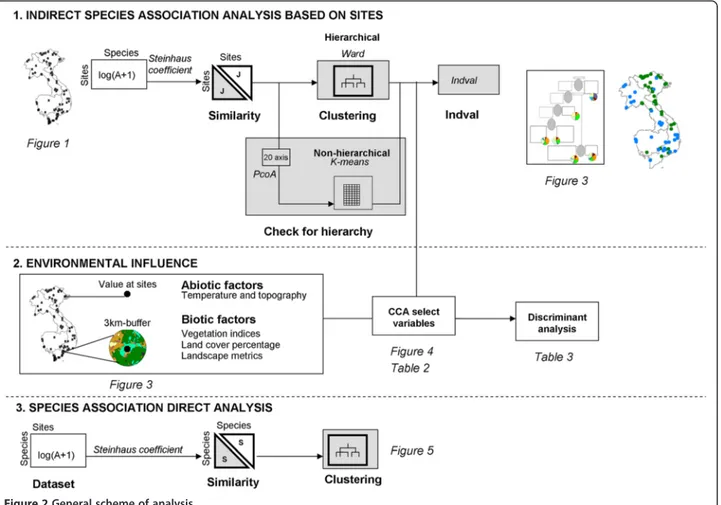
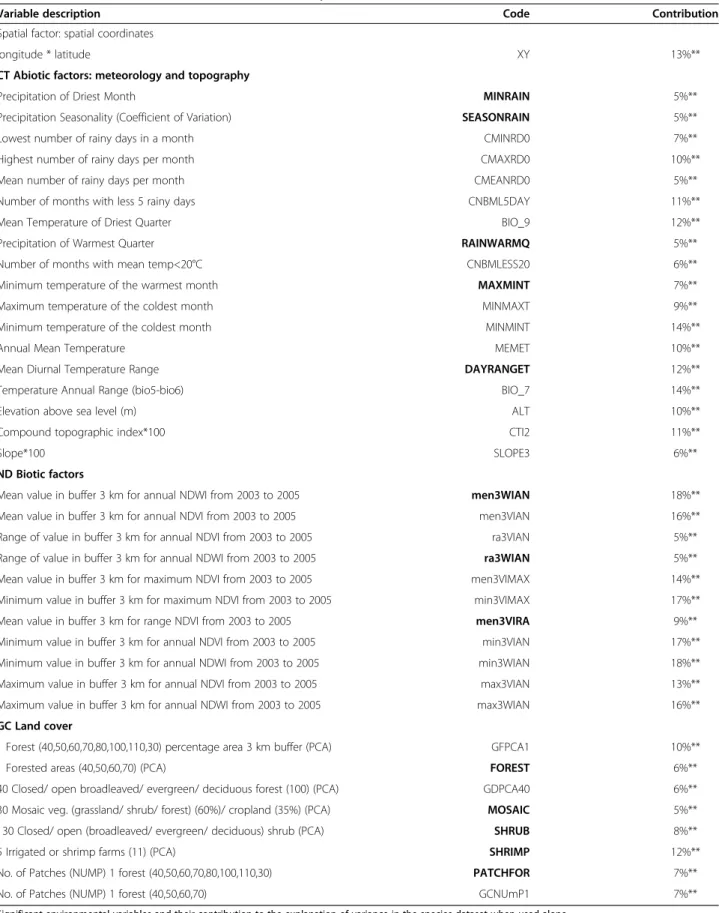
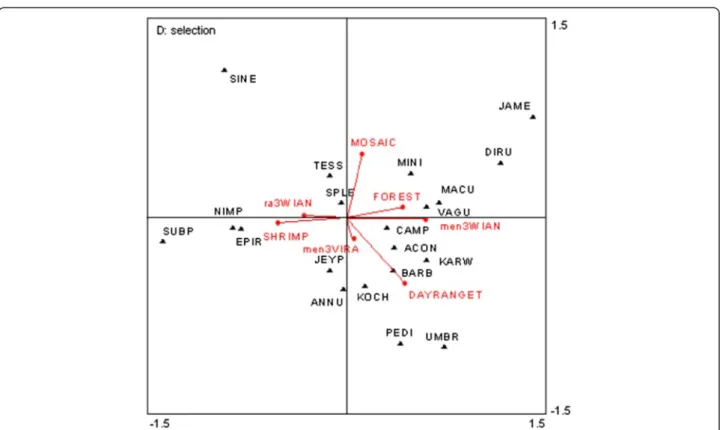
Highly significant variables (Monte Carlo permutation test) explaining 5% or more of the variance are presented in Table 2. The ND greenness indices and GC land cover groups of variables perform well by explaining more than 45% of the variance each alone but with only 3 variables for the ND group against 5 variables for the GC group. The interaction between the two groups of variables is around 24%. The best performing variables were used to build a final graph (Figure 4). An. epiroticus, An. nimpe and An. subpictus seemed to be characterised by the presence of a shrimp farm (SHRIMP) and fragmented landscape (ra3WIAN). There is a clear opposition with An. dirus characterized by high dense forest (FOREST) and a high level of vegetation wetness index (men3 WIAN). Mosaic vegetation and crop (MOSAIC) explain
(See figure on previous page.)
Figure 3 Indirect cluster and indicator species. Indirect clustering and indicator species for 6 main groups based on sites similarities in terms of abundance of species. For each group, species showing a significant association (only An. tesselatus in node 1 is not significant) characterized by an indicator value >20% (in brackets) are listed. The species are displayed in red font when they present the highest indicator value obtained by that particular species during the analysis. A small map is presented at each node showing distribution of the two separating clusters. A pie presents the proportion of the various land cover calculated as the mean over the sites of the group. The sites included in the group are listed under the groups (starting with V: Vietnam, C: Cambodia, L: Laos) as well as the season of collection.
Table 2 Environmental variables selected for the analysis and variance
Variable description Code Contribution
Spatial factor: spatial coordinates
longitude * latitude XY 13%**
CT Abiotic factors: meteorology and topography
Precipitation of Driest Month MINRAIN 5%**
Precipitation Seasonality (Coefficient of Variation) SEASONRAIN 5%**
Lowest number of rainy days in a month CMINRD0 7%**
Highest number of rainy days per month CMAXRD0 10%**
Mean number of rainy days per month CMEANRD0 5%**
Number of months with less 5 rainy days CNBML5DAY 11%**
Mean Temperature of Driest Quarter BIO_9 12%**
Precipitation of Warmest Quarter RAINWARMQ 5%**
Number of months with mean temp<20°C CNBMLESS20 6%**
Minimum temperature of the warmest month MAXMINT 7%**
Maximum temperature of the coldest month MINMAXT 9%**
Minimum temperature of the coldest month MINMINT 14%**
Annual Mean Temperature MEMET 10%**
Mean Diurnal Temperature Range DAYRANGET 12%**
Temperature Annual Range (bio5-bio6) BIO_7 14%**
Elevation above sea level (m) ALT 10%**
Compound topographic index*100 CTI2 11%**
Slope*100 SLOPE3 6%**
ND Biotic factors
Mean value in buffer 3 km for annual NDWI from 2003 to 2005 men3WIAN 18%**
Mean value in buffer 3 km for annual NDVI from 2003 to 2005 men3VIAN 16%**
Range of value in buffer 3 km for annual NDVI from 2003 to 2005 ra3VIAN 5%**
Range of value in buffer 3 km for annual NDWI from 2003 to 2005 ra3WIAN 5%**
Mean value in buffer 3 km for maximum NDVI from 2003 to 2005 men3VIMAX 14%**
Minimum value in buffer 3 km for maximum NDVI from 2003 to 2005 min3VIMAX 17%**
Mean value in buffer 3 km for range NDVI from 2003 to 2005 men3VIRA 9%**
Minimum value in buffer 3 km for annual NDVI from 2003 to 2005 min3VIAN 17%**
Minimum value in buffer 3 km for annual NDWI from 2003 to 2005 min3WIAN 18%**
Maximum value in buffer 3 km for annual NDVI from 2003 to 2005 max3VIAN 13%**
Maximum value in buffer 3 km for annual NDWI from 2003 to 2005 max3WIAN 16%**
GC Land cover
1 Forest (40,50,60,70,80,100,110,30) percentage area 3 km buffer (PCA) GFPCA1 10%**
1 Forested areas (40,50,60,70) (PCA) FOREST 6%**
40 Closed/ open broadleaved/ evergreen/ deciduous forest (100) (PCA) GDPCA40 6%**
30 Mosaic veg. (grassland/ shrub/ forest) (60%)/ cropland (35%) (PCA) MOSAIC 5%**
130 Closed/ open (broadleaved/ evergreen/ deciduous) shrub (PCA) SHRUB 8%**
5 Irrigated or shrimp farms (11) (PCA) SHRIMP 12%**
No. of Patches (NUMP) 1 forest (40,50,60,70,80,100,110,30) PATCHFOR 7%**
No. of Patches (NUMP) 1 forest (40,50,60,70) GCNUmP1 7%**
another dimension and seems more associated with An. minimusand An. jamesi.
Environmental justification to clustering of sites based on species
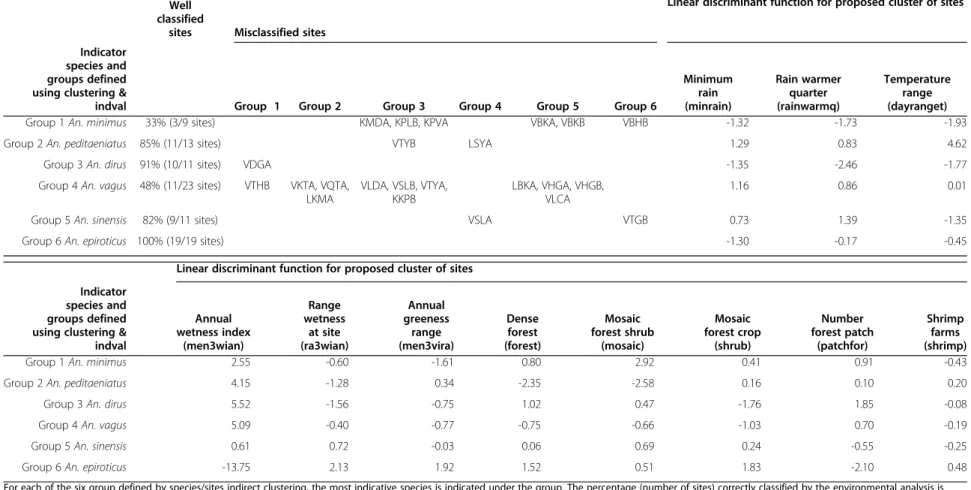
The best explanatory variables were filtered in a stepwise procedure. A discriminant canonical analysis then used linear combinations of the original environmental varia-bles standardised to predict belonging to the six groups of sites previously defined by indirect clustering and indica-tor species (Table 3). Four groups out of 6 are well charac-terized by environmental factors with more than 80% of the sites attributed to the correct group.
The An. peditaeniatus group 2 is reasonably well classi-fied (85%). Numerous species are indicative of this group. A high value of wetness index (mean3wian) and tem-perature range (DAYRANGET) characterize this group as well as negative correlation with dense forest (FOREST) and forest mosaic (SHRUB). The An. dirus group 3 is well characterized (91%) with positive correlation with mean annual wetness vegetation index (men3WIAN), number of forest patch (PATCHFOR) and presence of dense forest
(FOREST) and negative correlation with most of the other factors. Group 5 is characterized by An. sinensis and correlated with a high value of rainfall in the warm quarter (RAINWARMQ) and low temperature range (DAYRANGET). An. epiroticus group 6 show a strong negative correlation with annual wetness index (men3wian) but the expected correlation with percentage of shrimp farm surface (SHRIMP) is quite low while still being higher than for other groups. Quantitative parameter derived from remote sensing vegetation index such as the annual wet-ness index seem to provide the best tools for discrimin-ation between the well characterized groups.
Discussion
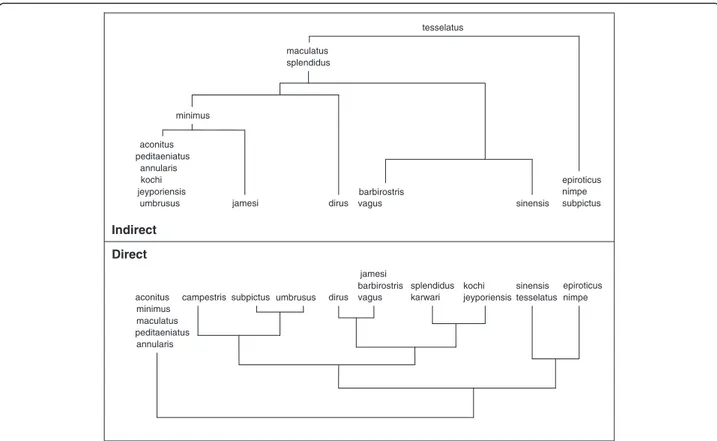
Six species assemblages could be defined in this study out of which four could also be significantly characterized by a different environment. Comparison between indirect and direct clustering method, shows that indirect analysis better handled widespread species like An. tessalatus and An. splendidus (Figure 5). An. maculatus is found in 52 sites out of 88 sites and can be considered as a widespread species. It is important however to keep in mind that
Figure 4 Canonical analysis. Bi plot based on canonical analysis for selected environmental variables. Mosquito species are presented in upper cases code of 4 letters with ACON: An. aconitus, ANNU: An. annularis, BARB: An. barbirostris, CAMP: An. campestris, DIRU: An. dirus s.l., EPIR: An. epiroticus, JAME: An. jamesi, JEYP: An. jeyporiensis, KARW: An. karwari, KOCH: An. kochi, MACU: An. maculatus, MINI: An. minimus s.l., PEDI: An. peditaeniatus, SPLE: An. splendidus, TESS:An. tesselatus, SINE: An. sinensis, SUBP: An. subpictus, UMBR: An. umbrosus, VAGU: An. vagus. Environmental variables are surrounded by rectangles and abbreviations are as follow: MOSAIC: Mosaic vegetation and crop, FOREST: Dense forest, ra3WIAN: Range of variation of wetness index in 3-km buffer, SHRIMP: Shrimp farms, DAYRANGET: Temperature range, men3WIAN: Mean annual wetness index in 3-km buffer, men3VIRA: Yearly vegetation greenness variation (season).
Table 3 Environmental influence for species clusters
Well classified
sites Misclassified sites
Linear discriminant function for proposed cluster of sites
Indicator species and groups defined using clustering &
indval Group 1 Group 2 Group 3 Group 4 Group 5 Group 6
Minimum rain (minrain) Rain warmer quarter (rainwarmq) Temperature range (dayranget)
Group 1 An. minimus 33% (3/9 sites) KMDA, KPLB, KPVA VBKA, VBKB VBHB -1.32 -1.73 -1.93
Group 2 An. peditaeniatus 85% (11/13 sites) VTYB LSYA 1.29 0.83 4.62
Group 3 An. dirus 91% (10/11 sites) VDGA -1.35 -2.46 -1.77
Group 4 An. vagus 48% (11/23 sites) VTHB VKTA, VQTA, LKMA VLDA, VSLB, VTYA, KKPB LBKA, VHGA, VHGB, VLCA 1.16 0.86 0.01
Group 5 An. sinensis 82% (9/11 sites) VSLA VTGB 0.73 1.39 -1.35
Group 6 An. epiroticus 100% (19/19 sites) -1.30 -0.17 -0.45
Linear discriminant function for proposed cluster of sites Indicator
species and groups defined using clustering & indval Annual wetness index (men3wian) Range wetness at site (ra3wian) Annual greeness range (men3vira) Dense forest (forest) Mosaic forest shrub (mosaic) Mosaic forest crop (shrub) Number forest patch (patchfor) Shrimp farms (shrimp)
Group 1 An. minimus 2.55 -0.60 -1.61 0.80 2.92 0.41 0.91 -0.43
Group 2 An. peditaeniatus 4.15 -1.28 0.34 -2.35 -2.58 0.16 0.10 0.20
Group 3 An. dirus 5.52 -1.56 -0.75 1.02 0.47 -1.76 1.85 -0.08
Group 4 An. vagus 5.09 -0.40 -0.77 -0.75 -0.66 -1.03 0.70 -0.19
Group 5 An. sinensis 0.61 0.72 -0.03 0.06 0.69 0.24 -0.55 -0.25
Group 6 An. epiroticus -13.75 2.13 1.92 1.52 0.51 1.83 -2.10 0.48
For each of the six group defined by species/sites indirect clustering, the most indicative species is indicated under the group. The percentage (number of sites) correctly classified by the environmental analysis is provided as well as the number and name of misclassified sites and groups in which they were placed. The coefficients of the linear discriminant function are provided for each environmental factor and each group.
al. Parasites & Vectors 2013, 6 :136 Page 10 of 14 vectors.co m/content/6/1 /136
An. maculatusis a complex of sibling species. If the ana-lysis brings some light in the association between species, the main vector An. dirus s.s. is unfortunately not associ-ated with any species and presence of another species can-not be used as an indication of potential presence of this elusive species. Unfortunately, An. minimus is also not strongly associated to other species and An. sundaicus is the most indicative species of a group of sites. This last species can be associated to An. nimpe and An. subpictus. However the habitat of An. sundaicus is already well characterised and there is no need for an additional indi-cator of presence for this species. The results are thus not optimal for operational use.
The methodology developed here addresses the major is-sues linked to analysis of adult Anopheles species associa-tions. First, abundance is log transformed to smooth the differences in abundances potentially linked to differential response to sampling while avoiding losing too much infor-mation. Second, asymmetrical similarity coefficients are used to give less weight to absence and discard double ab-sence [27]. Third, the indirect cluster analysis method IndVal [28] deals elegantly with widespread species, which are generally difficult to identify in direct clustering ana-lysis and generally placed with one or another specialized group or considered as outliers. Indval seems to be a good
alternative to the more widely used Twinspan method [42], which compares relative abundance between species and might thus produce misleading results. Here species are evaluated independently from each other. While seldom used in the field of mosquito related research the Indval index is increasingly used in the field of ecology and many tools are available freely online for the user (R project li-brary labdsv). In the field of vegetation sciences, a similar index is used called the phi coefficient of association and derived from the Pearson correlation [43,44]. Recently De Caceres and colleague [45] compared IndVal with the phi coefficient and conclude that the correlation coefficient is more suited to determine species ecological preferences amongst groups of sites but indicator values are the most adapted to determine species assemblages.
Four groups could be discriminated using environmental information, including groups associated with An. dirus, An. pediaeniatus, An. sinensis and An. epiroticus. Anoph-eles of the region are very diverse and have different bio-nomics [46], some of which are directly influenced by the environment. Vegetation indices derived from satellite im-agery seem to pick up some of these influences and this might offer the opportunity to work with more accurate in-formation in time. Indeed, preliminary analysis (not shown here) used three detailed national land cover dataset (one
epiroticus maculatus aconitus minimus tesselatus sinensis peditaeniatus barbirostris dirus jamesi umbrusus subpictus campestris vagus kochi jeyporiensis splendidus epiroticus maculatus aconitus minimus tesselatus sinensis peditaeniatus barbirostris dirus jamesi karwari umbrusus vagus kochi jeyporiensis splendidus annularis annularis nimpe nimpe subpictus Direct Indirect
Figure 5 Comparing direct and indirect species assemblage based on Ward clustering method. Both methods are based on asymmetrical similarity coefficient. Indirect method is based on ward clustering of sites according to species and analysis of indicative value for each species at each node (see Figure 3). Direct clustering groups species according to log abundance in sites.
per country) but information was not available for the same year or with the same legend for all the countries making regional analysis difficult and the analysis did not show significant results. The GLOBCOVER product [47] with a 300 m resolution used in this analysis seems to be sufficient to bring the necessary information for the ana-lysis and has the advantage of being consistent over the three countries. While potential for regular updates will probably provide up to date information in the future [48], currently, only vegetation indices can give timely informa-tion. The greenness indices performed remarkably well in the analysis with the wetness index (NDWI) and the green-ness index (NDVI) explaining alone 18% and 16% of the variance (Table 2). Those indices are increasingly available freely and on a regular basis for every square kilometre or even finer scale over the globe. The fact that they can ex-plain a larger part of the variance than land cover based in-dices is of interest because contrarily to greenness inin-dices, land cover layers are time consuming to produce and inte-grate errors due to the classification of numerical reflect-ance values into classes of land cover. The final user has however to keep in mind that quality of those indices might vary according to the source imagery or the process-ing chain [49]. Usprocess-ing greenness indices might thus be a good option for operational surveillance of environmental changes.
Seasonal influence and sampling strategies
The sampling design adapted for monitoring purposes is not optimal for exploring biodiversity issues, but is, how-ever, the only type of data available on a wide region as it would be impossible to survey all these villages in the same time. This is of importance because the composition of a mosquito population can vary greatly from one week to another according to the rain history. Sites were se-lected according to two criteria: location in area of malaria transmission and abundance of known or suspected vec-tors. Indeed, in the dry season, very few mosquitoes are encountered, and in the middle of the rainy season, it is often impossible to reach villages, particularly in forested zones. The assessment of the sampling exhaustivity of the dataset is difficult to estimate in such a wide region and targeting so many species. Indeed the number of species present depends of the type of ecosystem. In some places sampling during three weeks would gather only one species and in other places this would depend of the rain occurrence two weeks before. Surveys were more numer-ous in Vietnam which have greater technical capabilities, more teams and experience and which routinely carry out field surveys.
Conclusions
In an attempt to reconcile research and application this article presents a different approach: using the abundant
entomological data made available through monitoring programs and available environmental information to ex-tract valuable knowledge for malaria control staff in the field. To compensate for the lack of standardization in the entomological dataset, the study characterized not only few species but species association and their relation to the environment.
The study managed to get around the imperfection inher-ent to the inher-entomological dataset by using an adapted method based on association and freely available up-to-date products derived from remote sensing techniques. Slight modification in the collection of monitoring data could greatly improve the analysis. The results are limited by how representative the sampling design has been but it is diffi-cult to decide a minimum number of necessary collection days to capture the whole diversity when working with very diverse collection sites [50]. If transversal study could bring the best information on seasonal variation, surveying each site once before and once after the rainy season could help to have a first idea of influence of the season. The indicator value presented in this study could bring information of interest to the entomologist. Building the same method-ology on a more standardized dataset collected according to the season could help characterize sites and season asso-ciated to vector species and better focus malaria control ef-fort on specific habitat. The results have predictive power only for sites with a habitat similar to those used to find the indicator species [51]. In our case, only suspected malarious areas were surveyed and no information is thus available in other regions of the country. In a region with such a fast-changing environment it would be useful to investigate at least a few sites in each ecological habitat.
Identified indicator species should be further investi-gated using independent dataset for confirmation of indi-cator species such as developed in Mc Geoch [52]. While the use of indicator value is here useful to investigate asso-ciations between mosquito species, adult mosquitoes such as studied here are probably not the best bio-indicators for particular sites or to predict environmental changes, and this is particularly because of the difficulties linked to sampling and micro-variation in population due to rain history in the previous days.
Additional file
Additional file 1: Technical summary of IndVal method. Short description and equations for calculation of IndVal indicator value.
Abbreviations
An:Anopheles; CCA: Canonical Correspondence Analysis; CRU: Climate Research Unit; CT: Abiotic factors (climatic trends and topography); DAYRANGET: Temperature range; DEM: Digital elevation model; DYNMAP: Dynamic Mapping project; FOREST: Dense forest; GC: Variables derived from land cover GLOBCOVER; GIS: Geographical Information System; INDVAL: Indicator Value method; MALVECASIA: Malaria vector insecticide resistance project SEA; Maxmint: Highest minimal monthly temperature;
men3VIRA: Yearly vegetation greenness variation (season); men3WIAN: Mean annual wetness index in 3-km buffer; MERIS: Medium Resolution Imaging Spectrometer; MINRAIN: Minimum rain; MOSAIC: Mosaic vegetation and crop; ND: Vegetation indices; NDVI: Normalized Difference Vegetation Index; NDWI: Normalized Difference Water Index; PATCHFOR: Number of forest patches; PCoA: Principal Coordinates Analysis ordination; ra3WIAN: Range of variation of wetness index in 3-km buffer; RAINWARMQ: Precipitation of the warmest quarter; s.l.: sensu lato; s.s.: sensu stricto; SEAGIS: Pilot GIS for malaria in SEA; SEASONRAIN: Rainfall pattern; SHRIMP: Shrimp farms; SHRUB: Mosaic shrub land evergreen; SPOT: Systeme Probatoire pour l’Observation de la Terre; UPGMA: Unweighted Pair Group Method Arithmetic Mean; USGS: US Geological Survey; XY: Spatial geographical coordinates.
Competing interests
The authors declare that they have no competing interests. Authors’ contributions
VO conceived the study, performed the statistical analysis and drafted the manuscript, MD made substantial contributions to conception and design of the methodology as well as results interpretation, PD participated in the design of the study and results interpretation, MC participated in the design of the study, analysis and interpretation of the results and supervised the work at all stage. All authors revised, read and approved the final manuscript
Acknowledgements
The authors thank the staff of the malaria national control program and particularly the members of the MALVECASIA network which provided fresh information on the distribution of Anopheles in the Southeast Asian region. Those include Dr Trung and Dr Thuan from the National Institute of Malariology, Parasitology and Entomology of Vietnam (NIMPE), Dr Tho and Dr Socheat from the National Centre for Malaria Control, Parasitology and Entomology of Cambodia (CNM), Dr Kalounna, Dr Bouasy and Dr Samlane from the Centre of Malariology, Parasitology and Entomology of Laos (IMPE) and Dr Visut Baimai from the Mahidol University (MU) of Thailand and Ralph Harbach and Yvonne Linton from the Natural History Museum of London (NHM). This work was funded by the Belgian Sciences Policy Office (BELSPO) through the DYNMAP project and by the European Union through the MALVECASIA project (IC4-CT-2002-10041) in the framework of the INCODEV program (ERBIC18.CT.970211). The funders had no role in study design, data collection and analysis, decision to publish, or preparation of the manuscript. Author details
1Department of Parasitology, Prince Leopold Institute of Tropical Medicine, Nationalestraat 155, Antwerp 2000, Belgium.2Earth and Life Institute, Environmental Sciences, Université Catholique de Louvain, Croix du Sud 2/ 16, Louvain-la-Neuve B-1348, Belgium.3Biodiversity and landscape department, Gembloux Agro-BioTech, University of Liège, passage des déportés, 2, Gembloux B-5030, Belgium.
Received: 22 January 2013 Accepted: 1 May 2013 Published: 4 May 2013
References
1. Trung HD, Van Bortel W, Sochantha T, Keokenchanh K, Briet O, Coosemans M: Behavioural heterogeneity of Anopheles species in ecologically different localities in South Asia: a challenge for vector control. Trop Med Int Health 2005, 10:251–262.
2. Trung HD, Van Bortel W, Sochantha T, Keokenchanh K, Quang N, Cong L, Coosemans M: Malaria transmission and major malaria vectors in different geographical areas of Southeast Asia. Trop Med Int Health 2004, 9:230–237.
3. Vanwambeke SO, Somboon P, Harbach RH, Isenstadt M, Lambin EF, Walton C, Butlin RK: Landscape and land cover factors influence the presence of Aedes and Anopheles larvae. J Med Entomol 2007, 144:133–144. 4. Overgaard H, Ekbom B, Suwonkerd W, Takagi M: Effect of landscape
structure on anopheline mosquito density and diversity in northern Thailand: Implications for malaria transmission and control. Landscape Ecol 2003, 18(6):605–619.
5. Van Bortel W, Trung HD, Thuan LT, Sochantha T, Socheat D, Sumrandee C, Baimai V, Keokenchanh K, Samlane P, Roelants P, Denis L, Verhaeghen K,
Obsomer V, Coosemans M: The insecticide resistance status of malaria vectors in the Mekong region. Malar J 2008, l:7.
6. Rosenberg R, Maheswary N: Forest malaria in Bangladesh. II. Transmission by Anopheles dirus. A J Trop Med Hyg 1982, 31:183–191.
7. Whittaker R: Classification of natural communities. Bot Rev 1962, 28:1–239. 8. Fager E, McGowan J: Zooplankton species groups in north pacific.
Sciences 1963, 140:453–460.
9. Cole LC: Measurement of interspecific association. Ecology 1949, 30:411–424. 10. Service MW: The taxonomy and biology of two sympatric sibling species of Culex, C.pipiens and C. torrentium (Diptera: Culicidae). J Zool Lond 1968, 156:313–323.
11. Yadav RS, Sharma VP, Chand SK: Mosquito breeding and resting in tree-holes in a forest ecosystem in Orissa. Indian J Malariol 1997, 34:8–16. 12. Reisen WK, Siddiqui TF, Aslamkhan M, Malik GM: Larval interspecific
associations and physico-chemical relationships of ground-water breeding mosquitoes of Lahore. Pak J Sci Res 1981, 3:1–23.
13. Hurlbert SH: A coefficient of interspecific association. Ecology 1969, 50:1–9. 14. Lounibos LP: Habitat segregation among African treehole mosquitoes.
Ecol Entomol 1981, 6:129–154.
15. Suwonkerd W, Tsuda Y, Takagi M, Wada Y: Seasonal occurrence of Aedes aegypti and Aedes albopictus in used tires in 1992–1994, Chiangmai. Thailand. Trop Med (Nagasaki) 1996, 38:101–105.
16. Bhatt RN, Sharma RC, Srivastava HC, Gautam AS, Gupta DK: Interspecific associations among anophelines in different breeding habitats of Kheba district Gujarat: part II– non-canal area. Indian J Malariol 1993, 30:91–100. 17. Kant R, Pandsey SD, Sharma SK, Sharma VP: Species diversity and
interspecific associations among mosquitoes in rice agro-ecosystem of Kheda district, Gujarat. Indian J Malariol 1998, 35:22–30.
18. Kant R, Pandey SD: Breeeding preferences of Anopheles culicifacies in the rice agro-ecosystem in Kheda District, Gujarat. Indian J Malariol 1999, 365:53–60.
19. Bradshaw WE, Holzapfel CM: Predator-mediated, non-equilibrium co-existence of tree-hole mosquitoes on southeastern North America. Oecologia (Berl.) 1983, 57:239–256.
20. May RM: Patterns of species abundance and diversity. In Ecology and Evolution of Communities. Edited by Cody ML, Diamond JM. Cambridge, Massachusetts: Belknap Press of Harvard University Press; 1975:81–120. 21. McNaughton SJ: Relationship among functional properties of California
grassland. Nature 1967, 216:168–169.
22. Lee D-K: Effect of two rice culture methods on the seasonal occurrence of mosquito larvae and other aquatic animals in rice fields of southwestern Korea. J Vector Ecol 1998, 23:161–170.
23. Southwood TRE: Ecological Methods with particular reference to the study of insect populations. London: Chapman & Hall; 1978.
24. Campos RE, Fernandez LA, Sy VE: Study of the insects associated with the floodwater mosquito Ochlerotatus albifasciatus (Diptera: Culicidae) and their possible predators in Buenos Aires Province, Argentina. Hydrobiologia 2004, 524:91–102.
25. Rattanarithikul R, Green C, Panyim S, Noigamol C, Chanaimongkol S, Mahapibu P: Larval habitats of malaria vectors and other Anopheles mosquitoes around a transmission focus in north-western Thailand. JAMA 1995, 11:428–433.
26. Hutchinson G: Concluding remarks. Cold Spring Harb Symp Quant Biol 1957, 22:415–427.
27. Legendre P, Legendre L: Numerical Ecology. Developments in Environmental Modelling, 2.0. Second edition. Amsterdam: Elsevier; 1998.
28. Dufrêne M, Legendre P: Species assemblages and indicator species: the need for a flexible asymmetrical approach. Ecol Monogr 1997, 67:345–366. 29. Hijmans R, Cameron S, Parra J, Jones J, Jarvis A: Very high resolution
interpolated climate surfaces for global land areas. Int J Climatol 2005, 25:1965–1978.
30. New M, Lister D, Hulme M, Makin I: A high-resolution data set of surface climate over global land areas. Clim Res 2002, 21:1–25.
31. Bicheron P, Leroy M, Brockmann C, Krämer U, Miras B, Huc M, Ninõ F, Defourny P, Vancutsem C, Arino O, Ranéra F, Petit D, Amberg V, Berthelot B, Gross D: GLOBCOVER: a 300m global land cover product for 2005 using ENVISAT/MERIS time series. In Proceedings of the Recent Advances in Quantitative Remote Sensing Symposium: 25–29 September 2006. Valencia. Edited by Sobrino JA. Valencia: Universitat de Valencia; 2006:538–542. 32. Vancutsem C, Pekel JF, Bogaert P, Defourny P: Mean Compositing, an
performance assessment for SPOT VEGETATION time series. Int J Remote Sens 2008, 28(22):5123–5141.
33. McGarigal K, Marks B: FRAGSTATS: Spatial pattern analysis for quantifying landscape structure. General Technical Report PNW-GTR-351. US Department of Agriculture Forest Service: Portland; 1995.
34. R Development Core Team: R: A Language and Environment for Statistical Computing, Manual from the R Foundation for Statistical Computing. Vienna: R Foundation for Statistical Computing; 2009.
35. Motyka J: O zadaniach I metodach badan geobotanicznych. Sur les buts et les méthodes des recherches géobotaniques. Lublin: Nakladem universytftu Marii Curie-Sklodowskiej; 1947.
36. Ward JH: Hierarchical grouping to optimize an objective function. J Amer Stat Assoc 1963, 58:236–244.
37. Jain A, Dubes R: Algorithms for clustering data. Englewood Cliffs: Prentice Hall PTR; 1988.
38. Gower J: Some distance properties of latent root and vector methods used in multivariate analysis. Biometrika 1966, 53:325–338.
39. Ter Braak C: CANOCO. A FORTRAN program for canonical correspondence analysis and detrended correspondence analysis. Innovatie Wetenschappelijke Informatievoorziening IWI-TNO: Wageningen; 1985.
40. Du Bus de Warnaffe G, Dufrêne M: To what extent can management variables explain species assemblages? A study of carabid beetles in forests. Ecography 2004, 27:701–714.
41. Titeux N: Modelling species distribution when habitat occupancy departs from suitability– Application to birds in a landscape context. Louvain-la-Neuve, Belgium: PhD thesis. Université catholique de Louvain, Earth and Life Institute; 2006.
42. Hill MO: TWINSPAN - a FORTRAN program for arranging multivariate data in an ordered two-way table by classification of the individuals and attributes. New York: Section of Ecology and Systematics in Cornell University; 1979. 43. Bruelheide H: A new measure of fidelity and its application to defining
species groups. J V Sci 2000, 11:167–178.
44. Tichy L, Chytry M: Statistical determination of diagnostic species for site groups of unequal size. J V Sci 2006, 17:809–818.
45. De Cáceres M, Legendre P: Associations between species and groups of sites: indices and statistical inference. Ecology 2009, 90(12):3566–3574. 46. Sinka ME, Bangs MJ, Manguin S, Chareonviriyaphap T, Patil AP, Temperley
WH, Gething PW, Elyazar IRF, Kabaria CW, Harbach RE, Hay SI: The dominant Anopheles vectors of human malaria in the Asia-Pacific region: occurrence data, distribution maps and bionomic précis. Parasit Vectors 2011, 4:89.
47. Defourny P, Mayaux P, Herold M, Bontemps S: Global Land-Cover Map Validation Experiences : Toward the Characterization of Quantitative Uncertainty. In Remote Sensing of Land Use and Land Cover: Principles and Applications. Edited by Giri CP. Sioux Falls: CRC Press; 2012:207–223. 48. Bontemps S, Arino O, Bicheron P, Carsten B, Leroy M, Vancutsem C,
Defourny P: Operational Service Demonstration for Global Land-Cover Mapping: The GlobCover and GlobCorine Experiences for 2005 and 2009. In Remote Sensing of Land Use and Land Cover: Principles and Applications. Edited by Giri CP. Sioux Falls: CRC Press; 2012:243–264. 49. Zhang Z, Ward M, Gao J, Wang Z, Yao B, Zhang T, Jiang Q: Remote sensing
and diseases control in China: past, present and future. Parasit Vectors 2013, 6:11.
50. Hill DA, Fasham M, Tucker G, Shewry M, Shaw P: Handbook of Biodiversity Methods - Survey, Evaluation and Monitoring. Cambridge: Cambridge University Press; 2005.
51. MacKenzie DI, Nichols JD, Royle JA, Pollock KH, Hines JE, Bailey LL: Occupancy estimation and modeling: inferring patterns and dynamics of species occurrence. San Diego: Elsevier; 2005.
52. Mc Geoch MA, Van Rensburg BJ, Botes A: The verification and application of bioindicators: a case study of dung beetles in a savanna ecosystem. J Appl Ecol 2002, 39:661–672.
doi:10.1186/1756-3305-6-136
Cite this article as: Obsomer et al.: Anopheles species associations in Southeast Asia: indicator species and environmental influences. Parasites & Vectors 2013 6:136.
Submit your next manuscript to BioMed Central and take full advantage of:
• Convenient online submission
• Thorough peer review
• No space constraints or color figure charges
• Immediate publication on acceptance
• Inclusion in PubMed, CAS, Scopus and Google Scholar
• Research which is freely available for redistribution
Submit your manuscript at www.biomedcentral.com/submit