Bourbeau: Statistics Canada
Lefebvre: Université du Québec à Montréal and CIRPÉE
lefebvre.pierre@uqam.ca
Merrigan: Université du Québec à Montréal and CIRPÉE
The analysis is based on Statistics Canada’s Analytical Census Files restricted-access Micro Data Files, which contain anonymized data, collected in the Censuses and are available at the Québec Inter-university Centre for Social Statistics (QICSS), one of the Canadian Research Data Center Network. All computations on these micro-data were prepared by the authors who assume the responsibility for the use and interpretation of these data. We thank the Canada Millennium Scholarship Foundation and the Fonds québécois de la recherche sur la société et la culture for financial support. Emmanuelle Bourbeau was a graduate student when this research was finished.
Cahier de recherche/Working Paper 11-06
Provincial Returns to Education for 21 to 35 year-olds: Results from the 1991-2006 Canadian Analytic Censuses Files
Emmanuelle Bourbeau Pierre Lefebvre
Philip Merrigan
Février/February 2011 (Révisé/Revised)
Abstract:
This paper examines the evolution of the returns to education and experience from 1990 to 2005 in Canada and across the provinces. The focus is on the earnings of young adults, age 21 to 35 at the times of the Censuses, classified by very detailed education groups, age and gender. Returns to higher education are very different across provinces and are particularly high in the western part of the nation. Over time, they are quite stable, but they are increasing for females in 2005 relative to 2000 in particular Bachelor’s degree and higher degrees. This is surprising given the very important increase in the supply of well educated females since 1991. These returns can explain partially why so many young women turned to higher education over time. It is also surprising that males have not followed suit, given that the returns are just as high for them as for women. Yet, the returns for university education are much higher than the returns for college or CEGE. Also, returns for trade degrees are much higher for males than for females. The male-female gap in higher education will certainly help to reduce the wage gap between genders, however, public policy must be concerned by the difference between male and female participation in higher education.
Keywords: Human Capital, Wage Differentials, Returns to Education, Young Workers, Canadian Provinces, Gender
2
Introduction
This paper examines the evolution of the returns to education and experience from 1990 to 2005 in Canada and across the provinces. The focus is on the earnings of young adults, age 21 to 35 at the times of the Censuses, classified by very detailed education groups, age and gender. The measuring of returns to human capital corresponds more closely to the marginal return than the usual “average treatment effect on the treated” (average lifetime earnings streams) estimations. The detailed analysis is achievable because of the very large samples of the non-public analytical Census files (comprised of respondents to the long questionnaire).1
The purpose of the paper is to fill key knowledge gaps in the area on young adult‟s
education returns. Four reasons motivate the focus. First, youths, for their schooling decisions may be influenced by their immediate peer‟s experiences with the rewards from graduation (high school, college or university). Evaluating the short term returns they can expect from their education investments may matter more than information about life-cycle returns. The problem concerns more those youth that hesitate about the benefits of schooling progression because they likely have lower expectations about the rewards from graduation. An
investment model of school attainment would suggest that students ignore future consequence of present decisions (have a high time preference) and/or poorly predict these consequences (as well as their parents), since other explanations such as students or parents financial constraints and the risk of investment in education are less credible (Oreopoulos 2007). This dilemma is less acute for most university level students since they have already higher educational attainments (a high school diploma or college certificate), more motivation to
1
Most households (80%) received the short census questionnaire, which contained eight questions on basic topics such as relationship to Person 1, age, sex, marital status, and mother tongue. One in five households (20%) received the long census questionnaire, which contained the eight questions from the short form plus 53 additional questions on topics such as education, ethnicity, mobility, income, employment and dwelling characteristics. The files sample one out of five respondents to the long questionnaire.
3
graduate given their past investments,2 and have more experience to manage their financial
environment.3
Second, concerns about high school dropouts regularly dominate policy discussions in the field of education. Analysts focus on interventions that will provide incentives for dropouts to eventually return to school and obtain their high school diploma or the equivalent. However, little is known about the returns of such policies that can be costly for governments. A
substantial proportion of high-school graduates in Canada obtain their high-school diploma by way of equivalencies. There is some recent evidence in the United States which shows that strictly focusing on high-school graduation rates as a measure of a successful education policy could be a mistake. In some recent work, Heckman and Lafontaine (2006, 2007), Cameron and Heckman (1993) demonstrate that high-school degrees that are named GEDs (i.e. are obtained by equivalencies) have a questionable value in the labour market. The analysis seeks to determine whether this is also the case in Canada. By extension, the same question can be raised about college and university dropouts.
Third, Canadians possess a large diversity of schooling levels, besides no secondary graduation without further training, many students less inclined to follow a general formation take technical, trade, or vocational classes and may have a trade certificate or diploma, or another non-university certificate or diploma, or both, regardless of whether other educational qualifications are held or not. Another track and topic of interest is the value of College and
2 In Canada, a few studies from diverse data sets (e.g. Survey on Consumer Finances/SCF, Survey of Labour and Income Dynamic/SLID, Youth in Transition Survey/YITS) have analyzed the link between participation in post-secondary education (PSE) and parental income (Corak, Lipps, Zhao 2003; Cristofides, Cirello, and Hoy 2001; Frenette, 2007; Drolet 2005; Rahman, Sity, and Jimmo 2005). They show that participation rates are higher among youth from high-income families with more educated parents. They also provide evidence that the effects of family income have not varied in the late 90‟s and early twenty first century which shows that the increase in university fees across Canada over the nineties have not decreased PSE attendance.
3
Recent American studies on educational achievements downplay the role of credits constraints, student aid or parental income for PSE enrolment (Caneiro and Heckman 2001, 2003; Dynarski 2003; Keane and Wolpin 2001). Instead, these studies insist on the long term effects of parental investment in their children‟s skills at different periods of the life cycle and on family characteristics (Cunha 2007; Cunha and Heckman 2007; Ermisch and Francesconi 2001).
4
CEGEP, particularly diplomas in career and technical field programs versus university transfer programs. Much of the research literature (American and Canadian) on the returns to education have concentrated their analysis on the evolution of the wage gap or skill premium between university-educated workers and those with less education (usually the high school graduates). Analysing the value of a larger variety of schooling attainments are essential for assessing the benefits of the investments in human capital made by individuals and all levels of governments.
Fourth, the analysis contributes to the conclusions about the trends of returns to education in Canada pinpointed by Boudarbat, Lemieux, and Riddell (2010, 2008, and 2006): over the period 1980-2005 earnings gaps between different educations levels of the “adults” aged 16 to 65 years have increased because of the “skill premium” associated with higher education. This paper examines the “within-group” portion contribution to the amount of inequality of earnings within the particular 21-35 age-education-gender group.
The rest of the paper is structured as follows. In Section 2 we survey the recent research on trends of the returns to education in Canada. In section 3, we describe the data sets, the
samples selected, the choice of education levels and wage measures, the independent variables included in the regressions, and the estimation strategy. Section 4 describes the trends in educational attainment. The main results are presented in Section 5. We conclude in Section 6.
2. Review of recent studies
The somewhat confusing picture on the existing Canadian studies on the returns to education is reported and reviewed by Boudarbat, Lemieux, and Riddell (2010, 2008, 2006), and Card and Lemieux (2001) who have conducted the many influential analyses on this subject, and on wage inequality structure in Canada and the USA. A large consensus was that
5
the wage gap between university and high school graduates remained stable during the 1980s and 1990s, and over the 1981-2000 periods, approximately constant for males and declining for females. Using the Census data sets, Bourdarbat, Lemieux, and Riddell (2006) concluded that the skill premium adjusted for experience increased substantially over the periods 1980-2000 and that the return to education for young men also grew substantially during the 1980s and early 1990s, in contrast to other evidence suggesting stable return over the last two decades. They argue that the main reason for these divergent conclusions is the differences in the data sources, the Census providing large sample sizes, consistent information on education attainment as well as earnings and work experience over time.
University graduates
In the updated study, Bourdarhat, Lemieux, and Riddell (20104, 2008) use the public use
data from the 1981, 1986, 1991, 1996 and 2001 Censuses, and two principal alternatives – the Labour Force Survey (LFS) over the periods 1997-2006 and the Survey of Labour and
Income dynamics (SLID) over the periods 1996-2004 - which provide more recent data than that available with the Census. The main analysis focuses on a very large spectrum of “adults” aged 16 to 65 at the time of the Census (June).
For men, they find a large (40%) wage gap between university and high school (HS) graduates which increased steeply between 1995 and 2000. They also find that the return to education for young men also grew substantially during the 1980s and early 1990s, in contrast to other evidence suggesting stable returns over the last two decades. The two education levels below HS (some years of education, some HS) have negative returns (10-20%) relative to a HS diploma. The returns for the two education levels above HS (some postsecondary and postsecondary degree) have low returns compared to HS (respectively 5% and 15%) but are
4
6
slowly increasing over time. The supplementary return for postgraduates over bachelor graduates is around 10% with marginal changes over the years.
For women, the returns to education – as measured by the skill premium relative to high school graduates are systematically larger than for men; and most education wage differentials among women have been relatively constant over time. The return (adjusted for experience) to high school completion has remained stable, as is the case for men. The two education levels below HS (some years of education, some HS) have higher negative returns (15-25%) relative to a HS diploma than for men. The returns for the two education levels above HS (some postsecondary and postsecondary degree) have also higher returns compared to HS (respectively 15% and 18%) but are rather flat over time. The supplementary return for postgraduates over bachelor graduates is around 15% and slightly increasing over the years. The wage gaps adjusted for experience are larger, especially for men, highlighting the importance of controlling for others factors.
Experience-adjusted wage differentials between mean age 46-55 (who have the highest earnings of all age groups) and of other age groups show a substantial and steady increase for the younger age groups (age 16-25 and 26-35). The results confirm the observation in other studies that for the period 1980-1995 returns to experience grew significantly while returns to education remained relatively stable. However, after 1995 earnings of young workers
improved concomitantly with a decline of the wage gap with older workers. Their results also show that the decline in age-wage differentials after 1995 for younger women is much lower than for men. This trend can be explained by the well-known fact women tend to accumulate less actual experience than men over the life-cycle, which lowers returns to age or potential experience. Although, younger cohorts of women are increasingly attached to the labour market, this would increase the age-wage differentials for women.
7
The results from the two alternative data sources (LFS and SLID) - estimated returns to education based on weekly earnings of full-time workers -, support the findings based on the Census data. Results for the post 2000 period, not covered by Census data, show a downward trend in the bachelor-high school wage gap starting in 2003. Thus some of the growth in the return to education over the period 1980-2000 appears to have recently been reversed. But data from the 2006 Census show small increases in experience adjusted earnings for all postsecondary diplomas relative to a high school diploma for 2005 compared to 2000 and a larger wage gap for high school dropouts. The increments are largest for females, especially those with a bachelor‟s degree and the postgraduates.
Post-secondary non-university education
However, the existing education literature has provided few estimates of the returns to post-secondary non-university education in a community college or leading to a trade diploma, and even less for the returns of apprenticeship training (Gunderson 2009). Gunderson and
Krashinsky (2005) use the 2001 Canadian census to estimate an average return of 3.9% for each year of basic education acquired by an individual plus an additional return for completing key phases of education. For example, completing a trade certificate over-and-above
completing high-school provides a rate of return of approximately 3%, although it is negative for females (-3.4%) but positive for males (5.5%).
Boothby and Drewes (2006) use the 1981, 1991 and 2001 Canadian census and also find only small estimates of the earning premium for those with a non-university postsecondary diploma (community colleges, trades institutions, and other vocational educations) compared to high school graduates, with the premium being smaller for females than for males. The premium increased for individuals with both a trade certificate and a high school degree. But the earning premiums are substantially lower than the one for university graduates
8
(specifically for a bachelor's degree). Ferrer and Riddell (2002) use the 1996 Canadian census and estimate rates of return of approximately 8% annually for the completion of a community college or a trade degree compared to HS; the differences between HS graduates and HS dropouts are estimated to be between 12% and 16%, while the same difference between HS graduates and university graduates is significantly higher lying between 36% and 47%.
The only published study to our knowledge specifically on college graduates from community colleges or CEGEPs, is Boudarbat (2008) who uses the National Survey of Graduates (NSG) for years 1990 and 1995 and analyses the earnings of graduates two years after their graduation retaining those aged 16 to 65 years. The former students are categorized in five fields of study and their prospective gains calculated by field of study. It is not clear from the paper which graduates, in terms of their education program (technical, trade, vocational), are retained for his analysis.
Hansen (2006), with the same NSG surveys, analyses wage differentials between university graduates and college graduates (including those from trade schools). He also examines the differentials by domain of studies, and by the type of industry the respondent reports for his job as well as occupations. He finds that the ceteris paribus effects of differences in the type of degree on earnings have decreased from 1992 to 2002 for both males and females.
Furthermore, he computes the internal rate of return for university education (by area of studies and region) relative to a secondary level of education and finds that it slightly increased from 9 to 11% for the aggregate economy.
Hansen (2007), with cycle 3 of the Youth in Transition Survey (YITS), analyses the
earnings difference between post-secondary graduates and high-school graduates by region (4) as well as differences between post-secondary graduates according to their domain of study (7) and their occupations (4). Other dependent variables such as schooling interruptions and the
9
regional mobility of graduates are also used in the paper. The results demonstrate that those who have a high-school degree do better than drop-outs. A perplexing result is that « Low-PSE » (lower than university) graduates do better than « High-Low-PSE » (university graduates). This could be due to the very young age of the respondents in cycle 3 of the YITS (22 to 24). Education effects are found to be stronger for females.
In his review of the research on the returns to education, Gunderson (2009, 27) suggests being careful when interpreting estimated returns:
“Overall, the Canadian evidence on the returns to education generally (but not always) suggests that the economic returns are slightly lower for technical/vocational streams compared to general academic streams. That literature, however, does not deal with effect of unobserved factors such as ability, motivation and organizational skills. Nor does it always account for differences in the length and cost of technical/ vocational programs compared to university. To the extent that effect of unobservable factors such as ability, motivation and organizational skills may be inflating the returns to higher levels of education like university more than they inflate the returns to technical/ vocational education, then the true returns to technical/ vocational education may be understated relative to university. As well, if the technical/ vocational programs are considerably shorter and less costly, then their annualized returns may be understated.”
High school graduates and dropouts
Concerns about high school dropouts regularly dominate policy discussions in the field of education. Analysts focus on interventions that will provide incentives for dropouts to eventually return to school and obtain their high school degree or the equivalent. However, little is known about the returns of such policies that can be costly for governments. A
substantial proportion of high school graduates in Canada obtain their high-school diploma by way of equivalencies. The exact number of young adults who obtain their diploma this way is difficult to ascertain but in the YITS at least 4.2% of females and 5.3% of males obtain their diploma between the ages of 20 and 26.
Using data from the YITS in cycle 3 for the 18-20 year-olds cohort-B (aged 22-24 in December 2003), Campolieli, Fang, and Gunderson (2009) examine 15 outcomes (from wages
10
to employment, to subsequent skill acquisition and to job/pay satisfaction) of dropouts
compared to high school graduates who did not pursue postsecondary education. With respect to the determinants of dropping out (a first stage of their analysis to calculate an instrumented dropout variable), they find no gender effect (which is surprising; provinces are control variables but their estimated parameters are not presented). They find that dropping out of HS compared to youth with a HS degree (but no PSE), is associated significantly with a much lower probability of being employed (18 percentage points lower), of having a stable job (19 points lower), of a lower starting and ending wage in the first job, of lower wages in their final job observed in the sample (20 points lower) and of a lower probability of job training.
According to them, dropouts do not seem to be “able to compensate or substitute for their lack of formal education by acquiring skills through subsequent training.”
Lefebvre and Merrigan (2010) estimate the impact of education, with a particular focus on education levels lower than a university diploma, on the labour market and social outcomes of the 24- to 26-year-old Canadians found in the fourth wave of the Youth in Transition Survey (YITS), conducted by Statistics Canada in 2006. Focusing on differences between individuals who did not pursue college or university level degrees they find that dropouts perform very poorly for most of the outcomes analysed. The most important result is that males who finish their high school degree very late (after 19 years of age), perform, ceteris paribus, at many levels like dropouts.
Influential results, presented by Oreopoulos (2007, 2006, 2005) who uses compulsory schooling laws that force students to take an extra year of school experience, indicate that this extra year of schooling will increase annual earnings on average by 10-12% as well as
generate significant benefits for health, employment, poverty, and raise subjective measures of well-being.
11
There is some recent evidence in the United States which shows that strictly focusing on high-school graduation rates as a measure of a successful education policy could be a mistake. In some recent work, Heckman and Lafontaine (2006, 2007, 2008), Cameron and Heckman (2003) demonstrate that high-school degrees that are named GEDs (i.e. are obtained by equivalencies) have a questionable value in the labour market:
“A substantial body of scholarship summarised in Heckman and LaFontaine (2007) shows that the GED program does not benefit most participants, and that GEDs perform at the level of dropouts in the U.S. labour market. The GED program conceals major problems in American society.” Heckman and Lafontaine (2008)
The papers show that once regression analysis controls for measures of IQ when the child is young, GED graduates sometimes actually do worst in the labour market than dropouts having never received a high-school diploma or the equivalent. This result sheds some doubt on the value of these GEDs. Given their costs, governments may reconsider their investments in this area or try to find policies to increase the value of GEDs.
3. Data sets, samples, measures and estimation strategy
The analysis is based on Statistics Canada's Analytical Census Files restricted-access Micro Data Files. One in five households (20%) received the long census questionnaire, which contained the eight questions from the short form plus 53 additional questions on topics such as education, ethnicity, mobility, income, employment and dwelling characteristics. The files sample one out of five respondents to the long questionnaire.
We first selected youth aged 18 to 35 years in censuses 1991, 1996, 2001 and 2006, and secondly selected only males or females according to criteria presented in Table A1
(restrictions 3): aged more than 20 years, not attending school, non-aboriginal, permanent resident, living in a province, annual wages and salaries>$75 and <$1,000,000, at least one year of working experience, working full-time and at least one week worked, weekly wages
12
and salaries greater than $75 and less than $10,000, and language English, French or both. Table A1 shows the impact on samples sizes of these different restrictions.
Schooling and education
The educational codes available in the different censuses are presented in Table A2. Unfortunately, the education module in the 2006 Census questionnaire underwent significant changes, including new questions and conceptual changes to questions from the former Censuses. As a result, there is an impact of these changes on the historical comparability for some questions (Statistics Canada 2006a, 2006b). However, the educational codes are similar in the three 1991 to 2001 Censuses. To assure some comparability we aggregated some categories for the variable “SecGradR” (with 14 codes for education) available for 1991 to 2001, which is similar to the variable “SSGRAD”5 (with 12 codes) for the 2006 Census
(bottom panel of Table A2). Clearly, the 2006 changes in the categories introduce historical disparities for statistics concerning the most advanced certificate, diploma or degree. Data for the university categories (Bachelor’s degree through to Earned Doctorates) are comparable over time. The total category for College, CEGEP or other non-university certificate or diploma is comparable over time. The new category “Secondary (High) School Certificate
or Equivalent” is problematic because prior censuses did not refer to high school
equivalencies. It is possible that several individuals were categorized with no HS degrees
5
“Refers to the possession of a high school graduation certificate or its equivalent, regardless of whether other educational qualifications are held or not. This variable separates the population into those persons with and those without a high school graduation certificate or its equivalent. It also provides information on any additional education that may have been completed by these two populations. The education questions in the census underwent significant changes in 2006 and, as a result, not all variables are historically comparable. For the first time, the 2006 Census included an explicit question asking Canadians to report whether they had completed high school, with a separate category for completion of high school equivalencies. This change was made to address suspected underreporting of high school completions. In previous censuses, all levels of education were included in a single list, with some respondents reporting only their highest credential rather than all credentials earned. In addition to the changes to the questionnaire, the secondary (high) school graduation variable was derived differently in 2006 than in 2001 with a focus on completed credentials. These changes have resulted in only six of the categories in the high school graduation or equivalency variable being comparable to previous censuses: 'No high school certificate or equivalency certificate without further schooling' and 'With high school certificate or equivalency certificate with a university degree' – from Bachelor's degree to Earned doctorate degree.” (Census Codebook, Statistics Canada 2006).
13
before 2006 even if they did have an equivalent in hand. The Apprenticeship or Trades Certificate or Diploma components of this category that specify the type of trades certificate
obtained were newly introduced in the 2006 Census and therefore cannot be historically compared. There is large increase in the category University Certificate below bachelor level in 2006 compared to 2001. Statistics Canada (2006a) recommended that users not
compare this category in 2006 with previous censuses.
Table A3 present the educational attainment of youth (21-35 years old) by gender for the four censuses. There are few large gaps between 2001 and 2006 for the categories 2 to 5. Dependent variable
The Censuses do not provide information on annual hours of work (only hours in the Census reference week). Hence, it is not possible to construct a direct measure of yearly average hourly wages. Following Card and Lemieux (2001), Boudarbat, Lemieux and Riddell (2006, 2008 and 2010) and many U.S. studies such as Katz and Murphy (1992), we use weekly earnings of full-time workers as our measure of wages.6
Independent variables
Measuring the returns to education may involve several pitfalls and biases such as endogenous skills and return to experience:
“The literature on the returns to education does suggest that estimating an earnings equation with education as the key explanatory variable may provide an adequate
approximation for estimating the returns to education. The resulting returns may overstate the true returns because higher educated people may have more natural ability and some of the returns may simply reflect the effect of ability. The returns, however, may understate the true returns because education is often measured with error and such measurement error leads to an attenuated effect biased towards zero. The literature that accounts for
6 Bourdabat, Lemieux, and Riddell. (2008) results, using broader earnings measures such as including self-employment earnings, using weekly earnings of all workers, using annual earnings of full-time workers or hourly wages in the reference week, shown that their principal findings from their benchmark analysis based on weekly wage and salary earnings of full-time workers are the same. “However, the use of broader measures of the impact of education does increase the magnitudes of the estimated returns, in some cases quite substantially. These increases in the magnitudes of the returns arise because higher education is associated with a larger amount of work – as well as a “skill premium. The use of broader measures also tends to result in greater growth in the return to education over the period 1980-2000.”
14
these factors suggests that they roughly offset each other so that not accounting for either (as in a simple earnings equation) may provide a reasonable approximation to the returns to education.” (Gunderson 2009, 26)
Boudarbat, Lemieux, and Riddell (2010, 66) clearly sum up the reasons for the validity of our approach:
“A further observation is that, when comparing the earnings of groups with different levels of education it is usually important to also control for other factors that may influence earnings. Otherwise the differences in earnings between two educational categories may understate or overstate the true returns to education. For example, because of rising
educational attainment over time, older (and thus more experienced) workers are generally less well educated than younger, and less experienced, workers. Comparing the earnings of the well educated to the less well educated will tend to understate the true impact of
education if one does not control for differences in labour market experience.”
Besides the ten education dummies variables (high school is the reference category), the independent variables are potential experience measured by age minus years of schooling minus six. The other control variables are four dummy variables for age at immigration (the reference category is age less than 6 years at immigration or born in Canada); the province of residence (reference is Ontario), and two dummies variables for language (English, French, the reference is English and French).
Estimation strategy
A series of regression-adjusted (for experience and other controls) estimates are obtained with standard least square regression of the log of wages for each Census and gender. Results for the three 1991 to 2001 Censuses are more comparable since they use the same categories for education. The regressions performed are the following:
1. Simple OLS estimation of Log of weekly wages with 10 education variables and the other controls variables, that is experience, experience squared, age at immigration, language and province.
15
2. Log of weekly wages regressions on interacted education-experience dummies and the other controls variables, potential experience squared, age at immigration, language and province (the base case is high school only, Ontario, born in Canada, English and French). 3. Log of weekly wages regressions with interacted education-province dummies. The other control variables are: experience, experience square, ages at immigration, languages (the base case is high school only in all provinces, born in Canada, English and French). 4. Log of weekly wages regressions with interacted education-age dummies. Three age groups were formed (21-25 years old, 26-30 years old, 31-35 years old) to insure larger sample sizes for the higher education levels and the 21-25 year-olds age group. The sample size for earned doctorate was too small to be splinted in age groups and was ignored. The controls variables are: experience, experience square, ages at immigration, languages and provinces (the base case is high school graduates aged 26 to 30 years, Ontario, born in Canada, English and French).
4. Descriptive statistics on educational attainment and mean weekly wages
In Table A3, we present the percentage of females and males in each education category for the four censuses. The first two panel‟s present statistics computed with all the individuals in our sample (all females and all males) while the bottom ones are computed with the regression sample (see restrictions 3, in Table A1). The comparison of trends in the two samples (all and selected) for both gender shows that they are similar, while the selected samples are slightly more numerous in upper levels of education (e.g. medical, master, doctorate) or less present in some degrees where graduates are less likely to be wage-earners.
The changes in the census questions concerning high school and trade categories between 2001 and 2006 make interpretations for these categories more difficult. Clear trends emerge however from 1991 to 2001 for lower levels of education and we believe the changes from
16
2001 to 2006 are in part a reflection of these trends. In particular, there is a very large drop in the percent of individuals that are reported as not having graduated from high school. For females, in the full sample, the drop is from 20.8 to 9.7, while for males it is 24.3 to 13.4.
There is also a large decrease in the proportion of individuals declaring having graduated from high school with no further training. The same is true for the percentages in the Trade and Apprenticeship category. For this same time period, proportions in all college and university categories increase by a substantial margin (males in parenthesis); by 4.4 (14.8) percentage points for college or CEGEP; 2.5 (2.5) for those with a university certificate; 9.3 (4.5) for bachelor degrees; 1.4 (0.7) for higher than bachelor degree; 2.7 (1.6) for a master‟s degree or more. What is striking is that the increase is substantially larger for females in all university categories, leading to a very large gap in favour of females in higher education. The total increase at the university level is 15.9 points for females and 9.3 for males.
We present the same percentages for our regression sample in the bottom panel and the conclusions are similar except that the percentages in higher education in this sample are obviously much higher than in the full sample as participation rates in the labour market increase with education.
The male-female university gap is likely a major inefficiency in the economy. There is little evidence in the literature concerning large gaps in particular skills that can explain such these differences between the sexes. The increase in the supply of females had little effect on the returns to education, making it possible that a parallel increase in the supply of university level educated males would not have had a major depressing effect on wages or productivity. It seems to us that the demographic trends that will ultimately reduce the work force would have a much lower impact on governmental budgets if productivity substantially increased. The increase in female education leads us to believe that such an increase could also be possible
17
for males, but the question remains how to achieve this increase. The mean of weekly wages (in $2002) of full-time workers by census (income year), gender and education levels are summarized in Table A4.7
5. Estimation results
5.1 Regression-adjusted wage gaps and returns to experience
Table 1 present for the four censuses OLS estimations of the log of weekly wages regressed on 10 education variables and control variables: experience, experience squared, age at
immigration, language and province (the base case is high school only, Ontario, born in Canada, English and French).
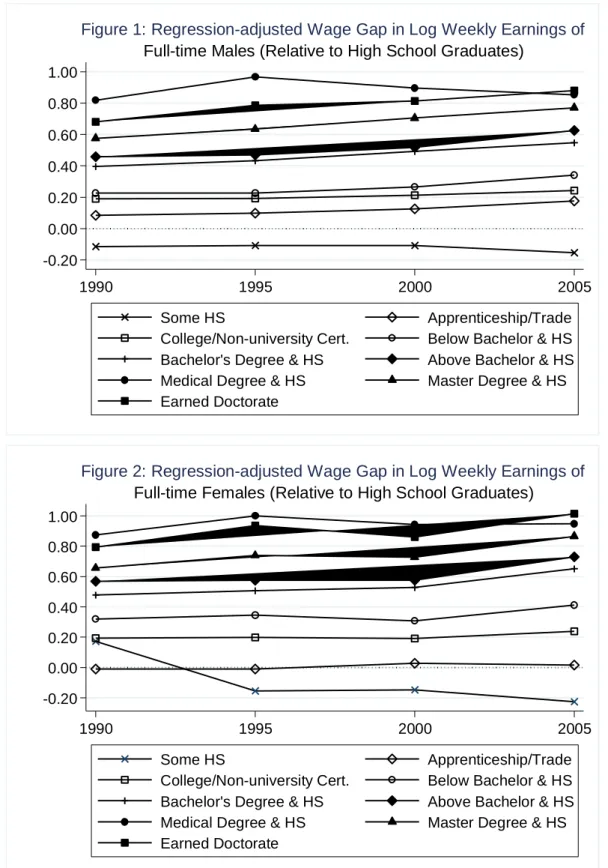
We start our analysis with the log wage regression results of the 2006 sample (2005 wages), by male and female respondent (last column of Table 1). We will later discuss results across different censuses and the possible impact of certain changes in the classifications discussed earlier. The difference in log wages provides a close approximation to the percentage
difference in wages. We interpret differences in log wages as percentage point differences for presentation purposes. For example, we call a 0.10 difference in log wages a “10 percent difference.” The advantages, percent wise, of obtaining a degree are higher for females for all university level degrees starting with university degrees lower than a bachelor degree right up to the doctorate level. The coefficients for all these categories are approximately 0.1 higher than for males, approximately 10 percent. To be clear, this does not mean that females with a university degree do better than males. It means that the earnings gap between those with a high school degree and a university level degree is considerably higher for females compared to males. At lower levels of education, we observe that females with a slightly higher degree than high school have lower coefficients than males, in particular those with a Trade diploma
7
A supplementary Table S4, available from the authors, presents disaggregated educational attainments statistics by province and census.
18
as the coefficient for males is almost .200 while it is .017 for females, the largest difference between males and females for a particular category. The experience coefficients are very similar at .071 for females and .081 for males, while the numbers for experience squared are the same. For both genders, the gap between university education graduates and high school graduates is very high. Even for those with a university degree lower than a bachelor‟s degree, the coefficient is .413 for females and .342 for males. There is also a substantial gain moving from this degree to a bachelor‟s degree, which has the coefficient .548 for males and .651 for females. There is another 20 percent gain for a master‟s degree and an additional 10 percent gain for the doctorate for females and 15 percent for males. Finally, the gain from a medical degree is similar to the gain from a doctorate degree. Gains from college are practically
identical for both groups. The negative consequences from dropping out are larger for females. We performed the same regression for wages in years 1990, 1995, and 2000 (first columns of Table 1) and plot the education coefficients for males and females in Figures 1 and 2 respectively. For males, the returns for each degree (compared to high school only) have increased since 1991, particularly for degrees that are higher than college. For example, the return from a college degree moves from .189 to .242 while the increase for a bachelor‟s degree changes from .396 to .548. The same can be said of females. However, the Trade degrees have little value for females over time. Therefore, the returns to higher education have considerably increased for both males and females, increasing at the same time income
inequality in the Canadian economy.
We also conducted regressions where the potential experience variable is interacted with the highest diploma obtained (Table S1, a supplementary Table available from the authors). What is striking is that the returns to experience are very similar across education groups and genders in 2005, and have basically increased for all education groups since 1991, in particular
19
for females. In 1990, the returns for females range between .03 and .06 but are mostly between .05 and .06, while in 2005, the returns to an additional year of potential experience range between .067 and .103 while they are, for 8 out 9, between .07 and .085. For males, the
increase is not as impressive but remains substantial. Given that the returns to higher education are very high relative to high school and that the returns to experience are similar across groups, this implies that inequality will be increasing rapidly over time as individuals gain more experience.
5.2 Regression-adjusted wage gaps by province
We then performed the same regression including education interacted with provincial dummy variables, the reference category in this case being Canadians with a high school degree. We are comparing individuals with particular degrees with an individual chosen at random within the population of individuals across Canada, who have as their highest degree a high school diploma, again by gender. The estimation results are presented in Table S2 (a supplementary Table available from the authors), and are summarized in a series of graphs (Figures 3.1 to 3.9) by gender and by type of degree. In each graph, we plot the estimated value of the interacted province-education dummy variable for each census year. Before analysing provincial trends, we first consider the results for 2005.
We start with females. For all degrees less than university level, the same pattern emerges. The value of the parameters increases as we move from East to West. Dropouts do very poorly in all Atlantic Provinces, Québec and Saskatchewan. All coefficients are negative, showing that dropouts all across Canada do more poorly than the average Canadian with a HS only. For the Trade category, Atlantic Provinces and Québec do poorly as well as Manitoba. Ontario and Western provinces have coefficients very close to 0.
20
The Trade/Apprenticeship category shows a very clear-cut distinction between the Atlantic Provinces and the rest of the country. The coefficients are close to 0 or positive in all
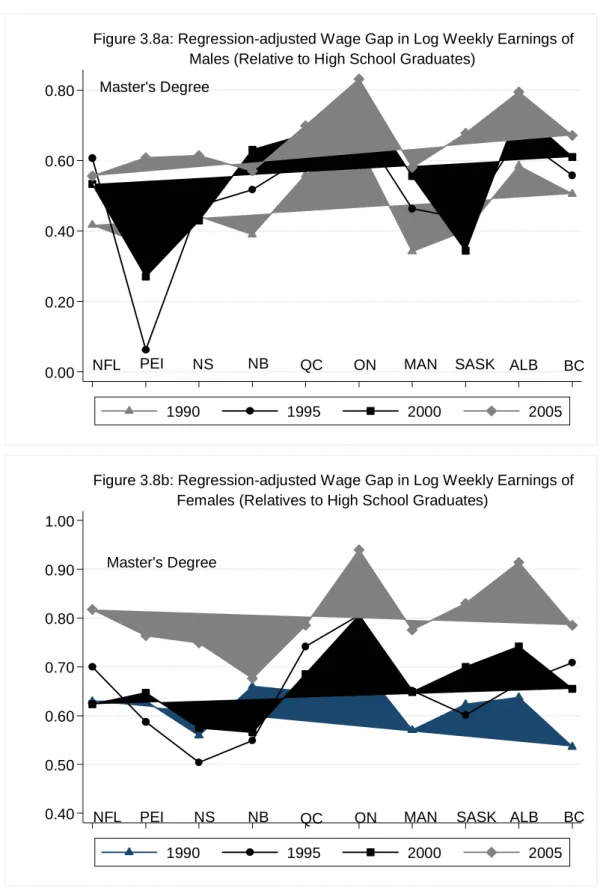
provinces except the Atlantic Provinces where they are strongly negative. The growth pattern that is very clear is much less apparent when we look at degrees that are obtained at the university level. Most provinces present a positive College return for all years. The first university degree which is lower than a Bachelor‟s degree shows that the coefficients are larger in the West, in Ontario and in Quebec. BC, Québec, and Manitoba and Saskatchewan are very similar, while Ontario and Alberta stand out at the top. The difference in weekly earnings is close to 30 percent for the top and bottom groups. For a Bachelor‟s degree, the range between top and bottom is between .5 and .7. For the Master‟s degree, Ontario and Alberta again stand out, but the range is now from .7 to .8 for the rest of the country. For a Doctorate, the coefficients are all superior to 1, except for Québec which curiously is around .9. The results show that the gap between high school only and university degrees is very high all across Canada.
The same pattern of increasing coefficients from east to west is apparent for males as well and in particular for lower level diplomas. Amazingly, dropouts in Alberta have ceteris paribus higher weekly wages than the average Canadian with a High School diploma only. The
dropout effect is slightly smaller for males than females. The Trade coefficients have the same pattern for males but are shifted upwards compared to females. The Alberta coefficient is very high at .4. The coefficients for College are similar for both males and females, but there is a huge spike for males in Alberta where the coefficient reaches 0.4. The peak for females is slightly lower than 0.3. The Atlantic Provinces coefficients are small relative to Western Provinces. The below Bachelor coefficients are very similar to females. Male Bachelor‟s degree coefficients are about .10 smaller across Canada. We have the same shift downwards
21
relative to females for graduate degrees. There is no particular shift for medical degrees. Therefore, higher education is relatively more profitable for females across the nation. Provincial trends from 1990 to 2005
We now discuss from these same figures the trends for the coefficients from 1990 to 2005. For individuals with no High School diploma, it is quite amazing that the provincial patterns have not changed from year to year and from 1990 to 2000, they are very close to each other. The shift downwards in 2005 is probably due to the fact that some individuals with High School diploma equivalencies were included in the High School degree category in the former years. The comparisons should be valid for categories that are higher than high school degree. For the Trade group, again the provincial patterns are amazingly similar from census to census. We observe a huge increase in Alberta and Saskatchewan in 2005 which is due to the energy industry. For those with a College degree, the provincial patterns are practically identical and the coefficients are quite similar but are a bit higher in the West starting from Manitoba. For the lower university degree group, there is a noticeable upward shift which is clearly seen for males and which is much slighter for females. For a Bachelor‟s degree, the upward shift is very clear for females in particular in the Western Provinces and the Atlantic Provinces. This larger shift for women is also observed for a degree higher than a Bachelor‟s degree but not a Master‟s degree, this shift from 2000 to 2005 is between .1 and .2 which is very large. The upwards shift for females which is smaller than for the case of a Bachelor‟s remains noticeable. For males, an upward shift is observed in PEI, Nova Scotia and
Saskatchewan. For medical degrees, there is considerable variation from 2000, but sometimes it is negative and sometimes positive for both sexes. For Doctorates we observe once more the upwards shift for females in six provinces.
22
Therefore, there is a distinct large upward shift in the return for university degrees in the case of females. This could be due to the fact that the reference category consists in 2006 of both high school and equivalent diplomas. However, in related work (Lefebvre and Merrigan 2010), we find that females in 2006 with equivalencies have similar wages to those with a regular high school degree. Therefore, the addition of this group in the reference group should not have a very large effect and the bias in the university level effects should be small. A factor that would negatively bias the results is that the university graduation rate has increased in the last five years for women. Indeed, assuming that those new graduates are from the bottom of the distribution of unobserved skills, the university coefficients should be biased downwards. It is our opinion that the gain from a university education compared to a high school education has increased from 2001 to 2006 for females. Therefore, we observe an increase in the returns of higher education in all provinces for both males and females, but in particular for females. This result for females is not observed in Boudarbat, Lemieux, and Riddell (2010) who work with a much extended age group.
5.3 Regression-adjusted wage gaps by age groups (age profiles)
In this section we present estimates of wage gaps by age group. Education dummies were interacted with three age groups (21-25, 26-30, and 31-35). The reference category is high-school for the age group 26-30. The estimation results are presented in Supplementary Table S3 (available from the authors), and are summarized in a series of graphs (Figures 4.1 to 4.4) done by census year and gender.
Estimated age profiles for each education category are produced for each year. We
concentrate on the higher level categories, College, University diploma lower than a Bachelor degree (Below Bachelor), and Bachelor. For the first three censuses, the profiles for each type of degree are practically identical from year to year starting at a relatively low level for ages
23
21-25 with returns increasing substantially with age. Also, the profiles of men and women are practically the same. The 2006 census is considerably different as the coefficients are all positive and start out relatively high for both males and females at ages 21-25 for all three groups. However, the profiles are very flat for both sexes. One exception is College females, for whom they are actually decreasing, dropping from 0.277 for the youngest to 0.208 for the eldest.
Why do we observe these changes for the age profiles in 2006? The reference category is „High School Only‟ for the 26-30 ages group in all years; however, this group in 2006 includes individuals with equivalencies. This was not the case in the earlier years. We would expect this change of the composition of the reference category to have an effect on the level of the coefficients rather than on the profiles. If the change in composition is not responsible for the change in 2006 of age profiles, we must turn to the fact that earnings can now be obtained from the tax file of the respondents so that these changes in profiles may depend on the change in measure rather than the changes in composition of the reference category.
We now turn to individuals with a level of education that is lower than College or
University. Starting with the “dropouts” (Some High School), once again the age profiles are practically identical with a slight gap in favour of males for 1990, 1995, and 2000. The 2005 profile for Dropouts is much flatter than the previous years as for the PSE graduates and the gap between males and females is very wide, in favour of males, at .1. For the Trade group, in 2005, the profile is decreasing for both sexes with a very large gap in favour of males, almost .15 at the ages of 31-35, while we observe a monotonic increase for the coefficients with a .05 gap in favour of males for the first three censuses. For the High-School group, the profile is also very flat compared to earlier years.
24
6. Conclusion
Returns to higher education compared to the average Canadian with a high-school degree are very different across provinces and are particularly high in the western part of the nation, even for diplomas lower than a postsecondary education (PSE). This may cause a problem over time as better qualified individuals from the Atlantic Provinces will have increased incentives to move west, causing disequilibrium in the federation. Over time, returns are quite stable, but they are substantially higher for females in 2005 relative to 2000, in particular for a Bachelor or higher degrees. This is surprising given the large increase in the supply of well educated females since 1991. These returns can explain partially why so many young women turned to higher education over time. It is also surprising that males have not followed suit, given that the returns are high as well. Future research should be focused on why males are not choosing a university level education at the same rate as women. Most empirical evidence shows that differences in qualifications as measured by test scores cannot explain this gap.
One possible cause may be rationing in university departments that historically have attracted males, such as engineering, medical schools, and computer science. This may induce males to apply to colleges for some kind of technical training. Yet, the returns for university education are much higher than the returns for college or CEGEP. Also, returns for trade degrees are much higher for males than for females.
Financial considerations as well as perceptions may be at play. On the one hand students weighing the benefits of further education against potential costs may make some teenagers less willing to pay a given price for a PSE and choose the less costly options (trade or college over university). Using a high-stakes laboratory experiment involving high school students, Palameta and Voyer (2010), investigate the roles of willingness to pay (price sensitivity and loan aversion) and find that groups that are currently under-represented in PSE (students from
25
low-income families, from families with no history of PSE, Aboriginal students, and boys) are prone to these barriers. And, as we mentioned earlier, changes in education returns can also reflect changes in ability obtained by other means than education.
On the other hand, perceptions of PSE costs and benefits, of time and efforts, and the tendency by youth to discount the future may lead some to adopt a stopping rule for schooling decisions that does not maximize the the present value of earnings over the life cycle. Brand and Xie (2010) present evidence that those with the lowest propensity for getting a PSE are the most likely to benefit the most from it. Usher (2005) finds that Canadians with low income are more likely than others to overestimate the average costs and underestimate the average benefits of university education which lead many to conclude that PSE would not be a good investment. Furthermore, increasing gender gaps in PSE participation has been increasing because females contrary to males have been following the rewards (Christofides, Hoy, and Yang 2009).
The male-female gap in higher education will certainly help reduce the wage gap between genders; however, public policy must be concerned by the difference between male and female participation in higher education. If this is caused by a lack of supply in university admissions in certain fields, this certainly can be remediated with increased public funding of universities. The very high returns in these areas would create both private and public gains that would be well appreciated in these difficult financial times.
One clear message of this paper to young adults in Canada about education and earnings is that returns to PSE are high even at a young adult age. This could dissipate the general
perception by low-income high-school level students that PSE education is a bad and risky investment as well as the perceptions of parents with no PSE experience, and those who tend to discount more highly the future. The other challenge is to change perceptions of the high
26
cost of a PSE investment and the riskiness of taking out loans and grants for pursuits in higher education.
27
References
Boudarbat, B., T. Lemieux, and W.C. 2010. “The Evolution of the Returns to Human Capital in Canada, 1980-2005.” Canadian Public Policy –Analyse De Politique,36(1): 63-89. And Canadian Labour Market and Skills Researcher Network, Working Paper No. 53, January 2010.
Boudarbat, B., T. Lemieux, and W.C. Riddell. 2008. “The Evolution of the Returns to Human Capital in Canada, 1980-2006.” University of British Columbia January, 2008.
Boudarbat, B., T. Lemieux, and W.C. Riddell. 2006. “Recent Trends in Wage Inequality and the Wage Structure in Canada.”In Dimensions of Inequality in Canada ed. D.A. Green and J. Kesselman. Vancouver: UBC Press.
Boothby, D., and T. Drewes. 2006. “Post-secondary Education in Canada: Returns to University, College and Trades Education.” Canadian Public Policy, 32(1): 1-22.
Boudarbat, B. 2008. “Earnings and Community College Field of Study Choice in Canada.” Economics
of Education Review, 27(1): 79-93.
Brand, J.E., and Y. Xie. 2010. “Who Benefits Most from College? Evidence for Negative Selection in Heterogeneous Economic Returns to Higher Education.” American Sociological Review, 75(2): 273-302.
Carneiro, P., and J. Heckman. 2002. “The Evidence on Credit Constraints in Post-Secondary Schooling.” The Economic Journal, 112(482): 705–734.
Carneiro, P., and J. Heckman. 2003. Human Capital Policy. In Inequality in America: What Role for Human Capital Policies? Ed. J. J. Heckman, A. B. Krueger, and B. M. Friedman. Cambridge, MA: MIT Press.
Christofides, L., J. Cirello, and M. Hoy. 2001. “Family Income and Post-secondary Education in Canada.” The Canadian Journal of Higher Education 31(1): 177-208
Cameron, S., and J. Heckman. 1993. “The Nonequivalence of High School Equivalents.” Journal of
Labor Economics, 11(1, Part 1): 1-47.
Campolieti, M., T. Fang, and M. Gunderson. 2009., “Labour Market Outcomes and Skills Acquisition of High-School Dropouts.” Working Paper No. 16. Canadian Labour Market and Skills Researcher Network, at http://www.clsrn.econ.ubc.ca/home.php.
Card, D., and T. Lemieux. 2001. “Can Falling Supply Explain the Rising Return to College for Younger Men? A Cohort-Based Analysis.” Quarterly Journal of Economics, 116(2): 705-46.
Corak, M., G. Lipps, and J. Zhao. 2003. “Revenu familial et participation aux études postsecondaires.” Direction des études analytiques, Cat. No. 11F0019MIF2003210. Ottawa : Statistique Canada. Christofides, L.N., M. Hoy, and L. Yang. 2009. “The Gender Imbalance in Participation in Canadian
Universities (1977-2003).” Working Paper No. 2791. CESifo at http://www.cesifo.de/.
Cunha, F., and J. Heckman. 2007. “Formulating, Identifying and Estimating the Technology of Cognitive and Non-cognitive Skill Formation.” Journal of Human Resources, 43(4):738-782. Drolet, M. 2005. “Participation aux études postsecondaires au Canada : le rôle du revenu et du niveau
de scolarité des parents a-t-il évolué au cours des années 1990?” Direction des études analytiques: documents de recherche. Statistics Canada. Cat. No. 11F0019MIF2005243. Ottawa: Industry Canada. Statistique Canada.
Dynarski, S. 2003. “Does Aid Matter? Measuring the Effect of Student Aid on College Attendance and Completion.” American Economic Review, 93(1): 279-288.
Ermisch, J., and M. Francesconi. 2001. “Family Matters: Impacts of Family Background on Educational Attainments.” Economica 68(270): 137-56.
Ferrer, A., and W.C. Riddell .2002. “The Role of Credentials in the Canadian Labor Market.”
Canadian Journal of Economics, 35(4): 879-905.
Frenette, M. 2007. “Why are Youth from Lower-income Families Less Likely to Attend University? Evidence from Academic Abilities, Parental Influences, and Financial Constraints.” Statistics Canada, Analytical Studies Research Paper Series No. 295. Ottawa: Industry Canada.
Gunderson, M. 2009. “Review of Canadian and International Literature on Apprenticeships.” Report to Human Resources and Social Development Canada.
28 Gunderson, M., and H. Krashinsky. 2005. “Returns to Education and Apprenticeship Training.” Ontario:
Ontario Ministry of Training Colleges and Universities.
Hansen, J. 2007. “Education and Early Labour Market Outcomes in Canada.” Report prepared for Learning Policy Directorate, Strategic Policy, SP-793-12-07E. Human Resources and Social Development Canada.
Hansen, J. 2006. “Returns to University Level Education: Variations within Disciplines, Occupations and Employment Sectors,” Report prepared for Learning Policy Directorate, Strategic Policy, SP-662-09-06E. Human Resources and Social Development Canada.
Heckman, J.J., and P.A. LaFontaine. 2008. The GED and the Problem of Noncognitive Skills in
America, Chicago: University of Chicago Press, Forthcoming.
Heckman, J. J., and P. A. LaFontaine. 2007. “The American High School Graduation Rate: Trends and Levels.” NBER Working Paper No. 13670, at http://www.nber.org.
Heckman, J.j. and P. LaFontaine. 2006. “Bias Corrected Estimates of GED Returns,” Journal of Labor
Economics, 24(3): 661-700.
Katz, L., and K. Murphy. 1992. “Changes in Relative Wages, 1963-1987: Supply and Demand Factors.” Quarterly Journal of Economics, 107(1): 35-78.
Keane, M., and K. Wolpin. 2001. “The Effect of Parental Transfers and Borrowing Constraints on Educational Attainment.” International Economic Review, 42(4): 1051-1103.
Lefebvre, P., and P. Merrigan. 2010. “Labour Outcomes of Graduates and Dropouts of High School and Post-secondary Education: Evidence for Canadian 24- to 26-year-olds in 2005.” Working Paper 10-45. CIRPÉE at http://www.cirpee.org/recherche/cahiers_du_cirpee/2010.
Oreopoulos, P. 2007. “Do Dropouts Drop Out Too Soon? Wealth, Health and Happiness from Compulsory Schooling.” Journal of Public Economics, 91(11–12): 2213–29.
Oreopoulos, P. “The Compelling Effects of Compulsory Schooling: Evidence from Canada.” Canadian
Journal of Economics, 39(2): 22-52.
Oreopoulos, P. 2005. “Canadian Compulsory School Laws and their Impact on Educational.” Analytical Studies Branch Research Paper Series. Statistics Canada. Cat. No. 11F0019MIE, No. 251. Ottawa: Industry Canada.
Palameta, B., andJ.-P. Voyer. 2010. “Willingness to Pay for Postsecondary Education Among Under-represented Groups –Report.” Toronto: The Higher Education Quality Council of Ontario. Rahman, A., J. Situ, and V. Jimmo. 2005. “Participation in Postsecondary Education: Evidence from
the Survey of Labour Income Dynamics.” Statistics Canada. Cat. No. 81-595-MIE2005036. Ottawa: Industry Canada.
Usher, A. (2005). “A Little Knowledge is a Dangerous Thing.” Toronto: Educational Policy Institute. Statistics Canada. 2006. “Education Reference Guide, 2006 Census.” Cat. No.97-560-GWE2006003.
Ottawa: Industry Canada.
Statistics Canada. 2006. “Income and Earnings Reference Guide, 2006 Census.” Cat. No. 97-563-GWE2006003. Ottawa: Industry Canada.
29 -0.20 0.00 0.20 0.40 0.60 0.80 1.00 Ed u ca ti o n W a g e G a p 1990 1995 2000 2005 Some HS Apprenticeship/Trade
College/Non-university Cert. Below Bachelor & HS Bachelor's Degree & HS Above Bachelor & HS Medical Degree & HS Master Degree & HS Earned Doctorate
Full-time Males (Relative to High School Graduates)
Figure 1: Regression-adjusted Wage Gap in Log Weekly Earnings of
-0.20 0.00 0.20 0.40 0.60 0.80 1.00 Ed u ca ti o n W a g e G a p 1990 1995 2000 2005 Some HS Apprenticeship/Trade
College/Non-university Cert. Below Bachelor & HS Bachelor's Degree & HS Above Bachelor & HS Medical Degree & HS Master Degree & HS Earned Doctorate
Full-time Females (Relative to High School Graduates)
30
High School Diploma
NFL PEI NS NB QC ON MAN SASK ALB BC
Some High School
-0.40 -0.30 -0.20 -0.10 0.00 0.10 Pr o vi n ci a l W a g e G a p 1990 1995 2000 2005
Males (Relative to High School Graduates)
Figure 3.1a: Regression-adjusted Wage Gap in Log Weekly Earnings of
NFL PEI NS NB QC ON MAN SASK ALB BC
High School Diploma
Some High School
-0.50 -0.40 -0.30 -0.20 -0.10 0.00 0.10 Pr o vi n ci a l W a g e G a p 1990 1995 2000 2005
Females (Relative to High School Graduates)
31
High School Diploma Trade Diploma
NFL PEI NS NB QC ON MAN SASK ALB BC
-0.20 -0.10 0.00 0.10 0.20 0.30 0.40 0.50 Pr o vi n ci a l W a g e G a p 1990 1995 2000 2005
Males (Relative to High School Diploma)
Figure 3.2a: Regression-ajusted Wage Gap in Log Weekly Earnings of
High School Diploma
Trade Diploma
NFL PEI NS NB QC ON MAN SASK ALB BC
-0.30 -0.20 -0.10 0.00 0.10 Pr o vi n ci a l W a g e G a p 1990 1995 2000 2005
Females (Relative to High School Graduates)
32
High School Diploma College Diploma
NFL PEI NS NB QC ON MAN SASK ALB BC
-0.10 0.00 0.10 0.20 0.30 0.40 Pr o vi n ci a l W a g e G a p 1990 1995 2000 2005
Males (Relative to High School Graduates)
Figure 3.3a: Regression-adjusted Wage Gap in Log Weekly Earnings of
High School Diploma College Diploma
NFL PEI NS NB QC ON MAN SASK ALB BC
-0.10 0.00 0.10 0.20 0.30 Pr o vi n ci a l G a g e G a p 1990 1995 2000 2005
Females (Relative to High School Graduates)
33
Below Bachelor's Degree
High School Diploma
NFL PEI NS NB QC ON MAN SASK ALB BC
-0.20 -0.10 0.00 0.10 0.20 0.30 0.40 0.50 Pr o vi n ci a l W a g e G a p 1990 1995 2000 2005
Males (Relatives to High School Graduates)
Figure 3.4a: Regression-ajusted Wage Gap in Log Weekly Earnings of
High School Diploma Below Bachelor's Degree
NFL PEI NS NB QC ON MAN SASK ALB BC
-0.10 0.00 0.10 0.20 0.30 0.40 0.50 Pr o vi n ci a l W a g e G a p 1990 1995 2000 2005
Females (Relative to High Diploma)
34
Bachelor's Degree
High School Diploma
NFL PEI NS NB QC ON MAN SASK ALB BC
0.00 0.10 0.20 0.30 0.40 0.50 0.60 Pr o vi n ci a l W a g e G a p 1990 1995 2000 2005
Males (Relative to High School Graduates)
Figure 3.5a: Regression-adjusted Gap in Log Weekly Wages of
High School Diploma Bachelor's Degree
NFL PEI NS NB QC ON MAN SASK ALB BC
0.00 0.10 0.20 0.30 0.40 0.50 0.60 0.70 Pr o vi n ci a l W a g e G a p 1990 1995 2000 2005
Females (Relative to High School Graduates)
35
High School Diploma Above Bachelor's Degree
NFL PEI NS NS QC ON MAN SASK ALB BC
0.00 0.10 0.20 0.30 0.40 0.50 0.60 0.70 Pr o vi n ci a l W a g e G a p 1990 1995 2000 2005
Males (Relative to High School Graduates)
Figure 3.6a: Regression-adjusted Wage Gap in Log Weekly Earnings of
High School Diploma Above Bachelor's Degree
NFL PEI NS NB QC ON MAN SASK ALB BC
0.00 0.10 0.20 0.30 0.40 0.50 0.60 0.70 0.80 Pr o vi n ci a l W a g e G a p 1990 1995 2000 2005
Females (Relative to High Graduates)
36
Medical Degree
NFL NS NB QC ON MAN SASK ALB BC
0.30 0.40 0.50 0.60 0.70 0.80 0.90 1.00 1.10 1.20 1.30 1.40 Pr o vi n ci a l W a g e G a p 1990 1995 2000 2005
Males (Relative to High School Graduates)
Figure 3.7a: Regression-adjusted Wage Gap in Log Weekly Earnings of
Medical Degree
NFL NS NB QC ON MAN SASK ALB BC
0.40 0.60 0.80 1.00 1.20 1.40 Pr o vi n ci a l W a g e G a p 1990 1995 2000 2005
Females (Reltative to High School Graduates)
37
Master's Degree
NFL PEI NS NB QC ON MAN SASK ALB BC
0.00 0.20 0.40 0.60 0.80 Pr o vi n ci a l W a g e G a p 1990 1995 2000 2005
Males (Relative to High School Graduates)
Figure 3.8a: Regression-adjusted Wage Gap in Log Weekly Earnings of
Master's Degree
NFL PEI NS NB QC ON MAN SASK ALB BC
0.40 0.50 0.60 0.70 0.80 0.90 1.00 Pr o vi n ci a l W a g e G a p 1990 1995 2000 2005
Females (Relatives to High School Graduates)
38
Earned Doctorate
NFL NS NS QC ON MAN SASK ALB CB
0.30 0.40 0.50 0.60 0.70 0.80 0.90 1.00 Pr o vi n ci a l W a g e G a p 1990 1995 2000 2005
Males (Relative to High School Graduates)
Figure 3.9a: Regression-adjusted Wage Gap in Log Weekly Earnings of
NFL NS NB QC ON MAN SASK ALB CB
Earned Doctorate 0.30 0.40 0.50 0.60 0.70 0.80 0.90 1.00 1.10 1.20 Pr o vi n ci a l W a g e G a p 1990 1995 2000 2005
Females (Relative to High School Graduates)
39 -.20 0.00 0.20 0.40 0.40 0.80 Ed u ca ti o n a l W a g e G a p 25 30 35 Age Group
Some High School High School
Trade College
Below Bachelor Bachelor
Above Bachelor Medical Degree
Master
Relative to 26-30 years Old High School graduates in 1990 Figure 4.1a: Wage Gap of Males in log of Weekly Earnings by Age
-0.40 -0.20 0.00 .20 0.40 0.80 0.60 Ed u ca ti o n a l W a g e G a p 25 30 35 Age Group
Some High School High School
Trade College
Below Bachelor Bachelor
Above Bachelor Medical Degree
Master
Relative to 26-30 Years Old High School Graduates in 1990 Figure 4.1b: Wage Gap of Females in log of Weekly Earnings by Age
40 1.00 -.40 -.20 0.00 0.20 0.40 0.80 0.60 Ed u ca ti o n a l W a g e G a p 25 30 35 Age Group
Some High School High School
Trade College
Below Bachelor Bachelor
Above Bachelor Medical Degree
Master
Relative to 26-30 Years Old High School Graduates in 1995 Figure 4.2a: Wage Gap of Males Males in Log of Weekly Earnings by Age
-0.40 -0.20 0.0 0.20 0.40 0.60 0.80 1.0 Ed u ca ti o n a l W a g e G a p 25 30 35 Age Group
Some High School High School
Trade College
Below Bachelor Bachelor
Above Bachelor Medical Degree
Master
Relative to 26-30 Years Old High School Graduates in 1995 Figure 4.2b: Wage Gap of Females in Log of Weekly Earnings by Age
41 -0.40 -0.20 0.00 0.40 0.80 0.60 0.40 0.20 1.0 Ed u ca ti o n a l W a g e G a p 25 30 35 Age Group
Some High School High School
Trade College
Below Bachelor Bachelor
Above Bachelor Medical Degree
Master
Relative to 26-30 Years Old High School Graduates in 2000 Figure 4.3a: Wage Gap of Males in Log of Weekly Earnings by Age
-0.40 -0.20 0.0 0.20 0.40 0.60 0.80 1.0 Ed u ca ti o n a l W a g e G a p 25 30 35 Age Group
Some High School High School
Trade College
Below Bachelor Bachelor
Above Bachelor Medical Degree
Master
Relative to 26-30 Years Old High School graduates in 2000 Figure 4.3b: Wage Gap of Females in Log of Weekly Earnings by Age
42 -0.20 0.0 0.20 0.40 0.60 0.80 1.0 Ed u ca ti o n a l W a g e G a p 25 30 35 Age Group
Some High School High School
Trade College
Below Bachelor Bachelor
Above Bachelor Medical Degree
Master
Relative to 26-30 Years Old High School Graduates in 2005 Figure 4.4a: Wage Gap of Males in Log of Weekly Earnings by Age
-.20.0 0.20 0.40 0.60 0.80 1.0 0.0 Ed u ca ti o n a l W a g e G a p 25 30 35 Age Group
Some High School High School
Trade College
Below Bachelor Bachelor
Above Bachelor Medical Degree
Master
Relative to 26-30 Years Old High School graduates in 2005 Figure 4.4b: Wage Gap of Females in Log of Weekly Earnings by Age