Cockburn: Corresponding author. Poverty and Economic Policy (PEP) Research Network and CIRPÉE, Université Laval
jcoc@ecn.ulaval.ca
Corong: Centre of Policy Studies, Monash University
Decaluwé: Department of Economics, Université Laval, CIRPÉE and PEP Fofana: Poverty and Economic Policy (PEP) Research Network
Robichaud: Poverty and Economic Policy (PEP) Research Network
Funding for this study was provided by the World Bank-Netherlands Partnership Program (BNPP) and the Poverty and Economic Policy (PEP) research network, which is financed by the Government of Canada through the International Development Research Centre (IDRC) and the Canadian International Development Agency (CIDA), and by the Australian Agency for International Development (AusAID). Our thanks to André Martens for his review of the empirical literature on trade, FDI and growth. We also thank Maurizio Bussolo, André Martens and Rafael de Hoyos for comments and suggestions. Acknowledgments to Joseph Cabral and Fatou Cissé for help in obtaining country data and information.
Cahier de recherche/Working Paper 10-13
The Gender and Poverty Impacts of Trade Liberalization in Senegal
John Cockburn Erwin Corong Bernard Decaluwé Ismaël Fofana Véronique Robichaud Mars/March 2010
Abstract:
Developing countries are deeply engaged in trade negotiations at the bilateral, regional and international (WTO) levels. As imports, exports and tariff duties all occupy an important part of their economies, far-reaching impacts on production, labor and capital markets, household incomes and, perhaps most importantly, economic growth will indubitably ensue. As men and women occupy very different roles in these economies, particularly in terms of the import and export orientation of the sectors in which they work, they will be affected very differently by these reforms. To anticipate these changes, a dynamic economy-wide model is developed with an application to Senegal. Whereas most similar existing studies consider the comparative static resource reallocation effects of trade reforms, ours is the first to focus on the growth effects (“dynamic gains from trade”), which are thought to be possibly much larger.
The trade-productivity link is revealed to be the strongest growth channel, raising GDP by over three percentage points by the end of our 15 year simulation period.
Trade liberalization is found to increase the gender wage gap in favor of men, especially among unskilled workers, as men are more active in export-oriented sectors such as cash crops and mining whereas women contribute more to import-competing sectors such as food crops. Furthermore, the ensuing growth effects further widen the over-all gender wage gap, as the productivity gains from increased openness are greatest in female-intensive sectors in which imports rise markedly. Thus, this suggests the need to implement policies aimed at increasing both unskilled and skilled women’s exposure in labor-intensive export industries, which is currently male dominated.
A linked microsimulation analysis, based on a survey of Senegalese households, show that trade liberalization reduces poverty in Senegal, particularly in rural areas. While the fall in the relative wages of rural workers would initially lead us to believe that rural households would lose the most from trade liberalization, they are in fact compensated by greater consumer price savings, given that they consume more goods from the initially protected agricultural and agro-industrial sectors.
Keywords: Senegal, Trade, Gender, Poverty, Growth
1 Introduction
Female participation in the labor market has increased significantly over the last decade, corresponding to a period of liberalization in most developing countries. Studies show that the feminization of work is greater in industrial sectors and in semi-industrialized economies, where export industries employ more women, than in agricultural sectors and economies2. In semi-industrial economies, liberalization reduces the overall gap between men and women in terms of wage rates, labor market participation and income distribution.
Existing research suggests that trade may favor women in industrial and semi-industrial economies, where women are more active in export-oriented sectors such as garments and light manufacturing. In contrast, in agricultural economies – and in agricultural sectors in (semi-) industrial economies – trade is found to favor men, as they are more likely to be engaged in the production of cash crops for export while women focus on import-competing food crops.
In the majority of African countries, female work constitutes the base of agricultural food production, which is generally import-competing and concentrated in small plots. In these economies, trade liberalization tends to favor male workers and owners of large landholdings, which are more conducive to cash crops for export, whereas female workers involved in food crop production face increased import competition.3
In Senegal, women work primarily in agriculture sector which occupies 77 percent of the Senegalese labour force. Women represent 43 percent of the total labour force and contribute for only 26 percent of employment in non agriculture sector.4 Although, the recent growth has contribute to reduce poverty by 11 percentage points between 1994 and 2002 (DSRP II, 2006)5, still well over half of the Senegalese population, 57 percent (DSRP II, 2006), lives in poverty. Moreover, the absolute number of poor has increased between 1994 and 2002 and many of them are women. 6
Senegal is engaged in the process of liberalizing its external trade under various - unilateral, bilateral, and multilateral - trade negotiations. The import-substitution and export-subsidy policies adopted after independence were liberalized from 1980 onwards, in the context of various structural adjustment programs in the hope of encouraging more efficient resource allocation.
The 100 percent devaluation of the CFA franc in 1994 was an important step in this reform process. Senegal also joined the WTO in 1995 and, following the Uruguay round, consolidated its tariff rates around 30 percent. Quotas have been progressively eliminated and replaced by a temporary surtax on basic goods. In addition, Senegal reduced the level of domestic support to
2
Elson and Pearson (1981), Standing (1989), Wood (1991), Cagatay and Ozler (1995), Joekes (1995 and 1999) and Ozler (2000 and 2001).
3
Fontana et al. 1998 4
Development Indicators database (at http://devdata.worldbank.org) 5
“Document de Stratégie pour la croissance et la Réduction de la Pauvreté, 2006-2010”. 6
The Senegalese population has grown by an average of 2.5 percent over the period of 1994 and 2002 ; World Development Indicators database (at http://devdata.worldbank.org)
agricultural products. At the regional level, Senegal is a founding member of the Economic Community of Western African States (known as CEDEAO), which has the objective of freer trade at the regional level and the creation of a Common External Tariff (CET).
Since 1994 trade liberalization has been reinforced under the Western African Economic and Monetary Union (known as UEMOA) reforms. The objectives of the latter are: the convergence of economic policies and performances of its members; the creation of a customs union; the coordination of sectoral policies. Senegal adopted the UEMOA's Common External Tariff (CET) in January 2000. Thus, all goods entering the customs territory of any UEMOA country, are assessed the same rate of customs duty.7 In 2003, CEDEAO and UEMOA began negotiating an Economic Partnership Agreement (EPA) with the European Union. At the end of the process (2024), it is expected that Senegal will liberalize nearly 80% of total imports from Europe and be granted free access to the European market. Furthermore, Senegal is negotiating new trade agreements with Tunisia, Morocco and Egypt in the context of UEMOA.
In spite of the fact that Senegal, as a less developed country (LDC), has benefited from access to the European and North American markets for products such as textiles, and its increasing participation in different trade agreements, its exports are not expanding significantly. This appears to be due to high production costs and low product quality that makes Senegalese exports less competitive on the world market. Moreover, the domestic support and subsidies for European farmers and strict European quality norms represent serious restrictions to access. The study aims at contributing to the debate on the gender and poverty implications of trade liberalization in the context of Senegal economy. Furthermore, it explores the distribution of the dynamic gains from trade between men and women.
There is strong evidence that openness to international trade creates a more competitive environment, and stimulates the diffusion of new technologies, innovation, the adoption of new methods of production and an increase in the availability of imported inputs.8 All of these factors lead to important productivity and efficiency gains. It is also argued that in the presence of firm heterogeneity, increased trade will lead to a rationalization of output toward the most productive firms9. Moreover, considerable evidence suggests that increased openness also directly favors foreign direct investment10. There is also an important debate concerning the poverty impacts of growth: pro-poor growth.
7
The new legislation set out the four rates: 0 percent on pharmaceuticals, agricultural inputs, capital goods, computer and data processing equipment not produced locally, and social, cultural, and scientific goods; 5 percent on raw materials, crude oil, and grains for industries; 10 percent on semi-finished products, diesel/fuel oil, intermediate goods and other grains; 20 percent on goods for final consumption, capital goods and computer and data processing equipment already available through local production, new and used vehicles. A statistical fee of 1 percent is levied on imported goods, as well as uniform taxes of 1 percent for UEMOA and 0.5 percent for CEDEAO to finance these two regional institutions.
8
For a compact elaboration on these issues see Kim (2000), Keller (2000), and Winters (2004). 9
For important contributions in this area see, among others, Melitz (2003), Bernard et al. (2003), Helpman et al. (2004), Baldwin (2005), Baldwin and Robert-Nicoud (2006), and Gustafsson and Segerstrom (2007).
10
The poverty impacts of growth depend on the specific nature of that growth and the motors driving it. Growth driven by agricultural productivity gains is likely to have vastly different poverty impacts than growth driven by an increase in the prices of a country’s mineral resources. In the same way, the growth impacts of trade liberalization will depend on the initial tariff structure, the composition of a country’s imports and exports, and the participation of the poor in these sectors.
Yet, the analytical tool most suited to opening this black box to track the channels of influence - computable general equilibrium (CGE) models – are typically restricted to a static framework in which poverty impacts result solely from a short term reallocation of resources and growth is not even considered. Thus it is not very that they generally find relatively small welfare and poverty impacts of trade liberalization.
In this paper, we bring the lessons from the broader trade-growth-poverty literature into the CGE framework. The CGE viewpoint in turn allows us to identify and explore in more depth the exact mechanisms and channels through which trade liberalization contributes to the growth process and poverty reduction. In particular, we contrast the short-run and long-run impacts on the economy, welfare and poverty using a sequential dynamic general equilibrium model applied to Senegal. We place particular emphasis on bringing out the gender differences in the direct and growth effects of trade liberalization, particularly in terms of the gender wage gap11.
We apply our framework to the specific case of a complete trade liberalization policy in Senegal. The remainder of this paper is as follows. First, we present a brief overview of the Senegalese context: trade policies, poverty and gender aspects. We then present a short review of the literature on the links between trade, growth, gender and poverty. In section three, we present the salient characteristics of our model before analyzing the impacts of our simulation of complete trade liberalization in Senegal in section four. Section five concludes.
2 Gender, Poverty and Trade in Senegal: A review
The process of trade liberalization in Senegal takes place in a context of economic reforms under the Poverty Reduction and Growth Facility (PRGF) program of the International Monetary Fund and the World Bank quoted in the Poverty Reduction Strategy Papers (PRSP). The PRSP is a roadmap describing the Government programs and measures to be implemented for the reduction of poverty as presented by the Millennium Development Goals, among others, eradicate extreme poverty and hunger, and promote gender equality and empower women.
The Senegalese economy posted a stable and sustained annual growth rate of 5 percent following the 1994 CFA franc devaluation. The improvement of the budgetary situation and the boom in public investment, followed by an increase in private investment, were the main sources of growth over the past decade (Azam, Dia and Tsimpo, 2005). Higher investment created higher growth, which in turn contributed to a reduction in poverty. Indeed, poverty fell by 10.8
11
Other possible gender effects involve labor market participation, adjustments in the time devoted to domestic work and leisure, bargaining power and the intra-household allocation of resources, although we focus only on the wage channel in this analysis.
percentage points – from 67.9 percent to 57.1 percent – between 1994 and 2002, although this still represents well over half of the Senegalese population. More recently, 64 per cent of interviewed households noted an increase of poverty over the last five years (DRSP II, 2006). Furthermore, recent growth has been found to be neither pro-rural nor pro-poor in Senegal, creating an increase in inequality (Azam et al., 2005). Therefore, as recent studies (Dollar and Kraay, 2001 and IBRD/World Bank, 2005) point out, growth is a necessary, but not sufficient, condition for poverty reduction in Senegal.
In 2001/02, female-headed households were found to have a lower incidence of poverty than their male counterparts: 37 and 51 per cent, respectively (DRSP II, 2006). Badji and Daffé (2004) argue that the number of poor female-headed households increased between 1991/92 and 1994/95. In contrast, Badji and Boccanfuso (2006) found a substantial drop of this proportion between 1994/95 and 2001/02, from 55.0 to 37.0 percent. The proportion of male-headed households under the national poverty line has also dropped during the same period, from 62.6 to 51.0 percent. The decline of poverty among female-headed households is less dramatic in Dakar, than in other urban and rural areas. The poorest are headed be females with little or no education. The proportion of poor female headed-households fell between 1994/95 and 2001/02, regardless of their level of schooling according to Badji and Buccanfuso (2006), although the drop was greater for women with low levels of education i.e. those not reaching secondary school. This suggests that the poverty reduction programs may have affected low-educated women more than their higher educated counterparts.
Several past studies have looked at the impacts of trade liberalization in Senegal.
Ezenwe (1982) found that many low-income countries in West Africa experienced slower growth and industrialization in the 1970s than the 1960s, as they adopted an import substitution strategy that restricted the growth in trade. In contrast, middle-income developing countries increased their export and posted better growth performance. Senegal was among the latter group of countries and experienced an expansion in trade and strong economic growth.
Boccanfuso, Cabral, Cissé, Diagne and Savard (2003) suggest that 50 percent increase of international prices of grains will likely increase poverty in Senegal. High poverty increase will be observed in urban than rural areas and educated household head in Dakar and in rural areas will be worse off. The price increase of cereal negatively impact agriculture and food manufacturing; labor income of unskilled workers deteriorate while skilled workers are better off.
Fofana, Cockburn, Decaluwe, Diagne, Cissé and Cabral (2005) integrate all households from a national representative survey of the population into a CGE model and show that unilateral tariff reduction will not contribute, at least in the short term, to reduce poverty, in particular in rural areas where the highest poverty levels are observed. The reform will not benefit rural poor because of their high dependency to agriculture income and consumption, as well as the low share of imported commodities in the rural households’ consumption basket. They found that the traditional character - less intensive in imported inputs – and the lack of export opportunities limit the possibility of agriculture to cope with higher competition of imports induced by the trade reform.
Annabi, Cissé, Cockburn and Decaluwé (2005) analysed the relationship between trade, growth and poverty in Senegal. They conclude that the elimination of tariffs on all imports would likely have strong growth and poverty reduction impacts in the long run and also reduce poverty in the short run. They also found that full liberalization worsens income distribution in Senegal with greater gains among urban dwellers and the non-poor.
Maertens and Swinnen (2006) on trade, standards, and poverty in Senegal argue that enhancing quality and safety standards will not constitute a barrier for trade and poverty reduction in Senegal. They show that high-standards trade, although contributing to switch production from smallholder contract-based farming to large-scale integrated estate production will “mainly altered the mechanism through which poor households benefit: through labor markets instead of product markets”. These changes had a stronger poverty reduction impact in Senegal through the labor market mechanism as workers moved from small-contract farming to large-scale farms. Cockburn, Decaluwé and Robichaud (2007) bring together lessons drawn from the CGE analysis of the impacts of trade liberalization on poverty in Bangladesh, Benin, India, Nepal, Pakistan, the Philippines and Senegal. They found that unilateral tariff reduction increases welfare and reduces poverty; the reform is pro-urban and may increase rural poverty as non agriculture sectors benefit relatively more than agriculture sectors.
While increased trade might benefit Senegal as a whole, there is a growing concern about it distributional impacts between poor and non-poor. Although the assessment of the impacts of trade liberalization on the Senegalese economy and population has received some interest in the literature, none of the previous analysis has focused on the distributional impacts between men and women. Moreover, the only trade-related motors of growth accounted for (Annabi et al., 2005) are the reduction in the cost of imported investment goods and the reallocation of income between households with different savings rates.
3 Analytical framework
Dynamic computable general equilibrium (CGE) models can be classified as intertemporal or sequential (recursive). Intertemporal dynamic models are based on optimal growth theory where the behavior of economic agents is characterized by perfect foresight. In a number of circumstances, and particularly in a developing country, it is hard to assume that agents have perfect foresight. For this reason we believe that it is more appropriate to develop a sequential dynamic CGE model. In this kind of dynamics agents have myopic behavior. To the extent that the investment decisions are truly forward-looking, reality is probably somewhere between these two extreme hypotheses.
A sequential dynamic model is basically a series of static CGE models that are linked between periods by behavioral equations for endogeneous variables and by updating procedures for exogenous variables. Capital stock is updated endogenously with a capital accumulation equation, whereas population (and total labor supply) is updated exogenously between periods. It is also possible to add updating mechanisms for other variables such as public expenditure,
transfers, technological change or debt accumulation. Below we present a description of the static and dynamic aspects of the model. We focus our discussion on the new characteristics of the model and those most relevant to the gender-trade-growth nexus, the rest being standard for most CGE models. A complete list of equations and variables is presented in annex 4.
3.1 Activities
On the production side we assume that in each sector there is a representative firm that generates value added by combining labor and capital. We adopt a nested structure for production. Sectoral outputXS is a Leontief function of value added i t, VA and total intermediate consumptioni t, CI . i t,
Value added is in turn represented by a CES function of unskilled labor LNQ and a composite i t,
factor KLQ , which is in itself a CES function of capital i t, KD and skilled labor i t, LQ . We i t,
assume that the degree of substitutability is lower between capital and skilled labor than between the composite capital factor and unskilled workers. The basic intuition is that, for a given technology, any increase in capital intensity requires an almost proportionate increase in skilled labor. Thus, in this way, capital accumulation is “skilled biased”, increasing the demand for skilled versus unskilled labor. In this context, the lack of skilled labor could be one of the factors limiting the growth process (equation numbers refer to the full model specification provided in Annex 1): i t i t i VA v XS, = , / (1) t i i t i io XS CI, = ⋅ , (2)
(
)
(
)
VA i VA i VA i 1 t i VA i t i VA i t i VA i t i A LNQ 1 KLQ VA θ α ρ α ρ ρ − − − + − ⋅ ⋅ ⋅ ⋅ = , , , , (4)(
)
(
)
KL i KL i KL i 1 t i KL i t i KL i KL i t i A LQ 1 KD KLQ α ρ α ρ ρ − − − + − ⋅ ⋅ ⋅ = , , , (9)All variables have a sector index i and a time index t, as the model is solved recursively over the entire period of analysis.
3.2 Labor
We again follow a nested structure for the composition of the different types of labor. On a first level, among skilled workers (LQ ), we assume that there is imperfect substitutability between i t,
urban (LDTUNQ i t, , ) and rural workers
(
LDTRNQ i t, ,)
. The same assumption is adopted for unskilled workers (LNQ ), which we assume to be composed of imperfectly substitutable urban i t,(LDTUQ i t, , ) and rural workers
(
LDTRQ i t, ,)
:(
)
(
)
1 , , , 1 , , LNQ LNQ LNQ i i i LNQ LNQ LNQ i t i i UNQ i t i RNQ i t LNQ A α LDT ρ α LDT ρ ρ − − − = ⋅ ⋅ + − ⋅ (7)(
)
(
)
LQ i LQ i LQ i 1 t i RQ LQ i t i UQ LQ i LQ i t i A LDT 1 LDT LQ α ρ α ρ ρ − − − + − ⋅ ⋅ ⋅ = ,, ,, , (11)At a second level, among skilled and unskilled rural and urban workers, we assume that male
, ,
l i t
MLDT and female workers FLDTl i t, , are also imperfect substitutes.
(
)
(
)
LG i l LG i l LG i l 1 t i l LG i t i l LG i l LG i l t i l A FLDT 1 MLDT LDT , , , , , , , , , , , ρ ρ ρ α α ⋅ − + − ⋅ − − ⋅ = (13)From these equations, we can derive the demand equations for each of the factors of production12. Finally, the market equilibrium conditions determine factor and product prices13. In particular, we assume that all labor markets clear:
∑
∑
= I t i l H t l h MLDT MLS ,, ,, (63)∑
∑
= I t i l H t l h FLDT FLS ,, ,, (64)where FLSh l t, ,
(
MLSh l t, ,)
is the household endowment in female (male) labor of type L. Total male and female labor supply are assumed to increase at the exogenous population growth rate. Data constraints prevented us from breaking down rural workers by skill level in Senegal. In Uganda, a rural/urban disaggregation was impossible, although the skill disaggregation distinguishes elementary workers, who are even less skilled than unskilled workers.Some limits of the current analysis merit discussion. First, we assume that the unemployment rate is fixed and that labor market participation rates are fixed. Consequently, the main gender impact of trade liberalization is seen through wage effects. While this is a serious limitation to our analysis to be addressed in future research, as labor demand is driving all of these effects, the results would not change qualitatively. For example, where trade liberalization is found to be pro-female, we would expect to see an increase in female labor market participation and a fall in their unemployment rates, which would both moderate female wage gains. However, they would also likely further boost growth effects. Furthermore, we do not explore the impacts of changes in female income shares on their bargaining power and the resulting intra-household allocation of resources. Other gender impacts of trade identified in the literature would also merit exploration in future research: reduced gender wage discrimination in the face of increased competition (Becker, 1959), skilled- (or gender-) biased technological progress, etc.
3.3 Households and government
Households earn their income (YHh,t) from the remuneration of their production factors: female and male labor income and their share of the total returns to capital. They also receive dividends (DIVh,t), government transfers (TGh,t) and remittances from abroad (TROW_Hh,t):
12
See equations 6, 8, 10, 12, 13, 14 in Appendix 1. 13
(
)
, , , , , , , , , , , , _ , h t h t l t h l t l t h l t i t i t t L I t h t h t t h t KH YH wf FLS wm MLS r KD KS PINDEX TG DIV e TROW H⎛ ⎞ = ⋅ + ⋅ +⎜ ⎟⋅ ⋅ ⎝ ⎠ + ⋅ + + ⋅
∑
∑
(16)where wfl t,
(
wml t,)
is the wage rate for female (male) workers of type L and ri,t is the sectoral rate of returns to capital. Thus, we can see that the distributional impacts of trade and growth will channel in part through their impacts on factor returns and the relative endowments of each household category in these factors.Household demand for goods and services is derived from a Cobb-Douglas utility function after deduction of savings and direct taxes to the government14. Household savings and capital accumulation are discussed below in the “Motors of growth” section.
The only “non-traditional” aspect of our modeling of government is the assumption that the government deficit (surplus) is a constant share of the GDP:
t 0 0 t GDP GDP SG SG = ⋅ (25) 3.4 Dynamics
In every period the sectoral capital stocks (KDi t,+1) is updated with a capital accumulation equation involving the rate of depreciation (δ ) and investment by sector of destination INDi t, . This equation describes the law of motion for the sectoral capital stock. It assumes that stocks are measured at the beginning of the period and that the flows are measured at the end of the period. New investments are allocated between the different sectors through an investment demand function that is similar to Bourguignon et al. (1989), and Jung and Thorbecke (2003)15. The capital accumulation rate – the ratio of investment to capital stock – is increasing with respect to the ratio of the rate of return to capital ri t, and its user cost Ut. The user cost is equal to the dual price of investment (PK ) multiplied by the sum of the depreciation rate and the interest rate t ir .
The elasticity of the rate of investment with respect to the ratio of return to capital and its user cost is assumed to be equal to 2. The sum of investments by sector of destination is equal to total investment (IT), which is, in turn, determined by total savings.
(
)
it t i 1 t i KD 1 IND KD,+ = , −δ + , (68) K i t t i i t i t i U r KD IND σ φ ⎥ ⎦ ⎤ ⎢ ⎣ ⎡ = , , , (35) 14See equations 17, 31 and 33 in Appendix 1. 15
See for example the work by Lemelin and Decaluwe on investment demand equations. Abbink, Braber and Cohen (1995) use a sequential dynamic CGE model for Indonesia where total investment is distributed as a function of base year sectoral shares in total capital remuneration and sectoral profit rates.
(
+δ)
⋅ = t t t PK ir U (53)∑
⋅ = I t i t i PK IND IT , (67)All inter-agent transfers in the model increase at the exogenous population growth rate. The exogenous dynamic updating of the model includes variables like transfers and volumes like government expenditures or minimum consumption of household that are indexed to relevant price indices16. The model is formulated as a static model that is solved recursively over a 15-year time horizon17. The model is homogenous in prices and the exchange rate is the numéraire in each period.
3.5 Motors of growth a) Capital good prices
The most immediate motor of growth in our model is the reduction in the cost of imported investment goods and, through import competition, their domestically-produced counterparts. This brings down the investment good price index and, consequently, increases total investments (equation 67 above) and capital accumulation (equation 68), where the investment good price index is given by:
(
)
∏
= i it i t i PC PK , μ μ (52)b) Differential household savings rates
A second channel in our core dynamic model stems from difference in the marginal propensities to save between household categories. If a shock leads to a redistribution of income towards household with high savings rates, this will increase capital accumulation and growth at the expense of current consumption. Of course, the opposite is true if redistribution favors the big spenders.
In addition to these “standard” motors of growth, we have introduced a number of other motors of growth that appear prominently in the econometric literature on growth.
c) Technological progress and efficiency
The impacts of increased openness on technological progress and productive efficiency at the sectoral level are captured by a parameter (θi t, ) in the value added function. This is, in turn, a
function of the change in the degree of openness of the sector relative to the base year (superscript 0). We measure the degree of openness as the sum of sectoral imports (IMm t, ) and
exports (EXx t, ) as a percentage of sectoral output XSi t, 18.
16
See equations 73 to 82 in the appendix 1 17
The model is formulated as a system of non linear equations solved recursively as a non-linear programming system (NLP) with GAMS/Conopt3 solver.
18
(
)
(
, ,)
, 0 0 , 0 0 0 , / 1 0 / PT i t i t i t i t i t i i i i i IM EX VA or if EX IM IM EX VA σ θ =⎡⎢ + ⎤⎥ θ = = = + ⎢ ⎥ ⎣ ⎦ (5)Based on a review of the empirical literature commissioned in the context of this study, the elasticity of productivity with respect to openness ranges roughly between 0.34 and 0.7419. We have adopted an elasticity of 0.5.
Other formulations are possible. In the empirical literature, the focus is often solely on import penetration ratios, often restricted to imports from developed countries, as the principal channel of influence of trade on productivity. This will be the subject of further research.
d) Foreign investment
We assume that trade liberalization creates an environment that favors the investment of foreign savings in Senegal. First, foreign investors are more attracted by an open economic environment, which we capture by including an economy-wide openness index in the determination of the current account balance, which is equal to foreign savings invested in Senegal20. Second, to the extent that trade liberalization increases the returns to capital, this will further increase net capital inflows (CAB) from abroad:
(
)
(
)
0 0 0 0 0 0 0 / / FSO FSR t t t t t t t IM EX GDP rmoy PINDEX CAB CAB GDP GDP rmoy PINDEX IM EX GDP σ σ ⎡ + ⎤ ⎡ ⎤ ⎢ ⎥ = ⋅⎢ ⎥ ⋅ + ⎢ ⎥ ⎣ ⎦ ⎣ ⎦ (61)As a percentage of GDP (the sum of sectoral value added), the current account deficit will increase with respect to its base value if the average rate of return on capital (rmoyt PINDEX ) t
or the economy-wide degree of openness (
(
IM +EX)
GDP increases.21 Based on a review of the empirical literature commissioned for this study22, we adopt an estimate of 0.04 for the elasticity of substitution of foreign investment with respect to openness and 0.5 with respect to the rate of return to capital.Note that several other formulations could be considered. First, the above relationship could be restricted to FDI alone, assuming that all other elements of the capital and financial accounts of the balance of payments are, for example, a fixed proportion of GDP. Second, it is likely that FDI (or all net foreign capital inflows) are, at least to some extent, sector-specific. It would be possible to apply the above equations at a sectoral level, where FDI in a given sector would depend on the sectoral returns to capital and the sectoral openness index.
19
See Martens (2008b). For empirical studies see, for example, Jonsson and Subramanian (2001) and Arora and Bhundia (2003), both focusing on South Africa.
20
Note that the causality may also be inversed. As trade and foreign investment are determined simultaneously in a CGE model, what is important is that they are complements, rather than substitutes.
21
See equations 50 and 51 in Appendix 1 22
e) Endogenous household savings rates
In static CGE models, the savings behavior of households is generally very simple. The saving rate is a simple parameter measuring either the average or the marginal saving rates of each household category. We enrich this framework by assuming that household savings rates are sensitive with respect to changes in the real rate of returns to capital. More specifically we define the following equation:
t h 0 0 t t h t h YDH PINDEX rmoy PINDEX rmoy SH HS h , , ⋅ ⎥ ⎥ ⎦ ⎤ ⎢ ⎢ ⎣ ⎡ ⋅ = σ ψ (18)
Over time, the relative capital endowments of each representative household change according to their savings. Households with a higher savings rate will have a faster growing capital stock and will consequently earn a growing share of total capital income generated in the economy. In particular, after depreciation, the capital stock belonging to household h will increase according to their savings:
(
)
, , 1 , 1 h t h t h t t SH KH KH PK δ + ⎛ ⎞ = − + ⎜⎜ ⎟⎟ ⎝ ⎠ (69)where PKt is the investment price index. All other agents accumulate capital in the same way:
−
F irms: 1(
1)
t t t t SF KF KF PK δ + ⎡ ⎤ = − + ⎢ ⎥ ⎣ ⎦ (70)−
R est of world: 1(
1)
t t t t CAB KROW KROW PK δ + ⎛ ⎞ = − + ⎜ ⎟ ⎝ ⎠ (72)−
G overnment: 1(
1)
t t t t SG KG KG PK δ + ⎡ ⎤ = − + ⎢ ⎥ ⎣ ⎦ (71)and all agents receive a share of total returns to capital equal to their share in the capital stock. 3.6 Data
The study uses the 2004 Social Accounting Matrix (SAM)23 elaborated from the Supply and Use Table (SUT)24 for the same year. The matrix includes 35 industries (six primary, 19 industrial and 10 in services), eight productive factors, and one representative household. Gender (male and female), geographical (urban and rural), and skill (educated and uneducated) dimensions are used to break down labor into six categories. Formal and informal capital are also presented in the SAM; the former is defined as the physical capital owned by corporations, while the latter represents the physical capital used in individual and household enterprises
23
Fofana and Cabral (2007) 24
Made available by the Senegalese National Statistical and Demographic Agency «Agence Nationale de la Statistique et de la Démographie».
The SAM explicitly presents trade and transport margins, which appear as intermediate demands for the trade and transport sectors. It also provides detailed information on transfers (received and sent) for all household categories. Domestic tax receipts and import duties are also indicated, allowing us to undertake our trade policy experiments.
3.7 Microsimulation model
Following Ravallion and Loksin (2004), we build a simple non behavioral (micro accounting) microsimulation model in order to obtain a first-order approximation of the poverty impacts of full trade liberalization in Senegal over the full 15-year simulation period. Underlying data are obtained from the 2001/2002 Senegalese household survey (“Enquête Sénégalaise Auprès des Ménages 2”). Household consumption data are aggregated according to the 35 product categories appearing in the CGE model. On the income side, household capital endowments are grouped into agriculture and non agriculture capital, as in the CGE model. In the same way, labor incomes are grouped according to the location (rural vs. urban), sex (male vs. female) and skill level (skilled vs. unskilled) of workers. The structure of other expenditures (taxes and transfers to other households and to the rest of the world) and income (transfers from other households and from the rest of the world) are also grouped to correspond to the structure in the CGE model. The average tax and saving rates of households are taken from the CGE-model, but the micro-simulation model adds a fixed household specific savings and tax parameter to capture household heterogeneity.
The variations in all factor prices generated by the CGE simulations are then used to calculate income variations for all households. Given fixed average savings and income tax rates and the average variation in all net transfers (which are simply indexed to an economy-wide price index), we then calculate the change in total consumption for each household. Consumption values are finally deflated by the change in household-specific consumption price indices (CPI), which are weighted by the budget share of each product in the household’s total consumption. The poverty line used in 143,445 FCFA and is kept constant as we already deflate consumption values by the CPIs. Base year and post-simulation values for household consumption are then used to calculate corresponding poverty and inequality measures.
4 Simulation Scenario and results
The study simulates a unilateral complete elimination of import duties in Senegal. Although the magnitude of this import liberalization scenario is unlikely to be implemented in Senegal, in the absence of clear trade-liberalization agenda, one can take this policy shock as an upper bound of the likely impacts of import liberalization in Senegal.
The government makes up its lost tariff revenue through the introduction of a uniform compensatory sales tax that is endogenously determined in order to keep the public deficit constant as a share of GDP; this sales tax is roughly 2 percent. We focus first on the short-term (first year) effects, before noting any substantial differences in the long-term (last year) effects.
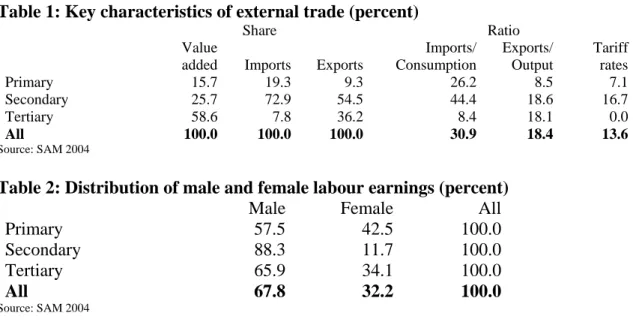
Before, looking at the simulation results, some key characteristics of international trade in Senegal are provided in Table 1. Note, first, that the service sector represents almost 60 percent of value added in Senegal. In terms of international trade, it is clearly the industrial sector that is likely to be the most directly affected by the removal of import tariffs given that the overwhelming majority of imports are industrial, import intensities are highest in this sector and these imports initially face the highest tariff rates. For the same reason, the primary sector is likely to be more directly affected than the service sector. At the same time, the industrial sector also appears poised to benefit most from any ensuing export expansion, with over half of all exports and the highest export intensities, although it is closely followed by the service sector. The primary sector appears least likely to take advantage of export opportunities.
The distribution of male and female labor income is presented in Table 2. At the national level, the labor earnings of men are twice higher than of women, as men are more active in the labor market than women. The gender labor earnings gap is lower in Primary sector, but increases substantially in the secondary sector. Thus, putting together figures presented in tables 1 and 2 one would expect that the import liberalization shock performed in this study is likely to affect differently men and women in Senegal.
Table 1: Key characteristics of external trade (percent)
Share Ratio Value
added Imports Exports
Imports/ Consumption Exports/ Output Tariff rates Primary 15.7 19.3 9.3 26.2 8.5 7.1 Secondary 25.7 72.9 54.5 44.4 18.6 16.7 Tertiary 58.6 7.8 36.2 8.4 18.1 0.0 All 100.0 100.0 100.0 30.9 18.4 13.6 Source: SAM 2004
Table 2: Distribution of male and female labour earnings (percent)
Male Female All
Primary 57.5 42.5 100.0 Secondary 88.3 11.7 100.0 Tertiary 65.9 34.1 100.0 All 67.8 32.2 100.0 Source: SAM 2004 a. Short-run effects
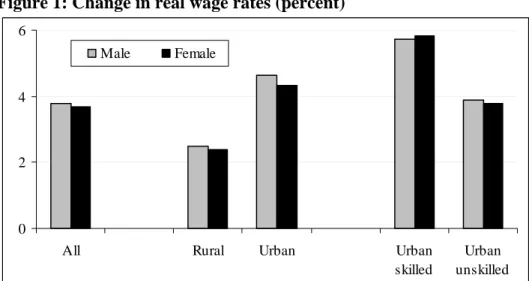
The gender-specific analysis presented in figure 1 indicates that import liberalization increases the over-all gender wage gap, albeit marginally. This increase is more pronounced in urban than rural areas, where skilled (female and male) workers witness a higher increase in their real wage than their unskilled counterparts. The gender wage gap falls for skilled workers while it increases for unskilled workers. The gender gap increases among unskilled workers, whereas it diminishes among skilled workers. Our poverty analysis confirms that households experience a fall in poverty, far more among other urban households than Dakar and rural households. Indeed, poverty falls more among male-headed households relative to their female counterparts. In next,
we track the channel by which men and women are impacted by the full removal of import duties.
Figure 1: Change in real wage rates (percent)
0 2 4 6
All Rural Urban Urban
skilled
Urban unskilled Male Female
Figure 2: Change in poverty incidence (percent)
Senegal -1.5 Dakar -1.5 Other urban-1.9 Rural -1.3 Male hh -1.6 Female hh -1.3 Note: hh = headed-household
Given that the sectors with the highest initial levels of tariff protection are primarily industrial, in particular the agricultural-based industries (meat products, grain products, food processing, beverages, tobacco and leather) and oil refining. It is naturally in these sectors that import prices fall most and import volumes increase most (Table 3). In contrast, the service sectors, most agricultural sectors and several of the industrial sectors are subject to low or moderate import tariffs and thus have a small or even negative import response . The 2 percent compensatory sales tax slightly offsets the fall in primary and industrial import prices, while leading to a small increase in the import prices of importable services.
Overall, our simulation indicates that the elimination of import tariffs would lead to a 2.4 percent increase in output and a 2.1 percent increase in GDP (value added) immediately in the first year
(Table 3). As we will discuss in more detail later in the document, this result is almost entirely driven by the productivity/efficiency gains from increased openness, as we assume that any increase in capital stock in the first year only becomes productive in the second year.
The sectoral distribution of this output effect depends not only on the initial tariff rates and import response, but also on the degree of exposure of each sector to import competition and their capacity to capitalize on the emerging export opportunities. Indeed, the sectors posting the most substantial output growth following trade liberalization (Table 3) – hospitality, meat products, other services, chemical products, tobacco, and fishery – are characterized by high export orientation (Annex 1; export/output ratio) and, generally, low import competition (Annex 1; import/consumption ratio). In contrast, the main contracting sectors – transport material, machinery, paper products and grain products – all face moderate to high initial tariff protection, substantial import competition and limited export markets25.
The output effects in the agricultural (subsistence agriculture, cash crops and livestock) and forestry sectors are quite striking and feature a strong factor price effect. Given moderately high initial tariff rates, tariff cuts lead to substantial import competition, particularly in the subsistence agriculture sector which features an initial 21.4 percent import penetration rate. At the same time, there are very limited export opportunities for these sectors, as reflected in their low export ratios. As their principal factors of production – rural male and female labor – are little employed in other sectors26, they are essentially “captive” and their wages fall precipitously (Table 4). This translates into strong reductions in output prices yet, with the exception of the livestock sector, little change in output volumes (Table 3).
The service sectors are characterized by zero initial tariff rates, low import competition and limited export opportunities, with the exception of the export-oriented tourism and “other services” sectors. As a result, the main impact of tariff cuts is a reduction in input costs, which translate into small to moderate output expansions and small output price reductions (Table 3). This dichotomy between the evolution of output prices in the services and non-services (primary and industrial) sectors is accentuated when we take account of changes in input costs as reflected in value added prices (Table 3). As all sectors use a mix of inputs coming from various sectors, the variations in sectoral input costs tend to be intermediary relative to the sectoral output prices. In the industrial and agricultural sectors where output prices fall most, input prices fall less than proportionately, such that the burden of adjustment falls on factor prices as revealed by the larger reductions in value added prices. This is particularly dramatic for a large number of industrial sectors, where the drop in value added prices is often more than twice the drop in output prices even if, on average, the gap is larger in the primary sector. The converse is true for the mainly service sectors for which output prices fall little and input costs fall proportionately more. For these sectors value added prices tend to fall less than output prices.
25
Note that the average increase in the volume of output is not equal to the average increase in the volume of value added due to due to the fact that in averaging we are using different sub sectoral weight for output and value added.
26
In conclusion, as would be expected, trade liberalization leads to a reallocation of resources in favor of the export-oriented sectors (meat products, chemical, rubber and leather products, etc.) and to the detriment of their import-competing counterparts (transport material, machinery, paper product, textiles etc.). As there is a similar mix of these two types of sectors in both the primary and industrial sectors, there is no major difference in their aggregate results. The primary and services sector expand slightly more than the industrial sector. However, value added prices in the agricultural sector fall 25 percent more than in the industrial sector and three times more than in the services sector. It is this divergence in the behavior of value added prices that drives the impacts on factor prices, as we will now explore.
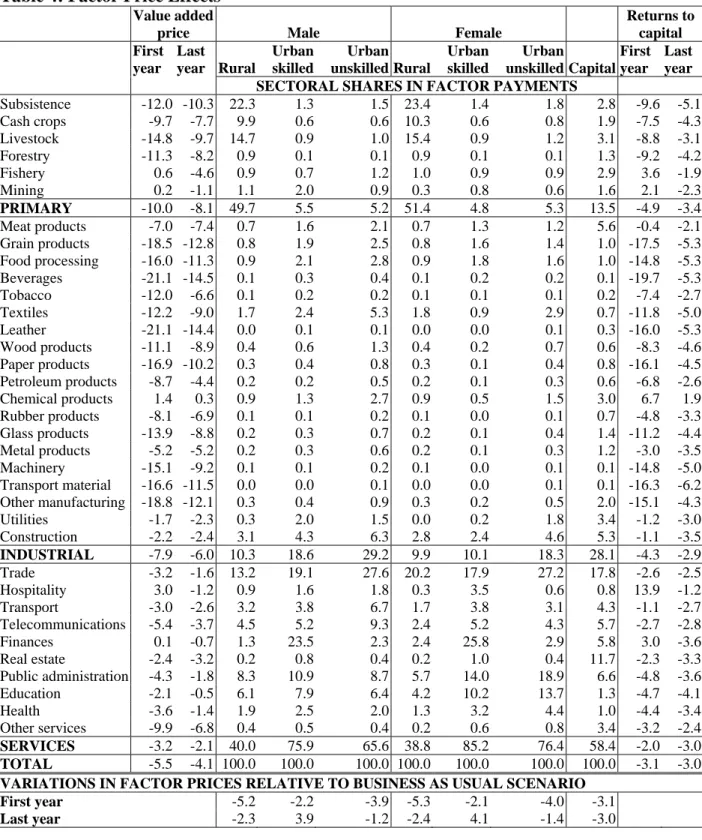
Let us now look more generally at how the sectoral output effects of trade liberalization map into the evolution of factor prices in the first year. It is important to first note that the overall consumer price index falls by 7.5 percent and thus, although, factor returns fall, they almost all increase in terms of purchasing power.
As we indicated above, rural labor is only used to a very limited extent outside the three main agricultural sectors (subsistence agriculture, cash crop, livestock). Thus, the considerable reduction in agricultural value added prices discussed above translates into a substantial reduction in the wages of rural workers (second-last line of Table 3). In contrast, urban workers have more scope to migrate from the contracting import-competing sectors to the expanding export-oriented and service sectors, such that their wage rates fall much less. Among urban workers, skilled wages fall less than unskilled wages, as skilled workers are employed proportionately more in the (expanding) service sectors.
If we now turn our attention to the gender impacts, we first note that the increase in the skill gap is more pronounced among urban female workers, as unskilled wages fall more and skilled wages fall less relative to their male counterparts (Table 4). As a result, the gender gap increases among unskilled workers, whereas it diminishes among skilled workers. In rural areas, the gender gap also widens slightly as female workers, who derive 51 percent of their income from the agricultural sectors, have a short-term wage drop of 5.3 percent, as compared to 5.2 percent for their male counterparts (Table 4; second-last row). Thus the gender wage gap increases marginally among the poorest population groups – rural workers and urban unskilled workers – and declines among the less-poor urban skilled workers. Overall, the gender wage gap increases, albeit marginally, as average wages for female workers (urban and rural together) fall by 4.1 percent, as compared to 4 percent for male workers (Table 4). Thus trade liberalization is shown to slightly accentuate both existing gender and skill wage gaps in Senegal by favoring sectors that are relatively more intensive in male labor.
Sectoral returns to capital generally reflect changes in sectoral value added prices and thus fall the most in the import-competing sectors (beverages, grain products, transport material, paper products, leather, other manufacturing, machinery, food processing, etc.), where capital intensity is greatest (Table 3). Relative to the consumer price index, rates of returns to capital increase for many, primarily export-oriented and service, sectors.
Table 3: Sectoral responses
PRICES VOLUMES First year Last year First year Last year
Imports Dom. sales Output Value added Imports Dom. sales Output Value added Imports Dom.
sales Exports Output
Value
added Imports
Dom.
sales Exports Output
Value added Subsistence -13.7 -8.1 -10.4 -12.0 -13.7 -6.5 -8.9 -10.3 12.9 -0.3 24.8 0.1 0.1 16.6 -0.5 20.2 -0.1 -0.1 Cash crops -10.1 -7.7 -8.6 -9.7 -10.1 -6.0 -6.9 -7.7 5.9 0.6 21.2 1.2 1.2 9.5 0.2 16.2 0.7 0.7 Livestock -10.2 -11.2 -12.9 -14.8 -10.2 -7.0 -8.8 -9.7 2.4 4.7 38.3 5.0 5.0 13.3 5.5 27.0 5.7 5.7 Forestry -8.9 -6.9 -8.2 -11.3 -8.9 -4.7 -6.1 -8.2 5.6 1.2 20.7 1.6 1.6 10.2 0.8 14.7 1.1 1.1 Fishery 0.7 -0.4 -1.7 0.6 0.7 -4.1 -3.8 -4.6 0.4 2.6 7.9 4.3 4.3 -3.1 6.9 21.2 12.1 12.1 Mining -0.3 -0.1 -1.5 0.2 -0.3 -0.5 -1.8 -1.1 2.3 1.8 6.0 2.8 2.8 5.4 5.8 11.0 7.1 7.1 PRIMARY -4.8 -7.1 -8.3 -10.0 -4.4 -5.5 -6.7 -8.1 5.4 1.8 9.6 2.5 2.3 8.4 2.6 18.1 4.3 3.6 Meat products -15.4 -6.6 -6.0 -7.0 -15.4 -6.9 -5.7 -7.4 24.4 2.0 21.8 7.6 7.6 26.9 4.8 26.0 12.2 12.2 Grain products -17.0 -8.9 -10.7 -18.5 -17.0 -7.2 -9.0 -12.8 19.8 -0.6 25.0 -0.3 -0.3 24.0 -0.9 19.9 -0.7 -0.7 Food processing -17.5 -9.0 -9.2 -16.0 -17.5 -7.2 -7.6 -11.3 17.5 -3.5 21.6 0.2 0.2 21.0 -4.4 15.7 -1.2 -1.2 Beverages -17.7 -7.5 -9.2 -21.1 -17.7 -5.6 -7.4 -14.5 25.6 -0.6 21.2 -0.2 -0.2 30.9 -0.5 16.5 -0.2 -0.2 Tobacco -16.0 -5.5 -6.2 -12.0 -16.0 -4.0 -4.8 -6.6 29.3 2.2 19.4 5.0 5.0 34.9 3.2 16.7 5.8 5.8 Textiles -12.6 -5.3 -6.4 -12.2 -12.6 -3.7 -5.0 -9.0 15.4 -1.8 14.2 0.0 0.0 19.9 -1.3 10.9 0.2 0.2 Leather -18.6 -11.4 -11.6 -21.1 -18.6 -7.7 -8.4 -14.4 20.4 1.6 34.9 5.4 5.4 26.4 -1.8 20.3 1.0 1.0 Wood products -11.2 -7.0 -8.5 -11.1 -11.2 -5.1 -6.8 -8.9 11.3 1.5 22.4 2.4 2.4 14.8 0.7 16.8 1.4 1.4 Paper products -11.0 -6.8 -8.7 -16.9 -11.0 -4.3 -6.2 -10.2 8.3 -1.2 0.0 -1.2 -1.2 13.7 -1.7 0.0 -1.7 -1.7 Petroleum products -21.3 -1.8 -2.0 -8.7 -21.3 -1.3 -1.7 -4.4 53.1 -1.5 6.0 1.7 1.7 58.8 1.1 7.6 4.0 4.0 Chemical products -8.9 -2.0 -2.4 1.4 -8.9 -3.5 -2.6 0.3 11.4 -3.8 12.8 7.5 7.5 19.9 6.7 29.1 22.6 22.6 Rubber products -11.5 -7.5 -7.3 -8.1 -11.5 -6.8 -6.6 -6.9 8.0 -1.1 20.5 3.6 3.6 10.9 0.1 20.2 4.9 4.9 Glass products -11.0 -7.3 -7.4 -13.9 -11.1 -5.2 -5.6 -8.8 7.6 -0.9 19.4 2.3 2.3 11.2 -2.1 12.6 0.3 0.3 Metal products -8.9 -5.3 -5.5 -5.2 -8.9 -5.1 -5.4 -5.2 5.3 -2.6 14.9 2.6 2.6 7.3 -1.1 16.2 4.1 4.1 Machinery -10.2 -6.1 -8.1 -15.1 -10.2 -4.5 -6.6 -9.2 7.3 -1.8 0.0 -1.8 -1.8 8.9 -3.6 0.0 -3.6 -3.6 Transport material -12.2 -6.4 -8.4 -16.6 -12.2 -4.5 -6.5 -11.5 10.8 -2.5 0.0 -2.5 -2.5 12.3 -5.1 0.0 -5.1 -5.1 Other manufacturing -15.3 -10.6 -11.7 -18.8 -15.3 -6.5 -7.9 -12.1 13.3 1.7 32.6 3.3 3.3 22.5 0.6 19.9 1.6 1.6 Utilities 0.0 -1.1 -3.2 -1.7 0.0 -0.9 -2.9 -2.3 0.0 0.8 0.0 0.8 0.8 0.0 2.9 0.0 2.9 2.9 Construction 0.0 -2.0 -4.2 -2.2 0.0 -1.7 -3.9 -2.4 0.0 1.9 0.0 1.9 1.9 0.0 2.2 0.0 2.2 2.2 INDUSTRIAL -13.2 -5.3 -6.1 -7.9 -13.0 -4.1 -5.1 -6.0 13.2 0.0 13.8 2.3 3.0 16.3 0.5 19.8 4.2 5.5 Trade 0.0 -2.6 -4.6 -3.2 0.0 -1.4 -3.5 -1.6 0.0 1.5 0.0 1.5 1.5 0.0 3.6 0.0 3.6 3.6 Hospitality 0.0 -16.0 -5.2 3.0 0.0 -20.3 -5.5 -1.2 0.0 8.2 14.7 12.8 12.8 0.0 13.4 22.2 20.1 20.1 Transport 1.7 -1.6 -3.1 -3.0 1.7 -1.1 -2.6 -2.6 -4.6 1.8 9.5 2.9 2.9 -1.9 3.8 10.6 4.9 4.9 Telecommunications 2.0 -3.3 -4.5 -5.4 2.0 -1.8 -3.1 -3.7 -8.3 1.9 13.5 3.6 3.6 -4.3 3.2 11.6 4.7 4.7 Finances 1.8 1.4 -0.6 0.1 1.8 1.0 -0.9 -0.7 1.0 1.9 3.3 2.1 2.1 2.1 3.7 5.9 4.0 4.0 Real estate 0.0 -0.4 -2.4 -2.4 0.0 -0.9 -2.9 -3.2 0.0 0.1 0.0 0.1 0.1 0.0 2.2 0.0 2.2 2.2 Public administration 0.0 -2.1 -4.3 -4.3 0.0 -0.1 -2.3 -1.8 0.0 0.0 0.0 0.0 0.0 0.0 0.0 0.0 0.0 0.0 Education 1.5 -0.6 -2.7 -2.1 1.5 0.9 -1.2 -0.5 -5.2 -1.1 4.5 -1.1 -1.1 -1.2 0.0 2.4 0.0 0.0 Health 1.5 -2.3 -4.3 -3.6 1.5 -0.6 -2.6 -1.4 -7.4 0.0 9.2 0.0 0.0 -3.2 0.9 6.4 0.9 0.9 Other services 1.5 -6.8 -6.8 -9.9 1.5 -4.9 -4.7 -6.8 -13.1 3.1 23.8 7.5 7.5 -8.8 3.9 19.7 8.8 8.8 SERVICES 1.8 -1.9 -3.5 -3.2 1.8 -1.1 -2.7 -2.1 -1.8 1.2 12.3 2.5 1.7 0.3 2.8 15.4 4.4 3.4 TOTAL -10.5 -4.1 -5.3 -5.5 -10.3 -3.1 -4.3 -4.1 10.7 0.8 13.2 2.4 2.1 13.7 1.8 18.2 4.3 3.9
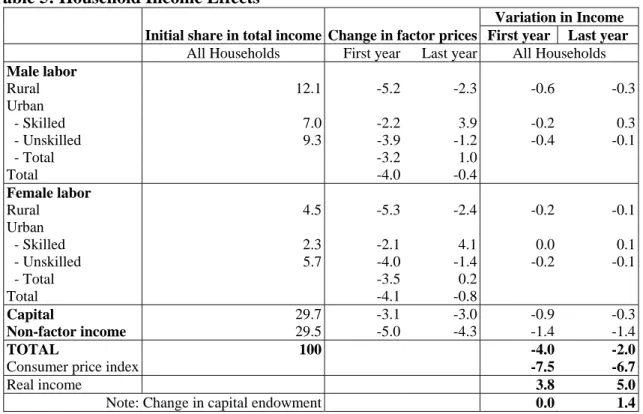
Households face a 4 percent first-year reduction in (nominal) income, but experience a smaller 2 percent income fall by the final year (Table 5). This result can be understood by examining the second last column of Table 5, which decomposes the total first-year variation in household income by source. The reduction in income is primarily attributable to the fall in non-factor income, which consists of transfers received from other households (e.g. domestic remittances) and from government (e.g. public assistance). Indeed, these transfers are indexed to the consumer price index, which falls by 7.5 percent in the short term27. Capital income represents a similarly large share of total income, although its impact on total income is smaller as its rate of return falls less. Senegalese households also rely more on urban wages than rural wages, which fall more. The contribution of male wage is more than double that of female wage income (28.4 vs. 12.5)28.
The principal direct benefit of trade liberalization for households is the reduction in consumer prices by 7.5 percent. In this case, consumer prices fall much more than nominal incomes of households, engendering a considerable rise in purchasing power or real income. Thus, households gain through a combination of moderate nominal income losses and strong consumer price savings, which translates into higher real income of 3.8 and 5 percent in the 1st and 15th year respectively.
b. Long-run effects
The study integrates the growth processes set in motion by trade liberalization. We noted above that trade liberalization increases the real rate of return to capital which, in our model, stimulates household and foreign savings. In addition, increased openness generates sector-specific productivity and efficiency gains, which further encourages domestic investment and growth. Finally, trade liberalization reduces the prices of capital goods, thus increasing the real investments attainable for a given level of savings.
In the absence of trade liberalization, our model is in a steady state, defined as a state where all volumes and values increases at the same rate – equal to the population growth rate – and relative prices remain constant. This rate is given by the rate of increase in the population, which we set equal to four percent per year and apply to all labor categories. All results are expressed as a variation with respect to the values observed in the “business-as-usual” scenario with no trade liberalization.
27
Other non-factor incomes include transfers from abroad (e.g. remittances) and dividends. Transfers from abroad are constant, as they are indexed to the exchange rate, which is the model numeraire. Dividends are a fixed share of firm income, which essentially follows the variation in the average returns to capital.
28
Table 4: Factor Price Effects Value added
price Male Female
Returns to capital First year Last year Rural Urban skilled Urban unskilled Rural Urban skilled Urban unskilled Capital First year Last year SECTORAL SHARES IN FACTOR PAYMENTS
Subsistence -12.0 -10.3 22.3 1.3 1.5 23.4 1.4 1.8 2.8 -9.6 -5.1 Cash crops -9.7 -7.7 9.9 0.6 0.6 10.3 0.6 0.8 1.9 -7.5 -4.3 Livestock -14.8 -9.7 14.7 0.9 1.0 15.4 0.9 1.2 3.1 -8.8 -3.1 Forestry -11.3 -8.2 0.9 0.1 0.1 0.9 0.1 0.1 1.3 -9.2 -4.2 Fishery 0.6 -4.6 0.9 0.7 1.2 1.0 0.9 0.9 2.9 3.6 -1.9 Mining 0.2 -1.1 1.1 2.0 0.9 0.3 0.8 0.6 1.6 2.1 -2.3 PRIMARY -10.0 -8.1 49.7 5.5 5.2 51.4 4.8 5.3 13.5 -4.9 -3.4 Meat products -7.0 -7.4 0.7 1.6 2.1 0.7 1.3 1.2 5.6 -0.4 -2.1 Grain products -18.5 -12.8 0.8 1.9 2.5 0.8 1.6 1.4 1.0 -17.5 -5.3 Food processing -16.0 -11.3 0.9 2.1 2.8 0.9 1.8 1.6 1.0 -14.8 -5.3 Beverages -21.1 -14.5 0.1 0.3 0.4 0.1 0.2 0.2 0.1 -19.7 -5.3 Tobacco -12.0 -6.6 0.1 0.2 0.2 0.1 0.1 0.1 0.2 -7.4 -2.7 Textiles -12.2 -9.0 1.7 2.4 5.3 1.8 0.9 2.9 0.7 -11.8 -5.0 Leather -21.1 -14.4 0.0 0.1 0.1 0.0 0.0 0.1 0.3 -16.0 -5.3 Wood products -11.1 -8.9 0.4 0.6 1.3 0.4 0.2 0.7 0.6 -8.3 -4.6 Paper products -16.9 -10.2 0.3 0.4 0.8 0.3 0.1 0.4 0.8 -16.1 -4.5 Petroleum products -8.7 -4.4 0.2 0.2 0.5 0.2 0.1 0.3 0.6 -6.8 -2.6 Chemical products 1.4 0.3 0.9 1.3 2.7 0.9 0.5 1.5 3.0 6.7 1.9 Rubber products -8.1 -6.9 0.1 0.1 0.2 0.1 0.0 0.1 0.7 -4.8 -3.3 Glass products -13.9 -8.8 0.2 0.3 0.7 0.2 0.1 0.4 1.4 -11.2 -4.4 Metal products -5.2 -5.2 0.2 0.3 0.6 0.2 0.1 0.3 1.2 -3.0 -3.5 Machinery -15.1 -9.2 0.1 0.1 0.2 0.1 0.0 0.1 0.1 -14.8 -5.0 Transport material -16.6 -11.5 0.0 0.0 0.1 0.0 0.0 0.1 0.1 -16.3 -6.2 Other manufacturing -18.8 -12.1 0.3 0.4 0.9 0.3 0.2 0.5 2.0 -15.1 -4.3 Utilities -1.7 -2.3 0.3 2.0 1.5 0.0 0.2 1.8 3.4 -1.2 -3.0 Construction -2.2 -2.4 3.1 4.3 6.3 2.8 2.4 4.6 5.3 -1.1 -3.5 INDUSTRIAL -7.9 -6.0 10.3 18.6 29.2 9.9 10.1 18.3 28.1 -4.3 -2.9 Trade -3.2 -1.6 13.2 19.1 27.6 20.2 17.9 27.2 17.8 -2.6 -2.5 Hospitality 3.0 -1.2 0.9 1.6 1.8 0.3 3.5 0.6 0.8 13.9 -1.2 Transport -3.0 -2.6 3.2 3.8 6.7 1.7 3.8 3.1 4.3 -1.1 -2.7 Telecommunications -5.4 -3.7 4.5 5.2 9.3 2.4 5.2 4.3 5.7 -2.7 -2.8 Finances 0.1 -0.7 1.3 23.5 2.3 2.4 25.8 2.9 5.8 3.0 -3.6 Real estate -2.4 -3.2 0.2 0.8 0.4 0.2 1.0 0.4 11.7 -2.3 -3.3 Public administration -4.3 -1.8 8.3 10.9 8.7 5.7 14.0 18.9 6.6 -4.8 -3.6 Education -2.1 -0.5 6.1 7.9 6.4 4.2 10.2 13.7 1.3 -4.7 -4.1 Health -3.6 -1.4 1.9 2.5 2.0 1.3 3.2 4.4 1.0 -4.4 -3.4 Other services -9.9 -6.8 0.4 0.5 0.4 0.2 0.6 0.8 3.4 -3.2 -2.4 SERVICES -3.2 -2.1 40.0 75.9 65.6 38.8 85.2 76.4 58.4 -2.0 -3.0 TOTAL -5.5 -4.1 100.0 100.0 100.0 100.0 100.0 100.0 100.0 -3.1 -3.0 VARIATIONS IN FACTOR PRICES RELATIVE TO BUSINESS AS USUAL SCENARIO
First year -5.2 -2.2 -3.9 -5.3 -2.1 -4.0 -3.1
Table 5: Household Income Effects
Initial share in total income Change in factor prices
Variation in Income First year Last year All Households First year Last year All Households Male labor Rural 12.1 -5.2 -2.3 -0.6 -0.3 Urban - Skilled 7.0 -2.2 3.9 -0.2 0.3 - Unskilled 9.3 -3.9 -1.2 -0.4 -0.1 - Total -3.2 1.0 Total -4.0 -0.4 Female labor Rural 4.5 -5.3 -2.4 -0.2 -0.1 Urban - Skilled 2.3 -2.1 4.1 0.0 0.1 - Unskilled 5.7 -4.0 -1.4 -0.2 -0.1 - Total -3.5 0.2 Total -4.1 -0.8 Capital 29.7 -3.1 -3.0 -0.9 -0.3 Non-factor income 29.5 -5.0 -4.3 -1.4 -1.4 TOTAL 100 -4.0 -2.0
Consumer price index -7.5 -6.7
Real income 3.8 5.0
Note: Change in capital endowment 0.0 1.4
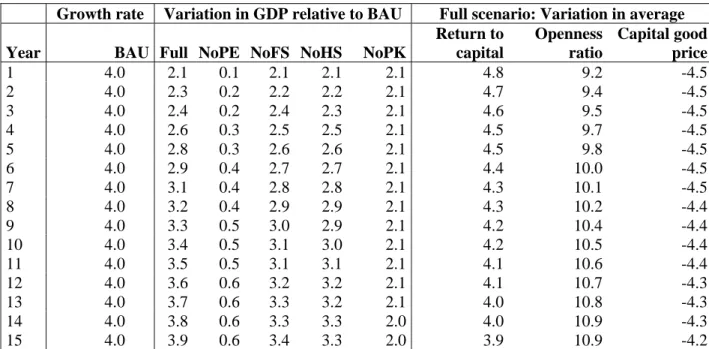
Most of these channels already kick in to a large degree in the first year of the simulations. Indeed, relative to the business-as-usual (BAU) scenario, the real rate of return to capital increases with trade liberalization by 4.8 percent in the first year, whereas at the end of the 15 year simulation, it is only 3.9 percent higher than in the BAU (Table 5). The openness indicator rises by 9.2 percent on average in the first year, but then only climbs a further 1.7 percentage points to attain a 10.9 percent increase relative to BAU after 15 years. Practically all of the reduction in the prices of capital goods also occurs in the first year. As a result, more than half of the increase in GDP relative to the BAU occurs in the first year – 2.1 percent, relative to 3.9 percent after 15 years – the rest of the gains resulting from the cumulative nature of the growth process.
Consequently, the long-term effects are not substantially different from the short-term effects. The essential difference in the long-term effects is the result of three phenomena. First, as we will see in the growth channels analysis below, the productivity/efficient channel is by far the strongest and favors the industrial sector far more than the others. At the same time, the sectoral allocation of investments over time favors the export-oriented sectors where real rates of return to capital shoot up immediately after trade liberalization. This tends to emphasize the sectoral divergence in the output effects, while reducing the divergence in the price effects. While export-oriented sectors are also found in agriculture (fishery and mining), they play a larger role in industry. As a result of these two first phenomena, the long-term increase in value added relative to the BAU is greater for the industrial sector. A third phenomenon is the cumulative growth in the capital stock from the various channels above. Indeed, as we see at the bottom of Table 5, household capital endowments increase relative to BAU.
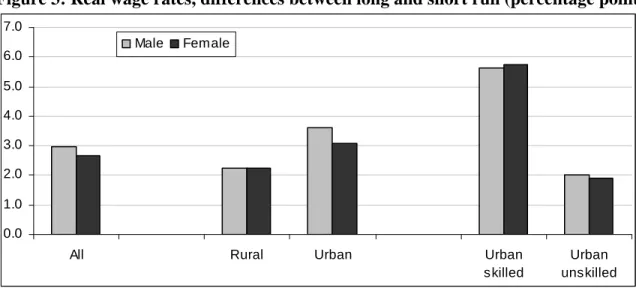
This rise in capital endowments also increases the relative demand for skilled labor (Figure 3), which is complementary to capital in the production process. As a result, skilled wages rise dramatically in the long term. In contrast, rural and unskilled urban real wages increase only moderately. As male workers make up a larger share of skilled workers (notably in agriculture and industry; table 4), the long-term impact is a slight increase in the gender earnings gap.
Figure 3: Real wage rates, differences between long and short run (percentage points)
0.0 1.0 2.0 3.0 4.0 5.0 6.0 7.0
All Rural Urban Urban
skilled
Urban unskilled Male Female
As discussed in the presentation of the model above, we have included a number of motors of growth, which are all intimately linked to trade liberalization. In this section, we separate out their respective impacts on overall growth, the gender wage gap and household incomes. We first note that in our base simulation, in which all motors of growth are included, relative to the BAU trade liberalization increases GDP by a further 2.1 percent in the short run (first year) and by an additional 3.9 percent in the long run (15 years), relative to the simulation without trade liberalization (Table 6). We have already examined the gender-specific labor market effects and the household income effects of the base simulation in the sections above. We now explore each of these channels and their respective impacts on the simulation results. For each simulation we compare the results without one of the growth channels to those obtained in the “Full” scenario, which includes all channels.
• Productivity/efficiency gains
Productivity/efficiency gains (“productivity gains” hereon) emerge as the strongest of our trade-related motors of growth, despite the adoption of a relatively conservative estimate (0.5) of the elasticity of productivity with respect to the variation in sectoral openness ratios. When we remove this channel – i.e. we assume that productivity is not affected by increased openness – practically all the growth effects of trade liberalization disappear. Indeed, we observe a marginal 0.1 percent increase in GDP in the first year followed by a small 0.6 percent increase in GDP by year 15 (Table 6).
When we compare the sectoral results including the productivity gains (“Full”) with those obtained in their absence (“NoPE”), it is obvious that the more open industrial and agricultural
sectors benefit most from these gains (Annex 2). Indeed, in the absence of such gains, trade liberalization leads to a decline in value added (volume) relative to BAU in the agricultural sector in both the short and long terms. Only the limited remaining capital accumulation effects allow the industrial sector to post a moderate 1.9 percent value added gain with respect to BAU in the long run, despite a short-run contraction.
In order to understand the impacts on factor prices, we need to turn our attention to the evolution of value added prices in the presence of productivity gains (“Full”), as presented in Annex 2. We first note that the more open sectors transform these gains into larger price cuts, which is precisely what stimulates their expansion, as compared to the situation where these gains are absent (“NoPE”). At the same time, the productivity gains lead to an increase in incomes, raising demand for all goods. This tempers the reduction in prices in the open sectors and leads to smaller reductions (relative to “NoPE”) in prices in the other, particularly service, sectors. This latter effect is sufficient to ensure that factor prices decline less in the presence of productivity gains (Annex 3). The difference is particularly strong in the case of skilled and urban workers, who are employed intensively in the service sector. Although marginal, the productivity/efficiency gains is found to increase the gender wage gap in the long-run (Annex 3), as male workers represent a larger share of skilled workers.
• Foreign investment
In this simulation, we assume that the current account balance is a fixed share of GDP and reacts neither to the increase the average returns to capital following trade liberalization, nor to the increased level of openness. The results are practically unchanged with respect to the full scenario, which includes these reactions. GDP rises slightly less with respect to BAU in the absence of this channel – 3.4 percent vs. 3.9 percent – by year 15 (Table 6). This is primarily due to a larger long-term increase in industrial output, given that this capital-intensive sector benefits most from the increased foreign investment, on one hand, and the ensuing demand for investment goods, on the other (Annex 2).
Given that male workers are more intensively employed in industrial production, the elimination of the foreign investment growth channel brings their wage rates down more than those of female workers (Annex 3). Thus foreign capital-driven growth shows a clear gender bias in favor of male workers. While these results are not surprising given the estimated elasticities of foreign investment with respect to changes in openness (0.04) and the real returns to capital (0.5), it may be that a more sophisticated modeling of sector-specific foreign investment could have generated stronger results.
• Return-sensitive household savings
The hypothesis that household savings are sensitive to changes in the average returns to capital has only very moderate impacts on our results. When we remove this channel, the total increase in GDP in the final year falls only by 0.6 percentage points relative to the condition where all growth channels (“Full”) are included (Table 6). In terms of output and value added (Annex 2), it is the capital-intensive industrial sector that benefits most from the increased investment and