HAL Id: hal-02293318
https://hal.archives-ouvertes.fr/hal-02293318
Submitted on 20 Sep 2019HAL is a multi-disciplinary open access archive for the deposit and dissemination of sci-entific research documents, whether they are pub-lished or not. The documents may come from teaching and research institutions in France or
L’archive ouverte pluridisciplinaire HAL, est destinée au dépôt et à la diffusion de documents scientifiques de niveau recherche, publiés ou non, émanant des établissements d’enseignement et de recherche français ou étrangers, des laboratoires
Territorial Dissimilarities in Poverty and Exclusion
José Ignacio Vila Vázquez, Petros Petsimeris, Maria Luisa Caputo
To cite this version:
José Ignacio Vila Vázquez, Petros Petsimeris, Maria Luisa Caputo. Territorial Dissimilarities in Poverty and Exclusion. Rubén Lois; Valerià Paül. European Regions in the Strategy to Emerge from the Crisis: the Territorial Dimension of the ‘Europe 2020’, Servizo de Publicacións e de Intercambio Científico da USC, pp.135-149, 2013, 978-84-15876-11-3. �hal-02293318�
HAL Id: hal-02293318
https://hal.archives-ouvertes.fr/hal-02293318
Submitted on 20 Sep 2019HAL is a multi-disciplinary open access archive for the deposit and dissemination of sci-entific research documents, whether they are pub-lished or not. The documents may come from teaching and research institutions in France or abroad, or from public or private research centers.
L’archive ouverte pluridisciplinaire HAL, est destinée au dépôt et à la diffusion de documents scientifiques de niveau recherche, publiés ou non, émanant des établissements d’enseignement et de recherche français ou étrangers, des laboratoires publics ou privés.
Territorial Dissimilarities in Poverty and Exclusion
José Ignacio Vila Vázquez, Petsimeris Petros, Maria Luisa Caputo
To cite this version:
José Ignacio Vila Vázquez, Petsimeris Petros, Maria Luisa Caputo. Territorial Dissimilarities in Poverty and Exclusion. Rubén Lois; Valerià Paül. European Regions in the Strategy to Emerge from the Crisis: the Territorial Dimension of the ‘Europe 2020’, Servizo de Publicacións e de Intercambio Científico da USC, pp.135-149, 2013, 978-84-15876-11-3. �hal-02293318�
The ‘Europe 2020 Strategy’ was issued in 2010 by the European Commission. This document constitutes a growth scheme for the decade 2010-2020 that aims to help the European Union to emerge from the current crisis through the so-called smart, sustainable and inclusive dimensions of growth.
In this context, the basic aim of the SIESTA (“Spatial Indicators for a ‘Europe 2020 Strategy’ Territorial Analysis”) Project has been to illustrate the territorial dimension of the ‘Europe 2020 Strategy’. In other words, to show how this document acts territorially, particularly at the regional scale, but, when possible, also at the urban level. The SIESTA Project has been funded by ESPON (“European Observation Network for Territorial Development and Cohesion”), a European Commission Programme whose mission is to support policy development in relation to the aim of territorial cohesion and a harmonious development of the European territory.
This book includes most of the main findings and conclusions obtained through research of the SIESTA Project. The contents were presented and discussed as keynote addresses or communications at the SIESTA Final Conference held in Santiago de Compostela, Galicia, on 4-5 April 2013.
Eur
opean Regions in the Strategy to Emer
ge fr
om the Crisis: the T
erritorial Dimension of the ‘Eur
ope 2020’
Outros títulos editados Entre el agua y el cielo. El patrimonio monástico de la Ribeira Sacra. Opus Monasticorum V
Edición a cargo de Juan Manuel Monterroso Montero, Enrique Fernández Castiñeiras Santiago de Compostela no século xVi.
Libro de Ordenanzas de la Ciudad (1546-1583)
Antonio Cepeda Fandiño
La iglesia de Santiago y el pontificado en la Edad Media (1140-1417)
Xosé M. Sánchez Sánchez
Historia(s), imagen(es) y lenguaje(s) en América Latina y Europa
Edición a cargo de Israel Sanmartín Barros, Patricia Calvo González, Eduardo Rey Tristán Processes of Heritage Making in
Geographical Space
Edition by Belén M.ª Castro Fernández, Lucrezia Lopez, María José Piñeira Mantiñán Touristic Management of World Heritage Monuments and Cities
Edition by Miguel Pazos Otón, María José Piñeira Mantiñán, Valerià Paül Carril
611 3 76 -1 1-3
C U R S O S E C O N G R E S O S
C U R S O S E C O N G R E S O S
Nº 2 2 2
European Regions
in the Strategy to
Emerge from the
Crisis: the Territorial
Dimension of the
‘Europe 2020’
CURSOS E CONGRESOS
E
ditionbyRubén Camilo Lois González Valerià Paül Carril
EUROPEAN UNION
Part-financed by the European Regional Development Fund INVESTING IN YOUR FUTURE
E S P N
ANTE
Análise Territorial GI - 1871
10. TeRRiToRial DissimilaRiTies in PoVeRTy
anD eXClusion
Petros Petsimeris <[email protected]> José Ignacio Vila Vázquez <[email protected]> Maria Luisa Caputo <[email protected]> CNRS — UMR 8504 Géographie-Cités — Paris (France)
10.1. Introduction
Governments throughout the world have as a policy objective decreasing poverty. The European Union is no exception, and has adopted the EU2020S aimed at reducing the number of people at risk of poverty or social exclusion. With a target of reducing by 20 million the number of people living below the poverty threshold, the EU aims “in the direction of inclusive growth, which basically means that growth has to spread to all society and that excluding people in this process is not acceptable” (European Commission, 2010: 22-23). This is equivalent to reducing by 19.5% the share of people at risk of pov-erty in the EU by 2020. The European Council in 1975 formulated a definition of absolute poverty that is still current and has been adopted by the EU2020S: “People are said to be living in poverty if their income and resources are so inadequate as to preclude them from having a standard of living considered acceptable in the society in which they live” (European Commission and Eu-rostat, 2010: 6).
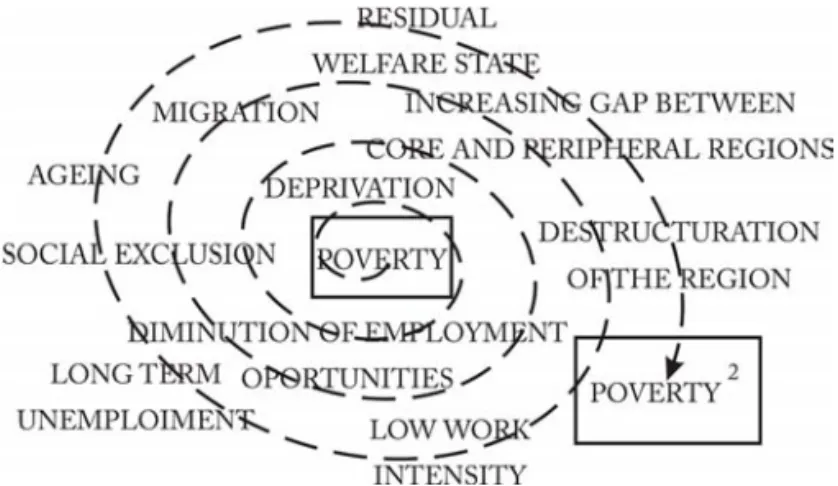
Poverty is widely studied and the factors of poverty are multiple and in-terconnected (Alcock, 1997; Philo, 1995; Spicker, 1993; Townsend, 1993), see Graphic 10.1.
European Regions in the Strategy to Emerge from the Crisis: the Territorial Dimension of the ‘Europe 2020’ Rubén Camilo Lois González & Valerià Paül (editors)
The aim of this chapter is to present a short synthesis of the spatiality of indicators that are closely associated with poverty. Even if models concerning the cycle of poverty have been heavily criticised or designated as determin-istic, in a context of crisis — as is currently the case in Europe’s Southern macro-region, and the marginal and peripheral Eastern regions — it is clear that poverty persists. Space matters at every scale and in different spatial con-texts (urban and rural concon-texts, and developed regions versus stagnating and/ or declining regions). At the national and macro-regional scales a cycle of weak work experience is associated with deprivation, lack of basic necessities and services. The importance of space can also be seen in the context of the crisis of welfare states (at various degrees of ‘maturity’), demographic change and renovation of the workforce. Each of these factors is key to economic development. These phenomena occur, not only in the less developed regions and countries in the EU, but also in the most fragile areas of the large metrop-olis, where the processes of social and spatial polarisation have more recently gained strength (Hamnett, 2001; Petsimeris, 1998).
The maps presented in this section provide a representation of the spatial-ity of a number of indices, including: unemployment, low work intensspatial-ity, dep-rivation and ageing. In order to see the spatiality of poverty and depdep-rivation it is, however, necessary to associate cartography at the metropolitan level with that at the municipal and intra-municipal levels. This is because representa-tions at regional scale do not give ― and can even disguise ― the acuteness of certain of these variables as they occur within municipalities at the intra-urban scale. Furthermore, the collection of statistics according to administrative di-vides may act to dilute a spatial concentration of poverty when it occurs across the border of two administrative areas.
10.2. Poverty and Social Exclusion in the European Union
The fight against poverty is one of the main targets of the EU2020S and, specifically, the European Platform against Poverty and Social Exclusion in order to achieve inclusive growth, which basically means that growth has to spread to all society and that excluding people in this process is not acceptable (European Commission, 2010a, 2010b). Poverty, however, is both a sensitive issue and difficult to define due to its complex nature. Conventionally, the EU has adopted a statistical definition of poverty which has been based only on the relative income poverty measures of the Laeken set (nolan and Whelan, 2011: 11). Meeting one of the following three criteria allows us to classify in-dividuals as people at risk of poverty and social exclusion. These criteria are:
European Regions in the Strategy to Emerge from the Crisis: the Territorial Dimension of the ‘Europe 2020’ Rubén Camilo Lois González & Valerià Paül (editors)
- At-risk-of-poverty: having an income below the 60% threshold of the national median equivalised disposable income after social transfers. - Severe material deprivation: experiencing at least 4 out of 9 of the
following deprivations items: cannot afford i) to pay rent or utility bills, ii) keep home adequately warm, iii) face unexpected expenses, iv) eat meat, fish or a protein equivalent every second day, v) a week’s holiday away from home, vi) a car, vii) a washing machine, viii) a colour TV, or ix) a telephone.
- People living in households with very low working intensity: people aged 0-59 living in households where adults have worked for less than 20% of their total work potential during the past year.
Our analysis is mainly based on data for these three indicators at regional and national scale. Disposable income per capita indicates the different gra-dients of centrality in Europe. The global cities and the main metropolitan areas in the European core record the highest values while the Eastern Euro-pean regions score the lowest disposable incomes with exceptions for some capital regions. In relation to this measure, an indicator of relative poverty in monetary terms is elaborated. It is focused on the lack of financial resources available to individuals for covering their needs and not on the concrete sat-isfaction of these needs. This indicator constitutes, therefore, an indirect ap-proach to poverty and social exclusion. Two analyses have been used: a static one, focused on the spatial pattern in 2010, and a dynamic analysis based on the recent evolution from before the economic crisis (period 2005 to 2010).
This indicator of “people at-risk-of-poverty” refers to individuals living in households with an equivalised disposable income (after social transfer). Average incomes vary substantially from one state to another. This fact means that the ‘at-risk-of-poverty’ measure is a state-based indicator showing social inequalities between regions in relation to a national income trend.
In 2010, in the Southern and Eastern peripheries of the EU more than a quarter of the local population was at risk of poverty, especially in Southern Spain and Italy, Turkey, and the peripheral regions of Bulgaria, Romania and Poland. The risk of poverty after social transfers was generally low in Western and northern Europe, around one tenth of the population, but specific regional patterns do occur.
The rate of population below the threshold of monetary poverty in 2010 was very low (less than 8% of the population) in the Central and Eastern re-gions mostly associated with capital cities ― Prague and the rere-gions (Central
Rubén Camilo Lois González & Valerià Paül (editors)
Bohemia, the South West and the north East) in Czech Republic, Bratislava, Bucharest and Budapest ― and in several autonomous regions like the Fin-land region of the ÅFin-land IsFin-lands, the Alpine Italian provinces of Trento and Bolzano, and the Pyrenean region of navarre in Spain (Map 10.1).
Concerning the Eastern countries of the EU, it is especially important to indicate that the capital regions concentrate the main economic activities and employment, and represent islands of wealth within a strongly marginalized hinterland that sometimes contains the rest of the country. Long-term histor-ical centralist policies could have contributed to maintaining this disparity between the capital city and the rest of the country. Capital cities concentrate investment and employment opportunities which tend to increase the gap be-tween the capital regions and the rest of the country.
A different pattern exists in the main urban regions of the Western coun-tries, such as Inner and Outer London, Brussels, Berlin and Wien. These re-gions present great dynamism in terms of economic growth, and high levels of social inequalities and polarization. This situation is explained by the analysis of the social dynamics at Large Urban Zone (LUZ) level in the previous ES-POn-FOCI project (Lennert et al., 2010: 68-100). A symptomatic situation appears in Inner London, which has a medium-high GDP per capita, and a high level of disposable incomes, but intermediate rates of unemployment. This contrast indicates a duality in the area’s economic development: a so-cial polarisation due to increasing inequalities between rich and poor people. This pattern exemplifies the social polarisation that numerous scholars have demonstrated in different urban contexts (Hamnett, 2001; Sassen, 2001; Mar-cuse and Kempen, 2000; Preteceille, 1995; Mollenkopf and Castells, 1991; Marcuse, 1989). These cities concentrate both people who work in the ad-vanced tertiary sector and very low skilled workers.
In summary, the lowest rates of monetary poverty mainly occur in regions in Western and northern Europe, while Eastern and Southern Europe show high levels of risk of poverty after social transfers. At the urban-rural scale of analysis, lower rates appear in the capital cities in Eastern Europe in relation to their surrounding areas, while some metropolis in Western Europe and large urban areas show high rates of poverty. This pattern reflects the emergence of a trend of social polarisation from the metropolitan level to the analysed regional scale.
Rubén Camilo Lois González & Valerià Paül (editors)
Map 10.1. Regional people at-risk-of-poverty after social transfers, 2010.
The evolution in the at-risk-of-poverty rate from 2005 to 2010 shows a highly contrasted spatial pattern across Europe, with high differences be-tween and within countries (Map 10.2). Peripheral countries scored the larg-est changes in this period. In general, regions in Eastern Europe experienced a reduction of people classified within the at-risk-of-poverty group, e.g. the Baltic regions of Poland and some Romanian regions. The highest reductions
Rubén Camilo Lois González & Valerià Paül (editors)
were recorded in Border, Midland and Western Ireland (-13.4%). A significant reduction in the share of population at risk of poverty also occurred in certain regions in the Southern periphery of Europe, mainly in the insular Greece and the South of Italy. In contrast, most of the Western and northern regions witnessed increasing rates of at-risk-at-poverty, although the values obtained are not among the highest. For instance, the capital regions of Wien and Co-penhagen recorded two of the major relative augmentations (5.4% and 4.6%, respectively) although they remain outside of the top regions in terms of high rate of monetary poverty.
The disparities in terms of changes in the indicator of poverty at regional level are especially visible in Romania and Spain. A reduction in the rate in most of the Romanian regions contrasts with increasing values scored by the regions of Transylvania and Banat. In Spain, increase occurred in regions of the South, which scored high rates of poverty, and some of the most developed regions such as: Basque Country, Catalonia and Madrid. Some other regions of the north of Spain improved their situation.
Changes in poverty take place quickly and have to be assessed at regional and local levels whenever possible. For some of the indicators of poverty (no-tably deprivation and low work intensity), data is only available at the national level. The lack of data at a lower level of spatial analysis may mask disparities between intra-country units of analysis, in the same way that national datasets may mask patterns of poverty occurring in cross(national)-border localities.
The ‘at risk of poverty indicator’, based on the 1975 definition of poverty, was the fundamental unit for the enumeration of poverty in Europe until the enlargements of the EU in 2004 and 2007. The need to complement the pover-ty indicators of the EU with other measures of poverpover-ty, such as severe material deprivation, became evident (Guio, 2009). The major goal of the indices of deprivation consists in capturing the forced inability to satisfy basic everyday necessities through the identification of inaccessibility to nine specific materi-al items, as above reported.
In 2010, the pattern of this indicator shows territorial dissimilarities in Europe in terms of the material implications of poverty. The Eastern countries joining the EU after 2004 (especially the Romanian and Bulgarian regions) exhibit both the highest values of severe material deprivation, and record the largest inequalities between core and peripheral regions. The rates exceed 30%, such as in the case of the region of Severen Tsentralen (44.2%). In con-trast, Western Europe, the Czech Republic and Slovakia show very low values. The best performance is scored in the core country of Luxembourg (0.5%).
Rubén Camilo Lois González & Valerià Paül (editors)
Map 10.2. Change in regional people at-risk-of-poverty after social transfers, 2005-2010.
Indices of severe material deprivation have come to complement in-come-based poverty indicators. A major territorial dissimilarity in terms of material deprivation appears between the regions of Eastern Europe and the rest of the EU. This disparity points to the need for policies orientated towards
European Regions in the Strategy to Emerge from the Crisis: the Territorial Dimension of the ‘Europe 2020’ Rubén Camilo Lois González & Valerià Paül (editors)
reducing these inequalities in order to really accomplish targets of both social inclusion and territorial cohesion.
10.3. Low Work Intensity, Long-Term Unemployment and Poverty
Unemployment, especially long-term unemployment, and low work intensity are some of the main factors involved in the vicious circle of poverty, espe-cially for the working-age population. These conditions of (un)employment are relevant to the identification of spatial patterns in ‘risk of poverty’.
Unemployment, as opposed to under-employment, may result from a number of factors including government policies aimed a getting people into work. In the period of the crisis there has been an increase in the number of households affected by low work intensity and unemployment. This has as an effect an increase in the number of persons at risk of poverty and in conditions of severe material deprivation. This is the case in the Mediterranean macro-re-gions, which have been most affected by the intensity and the duration of the crisis.
“People living in households with very low work intensity” is one of the three components of the indicator of people at risk of poverty and social ex-clusion (see above). The threshold that defines the class of ‘poor work inten-sity’ is less than 2.4 months of work per year in households with one or more member of working age (this is equivalent to 20% of the household’s total work potential). This measure represents only the extreme cases of exclusion through work.
In 2010, regions with high rates of unemployment do not reach very high levels of low work intensity. This pattern appears in the Southern and Eastern Spain, with the exception of the enclave of the Autonomous City of Ceuta (27.4%). At the opposite extreme, regions which do not account for high rates of unemployment reach high rates of people living in households with very low work intensity, for instance in Wallonia (17.8%) and Irish regions (over 22 %). Southern Italian regions and Hungarian regions score high values of people with very low work intensity and intermediate levels of unemploy-ment. At regional level, the lowest values are found in some Eastern capital regions such as Prague (2.3%), Bratislava (2.6%), Bucharest (3%) or Sofia (4.1%). These findings help to corroborate evidence of dissimilarities occur-ring between urban poles and their national settings. These spatial patterns may denote a work situation that reinforces the risk of poverty and social exclusion in regions scoring intermediate levels of unemployment.
European Regions in the Strategy to Emerge from the Crisis: the Territorial Dimension of the ‘Europe 2020’ Rubén Camilo Lois González & Valerià Paül (editors)
In an ideal situation, the solution to low work intensity would be to in-crease work intensity by means of increasing employment. It is, however, very difficult to create employment in an economic downturn, not least for those areas that need it most. In the absence of employment creation, it is important to increase levels of cooperation between regions and to empower popula-tions for local development. Mobility can play an important role in helping to empower a population of low work intensity through work qualifications and work experience that last over time.
In close relation with low work intensity, long-term unemployment is an-other situation which generates poverty and social exclusion conditions, and represents a loss of human capital. The long-term unemployment indicator aims to describe exclusion and poverty through the persistence of worklessness.
In 2010, across the EU27, there were 9.3 million long-term unemployed persons. Long-term unemployment increases the probability of experiencing material deprivation and increases the risk of poverty. In a context of crisis, decreases in employment lead on to lower levels of consumption, which in turn in turn have a feedback effect on employment. Additionally, long-term unemployment may also impact negatively on social cohesion and has the potential to act as an obstacle to economic growth.
Three general considerations help in understanding long-term unemploy-ment. Firstly, it is important to consider the role that gender plays, given that there are inequalities between men and women in terms of both employment and under-employment. In Southern Europe — notably Greece, Italy, Portu-gal, Turkey and Spain —, and in Switzerland and Croatia, in 2010 women experienced higher rates of long-term unemployment. By contrast, the per-centage of long-term unemployed males was commonly higher than women in the north and the East of the continent, especially in Ireland and the United Kingdom. The extent to which these differences are accounted for by the rules governing registration and entitlement to benefit by households with more than one person seeking employment versus other factors is worthy of further examination. Secondly, age has an important role in the persistence of unem-ployment. For example, people over 45 years of age have fewer possibilities of improving their qualifications or of retraining as means of obtaining em-ployment; hence they remain in unemployment for longer periods. Thirdly, it is important to consider ‘informal’, ‘undeclared’ and ‘underground’ forms of economic activity. These activities fall outside the control of the state. They are difficult to estimate and remain hidden in the general figures of unemploy-ment, notably in the rates of long-term unemployment.
European Regions in the Strategy to Emerge from the Crisis: the Territorial Dimension of the ‘Europe 2020’
Map 10.3. Regional long-term unemployment as percentage of the unemployed population, 2010.
The long-term unemployment rate refers to the number of people who are out of work and have been actively seeking employment for at least a year (Map 10.3). This indicator gives a measure of the persistence of unemploy-ment and is expressed as a percentage of total unemployunemploy-ment.
European Regions in the Strategy to Emerge from the Crisis: the Territorial Dimension of the ‘Europe 2020’
In 2010 persistent structural unemployment affected the French over-seas regions (DOM-TOM), Slovakia and several regions of Belgium, Greece, Southern Italy, the province of Berlin, and central and northern Portugal. In these regions at least half of unemployed persons have been seeking em-ployment for more than a year. The DOM-TOM record the highest rate of long-term unemployment (up to the 78%), followed by Slovakia and the EU candidate country Macedonia, which have the highest shares of long-term un-employment in continental Europe. A significant difference characterises the regional rates of these countries: in the French DOM-TOM the share of long-term unemployed persons is twice the French average. Similarly, the province of Hainaut and Brussels in Belgium, the Mezzogiorno regions of Campania, Sicily and Basilicata in Italy, and Epirus and Peloponnesus in Greece record around 10 percentage points above their respective national averages. In Cen-tral-northern Europe several areas with above average rates correspond to the old industrial heartlands. The distribution of the regions with the lowest percentages of long-term unemployment is extremely patchy: Bucharest in Romania, the Scandinavian macro-region, Switzerland, the Czech Republic and Turkey. It is hard to find a common pattern: the explanation can be found in local socio-economic policies and their outcomes. This situation points to the importance of policy as research, and research as policy. The European regions intervening between these extremes are characterised by a patchwork of differing rates. The spatiality of long term unemployment is very complex because of important pockets of long term unemployment in both economical-ly developed countries and less developed countries.
A further consideration concerning the relationship between unemploy-ment and ageing serves to illustrate how socio-economic factors affect differ-ent age groups. In 2010, 12.5 percdiffer-ent of the population of Europe aged between 15 and 40 were unemployed. Several countries overtook the EU average rate by a significant degree: the EU candidate country Macedonia (40%), South-ern Europe (notably Spain and Greece), and EastSouth-ern Europe. This situation worsened in 2011. Youth unemployment is largely long-term, as a significant number of unemployed persons are unable to obtain work during the first year of unemployment. The delay in being able to obtain economic self-sufficiency leads to young people postponing parenthood, which — in turn — reduces fertility and the birth rate. There is a strong correlation between number of births and unemployment.
Unemployment, and notably long-term unemployment, contributes to de-clining birth rates and population ageing. To counter the trend towards the shrinkage of the base of the population pyramid it is necessary to act at both
Rubén Camilo Lois González & Valerià Paül (editors)
European and national levels in terms of providing policies for employment and the means of addressing chronic situations of economic and social deprivation.
10.4. ageing
This indicator (Map 10.4) is a quotient of the share of population aged over 65 in the total population of a country or region divided by the share of popu-lation having an age inferior to 15 years in the same area. The value 1 means that the shares of the two groups are equal: i.e. there is a quantitative equilib-rium between the older and younger groups in the age pyramid of the region in question. AI> 1 means an over-representation of the older population while AI<1 shows an over-representation of the younger population.
One can observe areas that have high aging indices at the national level represent also high ageing indices in the majority of the regions. These regions are mainly less developed economically and include also what in Italy are called “internal regions” (area interne), and mountain areas. In France there is a Youth crescent (north East and South) that includes the including the conurbations of Paris and Lyon. In Germany the ageing index grows consider-ably recording the highest value in the Eastern part of the country. In Italy the highest values are in the north West area (between the regions of Piedmont and Lombardy) and in the internal areas and in Spain the phenomenon is most concentrated in Galicia.
The major metropolitan areas in the UK and notably those which were the areas of settlement of immigrants from new Commonwealth in the 1960’s have the lowest indices of ageing. The relatively low index in Aberdeen (Scotland) reflects immigration in the 1980’s consequent to the off-shore oil industry. The Republic of Ireland relative to the rest of Europe, with the exception of Turkey, has low ageing indices in all areas. The lowest levels are found in the Dublin conurbation. Over all the map of the north Western Europe contrast strongly with a map for the same area in the 1980’s, when the old industrial areas (heavy manufacturing industries were in decline and the population had a high age dependency ratio. Thirty years later the same metropolitan areas after processes of industrial restructuring, international and national migration these areas now exhibit relatively low ageing indices. The same pattern is also found in metropolitan areas of the Mediterranean Region that had experienced more recent flows of international migration.
Comparisons at the regional and urban scales show that ageing is less pronounced in urban areas. This is due to domestic and international migra-tion processes: established in the cases of the UK and France, and more recent
Rubén Camilo Lois González & Valerià Paül (editors)
Map 10.4. Regional ageing index (share of people aged more than 65 divided by people aged less than 15), 2010.
in the cases of Spain and Italy. In terms of policy, it is important to make a distinction between urban areas and rural areas. In the former there is a con-centration of the population in which the ageing problem is not as dramatic as in the rural areas.
It is difficult to specify a set of policy guidelines on this topic, because there are not direct policies on ageing. The only policies possible are those to
European Regions in the Strategy to Emerge from the Crisis: the Territorial Dimension of the ‘Europe 2020’ Rubén Camilo Lois González & Valerià Paül (editors)
improve birth rates in order to equilibrate the index (the denominator increas-es faster than the nominator). It should be possible to increase cooperation be-tween regions that have complementary age structures by means of increasing mobility.
10.5. Conclusion
Our research confirms the relationship between poverty, deprivation and the ageing of the population. This is shown to be particularly acute in rural areas and peripheral regions characterised by low work intensity, where population ageing may be anticipated to increase due to out-migration by younger groups.
The cycle of poverty is likely to increase in intensity in the marginal and peripheral regions because in these areas there will be more households with low work experience and low work intensity, and increasing numbers of households relying on state support in the form of pensions and benefits. There will also be situations of young unemployed people whom, having lost employment in the urban areas, may return ‘home’ with the intention (to be later realised or not) of migrating from the region. This is the case in both the Eastern and the Southern European macro-regions. The situation is more problematic where the state has been further weakened by the crisis, and is unable to provide basic services such as schools, health services and employ-ment opportunities (either directly or indirectly by means of training schemes, etc.). In these contexts there are decreasing opportunities for formal work, while poorly and underpaid ‘opportunities’ of informal work may increase in relative importance. There will also be an increased probability of social tensions. Situations like this are conducive to the production of territorial en-claves of populations lacking opportunities for social and spatial mobility.
The series of maps in this collection are a reflection of trends occurring at both European and supra-European scales. They focus on the characteris-tics of the populations living in spatially delineated areas. These populations are subject to the shifts and turns of financial trends occurring at a global scale. European funds can help to alleviate acute situations of poverty, but local economic development and social wellbeing will ultimately depend on the availability of far greater resources across larger geographical scales. It is therefore essential that local, national and European policies connect both internally and in relation to those policies aimed at addressing the global crisis in banking and finance.
European Regions in the Strategy to Emerge from the Crisis: the Territorial Dimension of the ‘Europe 2020’ Rubén Camilo Lois González & Valerià Paül (editors)
References
Alcock, P. (1997). Understanding Poverty. Basingstoke, Palgrave.
Guio, A. C. (2009). What can be learned from deprivation indicators in Europe? Luxembourg, Publications Office of the European Union.
Hamnett, C. (2001). Social segregation and social polarization. In: Handbook of
Urban Studies. London, Sage, pp. 162-176.
Lennert, M., Van Hamme, G. and Patris, C. (Coordinators) (2010). FOCI. Future
Orientations for Cities. Final Scientific Report. Bruxelles, Université Libre
de Bruxelles. <http://www.espon.eu/export/sites/default/Documents/Projects/ AppliedResearch/FOCI/FOCI_FinalReport_ScientificReport-r.pdf> (Accessed 2.4.2013)
Marcuse P. (1989). “Dual City”: A Muddy Metaphor for a Quartered City. International
Journal of Urban and Regional Research 13(4), pp. 697-708.
Marcuse, P. and Kempen, R. van (Editors) (2000). Globalizing cities: a new spatial
order? Malden Mass / Oxford, Blackwell.
Mollenkopf, J. and Castells, M. (Editors) (1991). Dual city : restructuring New York. new York, Russel Sage Foundation.
nolan, B. and Whelan, C.T. (2011). The EU 2020 Poverty Target. GINI Discussion
Paper 19.
Petsimeris, P. (1998). Deurbanization and new social division of space in the core areas of the Italian industrial triangle. Urban Studies 35(3), pp. 449-466. Philo, C. (Editor) (1995). Off the Map: The Social Geography of Poverty in the UK.
London, Child Poverty Action Group.
Preteceille, E. (1995). Division sociale de l’espace et globalisation. Sociétés
Contemporaines 22/23, pp. 33-68.
Sassen, S. (2001). The global city: New York, London, Tokyo. Woodstock, Princeton University Press.
Spicker, P. (1993). Poverty and Social Security. London, Routledge.
Townsend, P. (1993). The International Analysis of Poverty. Hemel Hempstead, Harvester Wheatsheaf.
European Union Official Documents
European Commission (2010a). Europe 2020. A strategy for smart, sustainable and
inclusive growth. Brussels, 3.3.2010. [COM(2010) 2020 final]
European Commission (2010b). The European Platform against Poverty and Social
Exclusion: A European framework for social and territorial cohesion. Brussels,
16.12.2010. [COM(2010) 758 final]
European Commission and Eurostat (2010). Combating poverty and social exclusion :
a statistical portrait of the European Union 2010. Luxembourg, Publications