ECOLE D E TECHNOLOGIE SUPERIEUR E UNIVERSITE DU QUEBE C
THESIS PRESENTED T O
ECOLE D E TECHNOLOGIE SUPERIEUR E
IN PARTIAL FULFILLMEN T O F THE REQUIREMENTS FO R THE DEGREE OF MASTER O F ENGINEERIN G
M.Eng.
BY
NJOYA MOTAPON. Soulema n
A GENERIC FUE L CELL MODEL AND EXPERIMENTAL VALIDATIO N
MONTREAL, SEPTEMBER 1 1 2008
THIS THESIS HAS BEEN EVALUATE D BY THE FOLLOWING BOAR D OF EXAMINER S
M. Louis-A. Dessaint . Thesis Superviso r
Departement d c genie electrique de I'Ecole de technologic superieur e
M. Kamal Al-Haddad, President of the Board of Examiner s
Departement d e genie electrique de LEcole de technologie superieur e
M. Guy Olivier, professeu r
Departement d e genie electrique et de genie informatique d e LEcole Polytechniqu e d e Montreal
THIS THESIS HAS BEEN PRESENTED AN D DEFENDE D BEFORE A BOARD OF EXAMINERS AND PUBLI C
SEPTEMBER 1 0 2008
AT ECOLE DE TECHNOLOGIE SUPERIEUR E
A GENERIC FUE L CELL MODEL AND EXPERIMENTAL VALIDATIO N Njoya Motapo n Soulema n
ABSTRACT
Fuel cell s offe r clean , quie t an d efficien t electrica l energy . Environmenta l issue s regardin g the emissions of green house gases have propelled the use of fuel cell s in applications such as automotive, mobile and power generation systems .
These fue l cell s generat e unregulate d D C voltag e an d ar e usuall y connecte d t o a powe r system throug h DC-D C converters . Th e desig n an d simulatio n o f suc h converter s o r th e whole powe r syste m requir e a n accurate mode l o f fue l cells . Many publication s o n fue l cel l modeling hav e bee n reporte d i n th e previou s years , bu t mos t o f th e propose d fue l cell s models ar e obtaine d empiricall y o r throug h experiment s o n actua l fue l cells . These model s are only valid fo r particular fue l cell s and can not be generalized. Thi s does not facilitate th e simulation and the design of fuel cell s power systems, especially when the user does not have the fuel cell s at hands.
In this project, a new approach of fuel cel l modeling is proposed, an approach wher e the fue l cells mode l i s obtaine d fro m dat a fro m fue l cell s datasheet s whic h ar e provide d b y stac k manufacturers an d publicly available . The model i s a generic model an d able to emulate th e behavior of any fue l cel l types fed wit h hydrogen and air.
The mode l i s validate d throug h compariso n wit h rea l datashee t performanc e an d wit h experimental dat a fro m a n actua l fue l cel l stack . Th e datashee t o f a 6kW-45 V proto n exchange membran e fue l cel l (PEMFC ) fro m NedStac k i s considere d fo r th e stud y an d experimental test s ar e performe d o n a 500W-48 V PEMF C (EPAC-500) . Th e simulation s results obtained ar e close to the expected resuh s with a n error i n the range of ± 1 %, tha t fo r both steady and transient states and at any condition of operation, provided a controlled stac k internal humidity . However , th e mode l give s a n erro r o f 1 % fo r ever y 9 % increas e i n ai r pressure and an error of 3% for a 15 % decrease in temperature du e to the effect o f humidity. This model is integrated in SimPowerSystems (SPS ) and made available to SPS users. A fuel cell vehicl e demonstratio n (FC V demo ) i s presente d t o poin t ou t th e advantage s o f th e proposed mode l i n th e simulatio n o f fue l cel l powe r system s an d t o sho w ho w th e fue l cel l model inter-connect s wit h othe r electrica l systems . Th e vehicl e i s modele d wit h th e sam e characteristics as the Honda FCX-Clarity developed b y Honda. The performances o f the fue l cell mode l an d th e vehicl e ar e clos e t o thei r rea l value s i n term s o f fue l consumption , maximum spee d and acceleration. Thi s confinns th e validity of the FCV demo .
The FCV demo is a typical application of fuel cells and can be used as a perfect startin g point on the design an d simulation of fuel cel l power systems .
MODELE GENERIQU E DUN E PIL E A COMBUSTIBLE E T VALIDATIO N EXPERIMENTALE
Njoya Motapo n Soulema n RESUME
Les piles a combustibles fon t parti e des sources d'energie renouvelable s offran t un e energi e electrique propre , silencicus e e t avc c u n rendemen t eleve . Elle s prennen t e n entre e I'hydrogenc e t fai r e t le s convertissen t e n energi e electriqu e a traver s de s reaction s electrochimiques. Cette conversion ne genere que de I'eau et la chaleur.
Les probleme s environnementau x cree s pa r l a croissanc e e n emission s de s ga z a effe t d e serre on t augment e I'utilisatio n d e ce s pile s dan s le s domaine s tel s que : le s transports , le s portables et la generation de I'energie electrique.
Ces piles produisent un e tension electrique qui varie dc fafon no n lineaire avec l e courant et elles son t l e plu s souven t connectee s ave c d'autre s systeme s electrique s a traver s de s j convertisseurs CC-CC . Dans l a conception e t la simulation de s ces convertisseurs o u meme I de tout l e systeme electrique, un modele preci s de ces piles est necessaire. Plusieur s article s i concernant l a modelisatio n de s pile s a combustible s on t et e public s dan s le s annee s ; anterieures, mai s l a majorit e de s modele s presente s son t obtenu s d e fa9o n empiriqu e o u a j
travers de s experience s su r de s vraie s piles . Ce s modele s son t seulemen t valide s pou r un e , ' pile e n particulie r e t n e peuven t etr e generalises . Cel a ren d difficil e l a conceptio n e t l a
simulation de s systeme s electrique s base s su r le s pile s a combustible , surtou t lorsqu e I'utilisateur ne dispose pas d'une vraie pile.
Dans c e projet , un e nouvell e approch e d e modelisatio n es t proposee , un e approch e o u l e modele d e pil e es t obten u a I'aid e de s donnee s de s fiche s technique s de s manufacturier s e t qui son t disponible s au x usagers . L e mode l es t generiqu e e t capabl e d e represente r i e comportement d e n'importe quel type de pile alimentee par I'hydrogene et fair .
Le modele es t valid e pa r des comparaisons ave c le s donnees de s fiche s technique s e t ave c les resultat s de s test s su r un e vrai e pile . Un e fich e techniqu e d'un e pil e d e 6kW-45 V a membrane echangeus e d e proton s (PEMFC ) d e NedStack es t considere e pou r I'etud e e t le s experiences son t performee s su r un e pil e d e 500W-48 V (EPAC-500) . Le s resultat s d e simulation son t tre s proche s de s resultat s attendu s ave c just e un e erreu r (entr e l a tensio n donnee pa r l e model e e t l a tensio n reelle ) qu i vari e entr e ± 1 % , cec i tan t e n regim e permanent qu'e n regime transitoire et a n'importe quelle condition d'operation. C e resuhat est valide si I'humidite a I'interieur de la pile est bien controlee. Cependant l e modele produit un e erreur de 1 % lorsque la pression d'air augmente de 9% et une erreur d'environs 3 % lorsque la temperature decroit de 15 % sous I'effet d e I'humidite.
V
Le model e propos e es t integr e dan s SimPowerSystem s (SPS ) e t rend u disponibl e pou r le s usagers d u SPS . U n model e d e demonstratio n d'u n vehicul e electriqu e bas e su r un e pil e a combustible es t present e pou r fair e ressorti r le s avantage s d u model e propos e dan s l a simulation de s systeme s electrique s base s su r les piles a combustibles e t pour aussi montre r comment l a pile interagi t ave c d'autre s element s electriques . C e vehicul e es t modelis e ave c les meme s caracteristique s qu e l e nouvea u vehicul e developp e pa r Hond a (l a FCXClarity -2008). Le s performance s d u model e d e pil e e t d u vehicul e son t similaire s a l a realit e e n termes de consommation e n hydrogene, vitesse maximale et acceleration. C e qui confirme l a validite du modele du vehicule.
Le modele d u vehicul e es t un e application clair e de s piles a combustible et peut etr e utilis e comme un point de depart dans la conception et la simulation de s systemes electriques base s sur les piles a combustibles.
ACKNOWLEDGMENTS
This repor t presents my researc h wor k carried ou t at Ecole de technologie superieur e durin g my M.Eng. programme (Fro m January 200 7 to August 2008) .
This projec t wa s presented t o me b y M . Louis-A. Dessain t i n the winte r o f 200 7 an d I was excited t o participat e i n thi s projec t a s i t wa s on e o f th e researc h field s I wa s deepl y interested i n pursuing . I have previousl y worke d i n thi s field , a s a graduat e fro m Aalbor g University, Denmar k i n 2005 . m y M.Sc . thesi s wa s o n th e fue l cel l DC-D C converter ; moreover, afte r graduatio n 1 wa s hire d a s a research assistan t t o develo p a direct methano l fuel DC-D C converte r fo r the American Powe r Conversion (APC ) in Denmark. Thi s projec t has prove n t o b e a continuation o f m y previou s researc h work s bu t wit h mor e emphasi s o n the fue l cel l itsel f rathe r tha n exclusivel y o n converters , whic h make s i t ver y interesting . Having complete d thi s lates t researc h project , I a m confiden t i n m y understandin g o f th e overall system .
I would lik e to thank professor Dessain t for his trust in me in undertaking this project an d for his financia l assistance , whic h enable d m e t o focu s effectivel y o n m y researc h activities . Moreover, hi s constructiv e guidanc e an d suppor t throughou t th e projec t perio d wa s ver y much appreciated .
I would lik e t o thank als o Olivie r Trembla y fo r hi s tim e an d support . H e wa s alway s ther e when I needed hi s experience and advice throughout th e project period .
My sincer e thank s goe s t o th e technica l staff s o f Institu t d e recherch e su r I'hydrogen e i n Trois-Rivieres fo r allowin g m e to perfor m experimenta l test s o n thei r fue l cel l stacks . Thi s was crucia l i n th e validatio n o f th e propose d model . I n particular , I woul d lik e t o than k professor Kodj o Agbossou , Julie n Ramouss e an d Brun o Gagnon-Vivie r fo r thei r assistanc e and advice during the experimental tests.
VII
1 would als o like to thank m y family , fo r their support an d encouragement sinc e I left home . They kno w how hard it is to live far from hom e and they always manage to make me feel lik e they are right by my side.
Finally, with all my heart, I would lik e to express my gratitude to my girlfriend Amy , for he r time reviewing thi s report, he r support an d most importantl y he r love . Her great advic e wa s very much appreciated .
CONTENTS
Page
INTRODUCTION 1
CHAPTER 1 LITERATUR E REVIE W 5 1.1 Chemica l or mechanical model s 5 1.2 Look-u p table or curve fitting models 7 1.3 Electrica l model s 8
CHAPTER 2 FUE L CELL MODELING 1 0
2.1 Introductio n 1 0
2.2 Mode l assumptions 1 0
2.3 Fue l cell modeling equations I I
2.3.1 Fue l cell reversible (thermodynamic) voltag e I I <i.
2.3.2 Fue l cell losses 1 6 ?
g
2.3.2.1 Activatio n losses 1 6 t
2.3.2.2 Resistiv e losse s 1 8 .
2.3.3 Fue l cell dynamics 1 9 [
2.3.4 Cel l efficiency 2 0 [
2.4 Model s proposed and implementation i n SPS 2 0 '
2.4.1 Actua l cell voltage 2 0
2.4.2 Th e simplified mode l 2 1
2.4.2.1 Dat a required fo r parameters determination 2 3
2.4.2.2 Parameter s determination 2 4
2.4.2.3 Mode l output 2 4
2.4.3 Th e Detailed model 2 4
2.4.3.1 Dat a required fo r parameters determination 2 6
2.4.3.2 Parameter s determination 2 7
2.4.3.3 Mode l inputs 2 8
2.4.3.4 Mode l outputs 2 8
2.5 Mode l limitation s 2 8
2.6 Conclusio n 2 9
CHAPTER 3 MODE L VALIDATIO N 3 0
3.1 Introductio n 3 0
3.2 Mode l validatio n i n steady state , nominal condition 3 0 3.3 Mode l validation at different condition s of operation 3 2
3.3.1 Th e stack model 3 3
3.3.2 Variatio n of inlet pressures of gases at constant stac k temperature . . 37 3.3.3 Variatio n of stack temperature a t constant inlet pressures 4 0
IX
3.3.4 Variatio n of inlet air flow rate at constant temperature and pressures 4 3
3.4 Conclusio n 4 6
CHAPTER 4 MODE L APPLICATION: A FUEL CELL VEHICLE 4 7
4.1 Introductio n 4 7
4.2 Th e SPS fuel cel l stack model 4 8
4.3 Th e FCV demonstration 5 1
4.3.1 Th e electrical subsyste m 5 2
4.3.1.1 Th e fuel cel l stack 5 3
4.3.1.2 Th e DC-DC converter 5 5
4.3.2 Th e energy managemen t subsyste m 5 6
4.4 Simulation s results and stack performance 5 7
4.5 Conclusio n 6 0
CONCLUSION 6 1
FUTURE WORK S 6 3 :
(I)
APPENDIX A SIMULIN K MODEL S IN SPS 6 4 E
0
APPENDIX B PARAMETER S EXTRACTIO N PROCEDUR E 6 7 [
APPENDIX C MATLA B FIL E 7 0
APPENDIX D TES T SETU P AND EXPERIMENTAL RESULT S 7 2
LIST OF TABLE S
Page Table 1 Fue l cell types 2
Table II Fue l cell modeling equations 6
Table III Cell' s electrodes reactions 1 1
Table IV Parameter s determination fo r the detailed mode l 2 7
LIST OF FIGURE S
Page Figure I Fue l cell operating principle 1
Figure 2 Fue l cell polarization curve s 7 Figure 3 Fue l cell electrical model s 8
Figure 4 Cel l dynamics 2 0
Figure 5 Equivalen t circui t fo r the simplified mode l 2 1 Figure 6 Stac k polarization curv e showing the required fou r points 2 3
Figure 7 Equivalen t circui t fo r the detailed mode l 2 5
Figure 8 Simulatio n and datasheet results 3 1
Figure 9 Tes t results at P^jr = 25 kPa, PH^ = 35 kPa, T= 42.3 °C 3 3 I
t Figure 1 0 Stead y stat e results at P^jr = 25 kPa. PH2 = 35 kPa, T= 42.3 °C 3 4 j
Figure 1 1 Curren t interrup t test 3 5
Figure 1 2 Simulatio n results at P^ir = 25 kPa, PH 2 = 35 kPa, T= 42.3 °C 3 6 !
Figure 1 3 (P^jr , PH2 ) = (15 kPa, 1 5 kPa), T= 42 °C 3 7
Figure 1 4 (P^i r - PH2) = (25 kPa, 23.5 kPa). T= 42 °C 3 8
Figure 1 5 (P^ir . PH2 ) = (35 kPa. 33 kPa), T= 42 °C 3 8
Figure 1 6 Effec t o f pressure on the stack voltage 3 9
Figure 1 7 (P;^,, , PH2 ) = (35 kPa, 35 kPa), T= 35 °C 4 0
Figure 1 8 (PAJ H , PH2) = (35 kPa, 35 kPa), T= 39 °C 4 1
Figure 1 9 (PAI ^ . PH2) = (35 kPa, 35 kPa), T= 46 °C 4 1
Figure 20 Effec t o f temperature on the stack voltage 4 2
Figure 21 (PAIP , PH2 ) = (25 kPa, 32 kPa), T= 42.3 °C, V^ir = 20 slpm 4 4
Figure 22 (P^ p PH2 ) = (25 kPa, 32 kPa), T= 42.3 °C, V^ir = 25 slpm 4 4
Figure 23 Effec t o f air flow rate on the stack voltage 4 5
Figure 24 Mode l ico n and dialog box 4 8
Figure 25 Polarizatio n curve and stack parameters 4 9
XIII
Figure 27 Th e FCV subsystems in SPS 5 2
Figure 28 Th e FCV powertrain 5 3
Figure 29 Th e Fuel cell stack informatio n 5 4
Figure 30 Stac k wit h flow rate regulators 5 4
Figure 31 Stac k polarization curv e 5 5
Figure 32 DC-D C converter (Simulink ) 5 5
Figure 33 Energ y managemen t subsyste m 5 6
Figure 34 Simulatio n results showing the power distibution 5 8 Figure 35 Simulatio n results showing the performance o f the current regulator. . . 58
Figure 36 SP S simplified mode l (Simulink) 6 4
Figure 37 SP S detailed mode l (Simulink) 6 5
Figure 38 Fue l cell stack detailed (Simulink) 6 6
Figure 39 NedStac k PS 6 datasheet 6 7
Figure 40 Tes t setup 7 2
Figure 41 LabVIE W mask 7 3
Figure 42 Tes t results at P^jr = 1 5 kPa, PH 2 = 1 5 kPa, T= 42 °C 7 4 Figure 43 Tes t results at P^jr 2 5 kPa, PH2 = 23.5 kPa, T= 42 °C 7 4 Figure 44 Tes t results at P^jr = 35 kPa. PH 2 = 33kPa. T= 42 °C 7 5 Figure 45 Tes t results at P^jr = 35 kPa, PH2 = 35 kPa, T= 35 °C 7 6 Figure 46 Tes t results at P^ir = 35 kPa, PH 2 = 35 kPa, T= 39 °C 7 6 Figure 47 Tes t results at P^jr = 35 kPa, PH 2 = 35 kPa, T= 46 °C 7 7
Figure 48 Tes t results , V^jr = 25 slpm 7 8
NOMENCLATURE
A Tafe l slop e (V )
B Mas s transpor t constan t (V ) CQ oxyge n concentratio n (mol/m^ ) C Hea t capacit y o f the cel l (J/k g K ) D^: Effectiv e binar y diffusivit y (m"/s )
E Thermodynami c voltag e (V )
E^ Nems t voltag e (V )
EQ^, Ope n circui t voltag e (V ) F Farada y constan t ( A s/mol )
h Planck' s constan t ( J s ) ij-j. Cel l curren t (A )
i| Limifin g curren t densit y (A/m" ) IQ exchang e curren t (A )
J Mola r flux o f specie s i (mol/m" s ) k Boltzmann' s constan t (J/K )
^valve Valv e constan t associate d t o specie s i (mol/atm s ) M Mas s o f the cel l (kg )
m, n Concentratio n losse s constan t N Numbe r o f cells i n serie s n Flo w rat e o f specie s i (mol/s) P Cel l outpu t powe r (kW )
XV p, Pt qe Q, r R ^ o h m T Td Uf, V V • air V * ac t Vc V cone Ve Vrc Vr Vu • ^ , z a
Partial pressure of species i (atm) Total pressure (atm )
Electrochemical reactio n heat (J/m^) Total hea t generated due to species i (J) Cell resistance (Q)
Ideal gas constant (J/mol K) Stack resistance (Q )
Cell temperature (°K ) Cell response time (s) Utilization of species i (%) Cell voltage (V)
Air flow rate (sl/min) Activation voltage (V)
Volume of the cathode/anode(m^) Concentration voltage(V )
Cell volume (m^) Stack voltage (V) Resistive voltage(V ) Voltage undershoot (V ) Mole fraction o f species i Number o f moving electron s Exchange coefficien t
XVI ^i Ag AG Ah As Tl AFC CC
Activation losse s constant s Reaction gibb s free energ y (J ) size of the activation barrie r (J/mol ) Reaction enthalp y (J )
Reaction entropy (J/K ) Cell efficiency (% )
Alkaline Fuel Cell Courant contin u
CHP Combine d Hea t and Powe r DC Direc t curren t
DMFC Direc t Methanol Fue l Cell FCV Fuel Cell Vehicl e
LHV Lo w Heating Valu e
MCFC Molte n Carbonate Fue l Cell PAFC Phosphori c Aci d Fue l Cell
PEMFC Proton Exchang e Membran e Fuel Cell PI Proportionnal-Integra l regulator SPS SimPowerSystem s
INTRODUCTION
Over th e las t decade , ther e hav e bee n som e growin g concern s regardin g th e emissio n o f greenhouse gase s and the shrinking o f fossil fue l reserve s which hav e made fue l cel l energ y sources very attractive. This is mainly due to their high reliability, low emission of pollutants and littl e maintenance (Xi n and Khambadkone , 2003).
Fuel cell s ar e electrochemica l device s tha t conver t chemica l energ y fro m a n electrolyti c reaction directl y t o electrica l energy , rejectin g onl y hea t an d water . A cel l consist s o f a n electrolyte i n contact wit h two porous electrodes (the anode an d the cathode) on either side . Hydrogen ga s passes over the anode, and with the help of a catalyst, separates int o electrons and hydrogen ions, fhes e ion s flow to the cathode through the electrolyte while the electrons flow through a n external circui t (electricit y i s generated). A t the cathode, the hydrogen ion s combine with oxygen (from air ) to form water . This is shown in figure 1.
Fuel exces s
Fuel i n I — ^
H,0 an d hea t
<Jm Ai r in
Figure 1 Fuel cell operating principle.
(From IEEE transaction, Xin et at., 2005)
Source: Kong Xin, Ashvvin M. Khambadkone, Soy Kee Thum, A hybrid model with combined steady stale and dynamic characteristic of PEMFC fuel cell stack, p. 1618. IEEE transaction.
It ca n be note d fro m figure 1 that th e resultin g curren t flows i n th e opposit e directio n (opposite t o the conventional direction) . Thi s ca n be explained fro m th e fact tha t i n any conductive materials, the flow of protons or holes constitutes the electric current .
The nomina l voltag e produce d fro m on e cell i s abou t 0. 7 V. To obtain highe r voltages , several cells are placed in series to form a fuel cel l stack .
Depending o n thei r operatin g temperatur e an d th e typ e o f electrolyt e used , ther e exis t different kind s o f fue l cells . Type s o f fue l cell s alon g wit h thei r mobil e ion , operatin g temperature and applications are summarized i n table I.
Table I Fuel cell types
(From Larminie and Dicks, 2003)
Fuel cel l lypc
.Alk.iliiie (AhC' i Pioton fxctuni^' e meiiibnine (PEMFC 1 Direct iiietliaim l (D.MFCi F'li(>^|)lu)ric aci d (P.AFC) Molten caiLioiiat e i.MCFC) .SolitI o\iil e (SOFC) Moliilc in n OH-H+ 11+ H+ C O r 0 -Opeiatiiii! Ieiii[K-iatiiie 5()-:i)(fC 3()-l()(f'C 21)- y f f c ~22(rc ~6,5irc ,^()()-|l)()(fC Apjilicatidiis an d notes
I'secl i n spac e \eliicles , e.i: . .Apollo . Shuttle . Whicles aiii l niohil e applications , am i tor
lower powe r CH P systems
Suitable to r |)oitalil c electroni c system s o f lo w power, niniiint i fo r lonj : time s
LaiL'c numlier s o f 2()()-k\\ ' CH P s^^tems i n use .
Suitable to r ineiliuni - t o l,irt; e scal e CHP systems, u p to M W capacit y
Suitable to r al l si/e s o f CH P s\stems, 2 kW t o nuilti . \ 1 \ \ .
Source: James Larminie, Andrew Dicks, Fuel cell systems explained. 2nd edition, John VVilc> and Sons Ltd.
Areas o f applicatio n o f fue l cell s include : distribute d powe r generation , back-u p powe r generation, automotiv e an d other consume r application s includin g cellula r phones , PDA s (Personal Digita l Assistants ) and laptops.
Recently, Hond a (http://world.honda.com/FueICell ) mad e availabl e t o som e customers , a new fue l cel l vehicl e (FCV) , th e Hond a FC X clarity , whic h make s th e us e o f fue l cell s a commercial reality .
In spit e o f bein g a clea n sourc e o f energy , fue l cell s ar e onl y capabl e o f producin g unregulated d c voltage, hence the need fo r power converters to interface th e driven load . An accurate mode l o f fue l cell s i s neede d t o observ e thei r dynami c an d stead y stat e performances necessar y fo r th e design , contro l an d simulatio n o f suc h converters . A lo t o f research work has been done in fuel cel l modeling. Most of the models found i n the literatur e are based on the chemical an d thermodynamic aspect s of the fuel cell . These models can not be easil y adde d t o electrica l simulation s programs . Othe r model s represen t th e fue l cel l b y electrical circui t elements. The later models do not include the fuel cel l thermodynamics, but could b e used i n the simulation o f fuel cel l powe r systems . In both approache s o f modeling, the model parameters are obtained either empirically o r by performing som e tests on the real fuel cell .
The objectives o f this project are :
a. T o develop a fuel cel l model
b. T o validate this model with experimental dat a obtained o n real fuel cell s
In addition, model parameter s wil l have to be derived directly fro m fue l cell s manufacturer' s datasheets.
This report i s organized int o the following sections :
a. Chapte r 1 : Presents briefl y a literatur e surve y o f previou s researche s regardin g fuel cel l modeling .
b. Chapte r 2 : Th e propose d mode l i s develope d an d implemente d i n SP S (SimPowerSystems) wit h th e objectiv e o f minimu m inpu t parameter s
requirement an d higher accuracy .
c. Chapte r 3 : Deal s wit h th e validatio n o f th e mode l an d present s th e correlatio n between th e simulation result s and the experimental result s obtained fro m a real setup.
d. Chapte r 4 : Present s th e performanc e o f th e mode l i n a fue l cel l vehicl e (FCV ) demonstration i n SPS.
The final sectio n conclude s wit h a synopsi s o f th e repor t an d identifie s futur e work s t o b e done for model improvement .
CHAPTER 1 LITERATURE REVIE W
Several types of fuel cell s models exist in articles and books. These models can be classifie d into thre e categorie s whic h are : chemica l o r mechanica l models , look-u p tabl e o r curv e fitting model s and electrical models .
1.1 Chemica l o r mechanica l model s
These models includ e comple x chemica l an d thermodynamic phenomeno n suc h a s the mas s transport, hea t transfe r an d diffusio n o f specie s insid e th e cell . Base d o n th e leve l o f complexity, thev can be: f
D
r
a. Multi-dimensional : Usuall y use d t o desig n fue l cel l component s an d t o predic t J accurately th e interna l stat e o f cell s parameter s suc h a s th e membran e wate r content, reactan t concentration , catalys t utilizatio n an d membran e degradatio n (O'Hayre et al., 2006) . The y involv e th e us e o f partia l differentia l equations . CFD (Computational fluid dynamics ) models developed b y Liu and Zhou (2003 ) fall int o thi s category . Thes e model s requir e longe r simulatio n tim e an d excessi\e amount of parameters (flow channe l width, thickness of the electrolyte, porosity o f electrodes, cell volume) which ar e difficult t o determine, A s the goal of this project i s to emulate the behavior of real fuel cell s and not to design them, these models are not pertinent fo r this study.
b. One-dimensional : Widel y foun d i n th e literature , the y represen t pressur e an d temperature dynamics by first order differential equations . Models developed by researchers suc h a s Y u et al. (2006) . Pukruspa n et al. (2004) , Uzunogl u an d Alam (2006) , Sedghisigarchi an d Feliach i (2004) . Zhu and Tomsovi c (2002 ) ar e all one-dimensional . First , reactant s partia l pressure s an d cel l temperatur e ar e obtained fro m mas s an d energ y conservatio n principle s respectively . Then , th e
reversible voltag e i s obtained fro m th e Nernst equation . Finally , th e actua l cel l voltage i s determined considerin g th e irreversibl e losse s which includ e th e acti-vation, ohmic and concentration losses . These models are extended to include the diffusion proces s by some researchers such as Kopasakis et al. (2006) and Wan g
et al. (2005) . Table I I show s equation s involve d i n this approach, definitions o f
parameters can be found o n the nomenclature sectio n of the report. Table II
Fuel cell modeling equation s
Nersnt equatio n
Mass conservatio n
Energy conservation
Diffusion proces s
Actual cel l voltag e
-44 4 ^ RT
E - 1.22 9 + (T 298 ) ^^•^• ' + ^M n
zF zF
Pitfl
" ' / RT, in , ( • out. out ,, / „
- T = -rri'h ± " , - " , )^"i = f^ralveP,
at 1 ,
'h^^P^i=^eye^ZQ.
^•^•- _ /?ryV,-^;-V '
ciz p, ^ p,<ir ' ~ ^n~ ' act " ' / • "' cone'o
l\,^, = ^,+l,T+^^,T\nico^ +
^M'fc)
^'r = >-'fc';o.c = - ^ l n ( l - ^ - ) , F ^ _ = m/'^ '
Recently th e EUtec h Scientifi c Engineerin g Gmb H (www.eutech-scientific.de ) ha s developed a fuel cel l system s librar y (FClib ) containing a fuel cel l mode l whic h i s based o n this approach.
Others researchers suc h as Larminie an d Dick s (2003), Wingelaar et al. (2005). Tirnovan et
al. (2006) and Pasrich a et al. (2007) use a steady stat e model wher e the reversible voltage is
assumed to be constant.
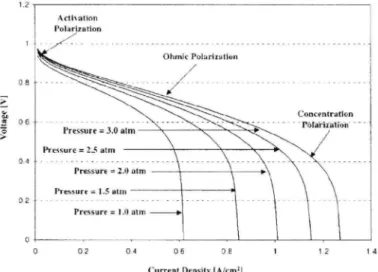
In all one-dimensional models , the procedure to determine model parameters is similar. First , experiments t o obtain polarizatio n curve s (show n i n figure 2 ) at different pressure s and temperatures ar e made o n the real fue l cell . Then, parameters (suc h a s A, B, i^, 4,, m and n) are determined b y curve fitting technique s (Pukruspa n et al., 2004). This means the model is only vali d fo r that particula r fue l cel l an d the procedure t o obtain parameter s hav e t o b e repeated fo r a different fue l cell .
ActKatkon PoUrtzation Pressure = 2.0 ai m -Ohmic Polarizatio n ^ ^ ^ \ \ " -\ -\ \ \ Pressure = 1.0 aim -^ -^ Concentration PofaHzairon
Currenl Densit y [A/cm^l
Figure 2 Fuel cell polarization curves.
(From ASME transaction, Boettner et al., 2002)
Source: Daisi e D Boettner . Gin o Paganelli.Yan n G, Guezennec, Giorgio Rizzon i an d Micliae l J. Moran, Proton exchange membrane fuel cell system model for automotive vehicle simulation and control, p. 21,Transactions o f ttie ASME, Vol, 124 ,
1.2 Look-u p tabl e or curve fittin g model s
These models are usually use d to represent fue l cell s polarization curv e in steady stat e and at nominal conditio n o f operation. The polarizafion curv e is input t o the model i n tabular form .
For a given inpu t current , th e output voltag e i s estimated b y interpolation (linear , cubi c or spline). Kim et al. (2005). Acharya et al. (2004) and Buchholz and Krebs (2007) use a linear, cubic and cubic spline interpolation metho d respectively . The effect o f pressure, temperatur e and flow rat e on the cell performanc e camio t be observed an d the user has to perform larg e data entry prio r to simulation.
1.3 Electrica l model s
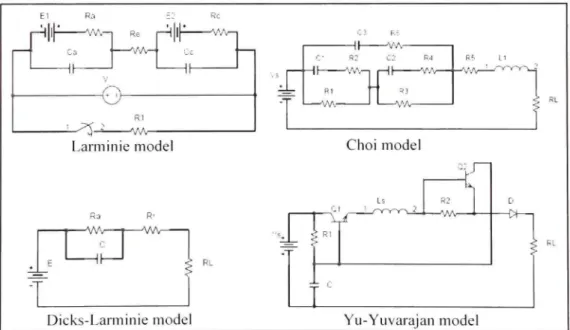
In this approach, fuel cell s are represented by equivalent electrical circuits . These models are used fo r bot h stead y an d dynami c state s assumin g a constan t conditio n o f operation . Different configuration s (show n in figure 3) are reviewed by Runtz and Lyster (2005).
11^ W . - l R e
t
r-^\\\ V/v-, V'/v- rr?y-- ^ ^ - V A -R1 Lanninie model -V^r -VW Dicks-Larminie model -VA CI' R 4 HI V A Choi inodel ry-^J.-A^V-'i ?
Yu-Yuvarajan mode lFigure 3 Fuel cell electrical models.
(From IEEE transaction, Runtz and Lyster, 2005)
Source: K J, Runtz, M, D, L>'Ster, Fuel cell equivalent circuit models for passive mode testing and dynamic mode design. p. 79 4 - 797, IEEE transaction.
In figur e 3 , model s develope d b y Larmini e an d Cho i us e capacitors , idea l d c voltag e an d resistors t o represen t cel l dynamics , the reversible voltag e an d cel l resistance s respectively . A mor e comple x mode l develope d b y Y u an d Yuvaraja n i s als o show n wher e a n inducto r and transistor s ar e adde d t o represen t th e effec t o f compresso r delay s o n th e cel l performance.
Again i t i s no t possibl e t o observ e th e effec t o f pressure , temperatur e an d flow rate . Experimental test s suc h a s th e curren t interrupt , impedanc e spectroscop y o r frequenc y response test s ar e require d t o obtai n model s parameter s (cel l resistances , respons e times , no-load voltage) .
From th e literatur e revie w above , i t i s clea r that , a t leas t th e one-dimensional , chemica l model shoul d b e used to predict th e behavior of fuel cell s at any condition o f operation. Bu t it require s experiment s t o b e mad e o n eac h fue l cel l (o r stack ) unde r stud y t o determin e model parameters . A more generi c fue l cel l mode l i s needed; a model tha t wil l emulat e th e behavior o f any typ e o f fue l cell s wit h n o experimental test s (o r at leas t on e test a t nomina l condition i f no data is available).
The nex t sectio n present s th e developmen t o f th e propose d model , th e mode l inpu t parameters are obtained directly fro m stac k manufacturer's datasheets .
CHAPTER 2
FUEL CELL MODELING
2.1 Introductio nThis chapte r present s i n a mor e detaile d manne r th e propose d fue l cel l model . A t first th e modeling equation s whic h involv e th e thermodynami c generate d voltage , fue l cel l losses , dynamics and efficiency ar e derived. Then, the cell actual voltage is deduced and two models (simplified an d detailed) are proposed and implemented i n Matlab/SimPowerSystems (SPS) .
The simplifie d mode l i s used fo r th e simulatio n o f fue l cell s a t nomina l conditio n wherea s the detailed on e i s used fo r al l conditions of operation. I n both models, the input parameter s are extracted fro m fue l cell s datasheets.
2.2 Mode l assumption s
The following assumption s are made for the model:
a. Th e gases are ideal
b. Th e stack is fed with hydrogen and air
c. Th e temperatur e a t the cathod e an d anod e i s considered stabl e an d equa l t o th e stack temperatur e
d. Th e rati o o f pressures betwee n th e interio r an d exterio r o f each flow channe l i s large enough to consider that the orifice i s choked
e. Pressure s drops across flow channels are negligibl e
f. Th e cel l voltag e drop s are due t o reaction kinetic s an d charg e transpor t a s mos t fuel cell s do not operate i n the mass transport regio n
g. Th e cel l resistanc e i s constant a t an y conditio n o f operation (informatio n o n th e type or dimension o f electrodes and electrolyte i s not generall y provide d o n fue l cell datasheets )
2.3 Fue l cell modeling equation s
2.3.1 Fue l cell reversible (thermodynamic) voltag e
The reversibl e o r thermodynami c voltag e i s th e voltag e generate d b y th e fue l cel l a t equilibrium du e to electrochemical reaction s at the electrodes.
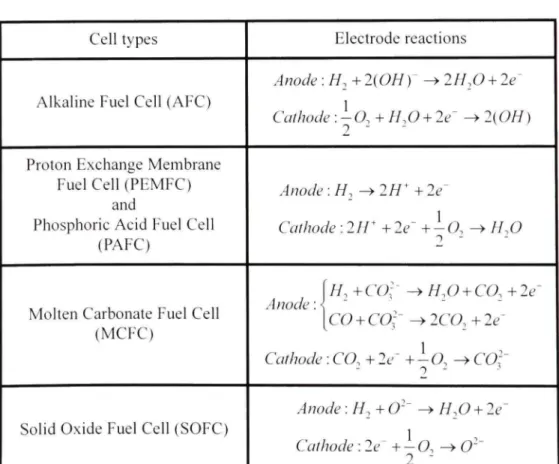
Table 11 1 show s electrochemical reaction s for common fue l cell s type fed wit h hydrogen an d air. The overall reactio n i s given by:
Hj + i^O^^HjO (2-1)
Table III
Cell's electrodes reaction s
Cell types
Alkaline Fuel Cell (AFC)
Proton Exchange Membran e Fuel Cel l (PEMFC )
and
Phosphoric Acid Fuel Cel l (PAFC)
Molten Carbonat e Fue l Cell (MCFC)
Solid Oxide Fuel Cell (SOFC )
Electrode reaction s
Anode •.H.+2{OHy -^2H,0 + 2e' Cathode-.-O^+H.O + le- ^2(0H)
2
-Anode:H,->2H*
+2e-Cathode •.2H' +2e+-0. -^ H.O 2 '
f//, +C();- -^ H,() +
CO.,+2e-Anode:{ '
[CO + CO;- -^2CO,+2e-Cathode : CO. + 2c'" + -a ^ CO':~ 0 - ^ '
Anode : H, + O" -^ H,0 + 2e~ Cathode •.2e+-0, - ^ O "
-12
The energy potential (the Gibbs free energy) of this reaction is given at standard temperature and pressure by (O'Hayre et al., 2006):
Ag = A/ 7 - /
()A5-Where Jg" = reaction Gibb s fre e energy , Ah'^ = reaction enthalpy , As" = reaction entropy an d T^ = standard temperatur e (29 8 K)
(2-2)
The standard-state thermodynamic voltage is given by:
E'
= ^^
zF
Where B = standard thermodynamic voltage , = Faraday's constan t (9648 5 A s/mol).
(2-3)
• number of moving electrons and F
At no n standard-stat e condition , th e thermodynami c voltag e varie s wit h pressur e an d temperature. It is given by the Nernst equation as follows:
£o + ( r - r „ ) .^ + ^ in
^' zF zF E^ + (T-Tr,)— + —\n zF zF PH/'O. PH/'O. V " JT< lOoV
T> lOoV
(2-4)Where £„ = thermodynami c voltag e a t a give n condition , T = Temperatur e o f operation, R = ideal gas constant (8.3145 J/ mol K) , Pj = Partial pressur e of species / inside the cell
13 E.. 1.229 + ( r - 2 9 8 ) - ^ ^^ + —I n zF zF 1.229 + ( r- 298 ) • Jil:4 3 ^ RT^^ ^ ' zF zF PH/'O, PH/'O, ' IFO V ' J T< 10 0 C T> 10 0 C (2-5)
The change in partial pressure Pj along the flow channel is determined by applying the mass conservation principle given by (Kopasakis et al., 2006):
"•' / _ RT. in r out. ,
— - yin, ±/7,-« , ) (2-6
)
Where }'^.= compartmen t volume , n,'" an d n°"' ar e th e flo w rate s a t th e inle t an d outlet of species / respectively, nf = rate of consumption o r production o f species /.
For a choked orifice flow channel, the flow rate at the outlet is given by:
", = KalveP, (2-7 )
Where A'',,^/,,^ = valve constant associate d wit h specie s /.
Putting equation (2-7) in equation (2-6), we have at steady state:
p, = - ^ ( « ; " ± " ; )
A: valve (2-8)
V = -jj—^"Hr''H,)
^valvi H,0 jJI-.O (2-9) valvPQ, - -^j—("or"o,)
K valveWhen ther e i s n o curren t flow, n o specie s ar e consume d o r produced , henc e n^ = 0 . Therefore, th e partial pressures inside the cell and at its inlet are equal. This gives:
IFO O, 1 in valve 1 in H,0 " W : 0
K.
valve 1 K. 0,_ " O : •alve (2-10)Where /'/" = inlet partial pressure of species /.
Replacing equafion (2-10 ) in (2-9), we have:
in r P H, ("H, - "H)^in IF 'IF ("lF0 + "lF0)^in PH,O in in r P O, ("O. - " O , ) ^in m 'O, o. (2-II)
15
If the fue l inpu t contain s x % of hydrogen an d air inpu t contain s v % of oxygen an d M % of water vapor , the n th e partia l pressure s a t inle t ca n b e expresse d i n term s o f fue l an d ai r supply pressures as follows :
//, x%P fuel
P)io = >''%^., .
, P'o, = y'^Pair
Where /V,,^ / and P^,,^ are the supply pressure s (absolute) of fuel an d air respectively .
The hydrogen an d oxygen utilizations are defined as :
(2-12)
U flF
Jh
in
U = - ^
(2-13)
From equation (2-1) . we have:
tin = T " ; -n
o^ 2 "^- ItFO
(2-14)Replacing equations (2-12) to (2-14) in equation (2-11) , we have:
Po^^i^-^f^P'/oPair
16
The hydroge n an d oxygen utilization s ca n be expressed i n terms o f inlet flow rate s and pressures as follows : U, fiF
u
fo.Jh
in! ^
in 60000 RTi fc -PPfuel^ Ipmijuel)^ '^° (2-16) 60000 RTi fc ^'-PPair^^pmiairyy'/o 2.3.2Where Vip,,,^,,,.!) and I'if,,,,,,,,,,
respectively, u^ = cell current .
Fuel cell losse s
are th e inlet flo w rat e (i n liter/min) o f fuel an d ai r
The losses considered here are activation losse s (due to reaction kineUcs) and resistive losse s (due to charge transport). These losses are described i n the following sections .
2.3.2.1 Activation losses
These losse s ar e due to the slowness o f chemical reaction s a t the surface o f electrode s (Larminie an d Dicks , 2003). They ar e represented b y the activation voltag e dro p (Vaci)- T^h e region on the polarization curve affected b y these losses is called the activation region .
For a PEMFC, a t the cathode, the oxygen reductio n an d the water oxidatio n occu r du e to excess an d lack o f electrons o n the electrode surfac e respectivel y (Larmini e an d Dicks, 2003). At no current, the following reaction s are taking place:
2H +i^02 + 2e~ ^HjO 2H +-0^ + 2e~ ^HjO
2 - ^
(2-17)
17
2//
+ - 0 , +
2 f^H^O
9 2 2
(2-18)
This mean s tha t ther e i s a continual forwar d an d revers e flow o f electron s fro m an d t o th e electrolyte. This movement o f electrons creates a current IQ (called the exchange current).
When th e cel l electrode s ar e connecte d throug h a n externa l circuit , th e ne t curren t tlo w i s given by the Butler-Volmer equatio n as follows (O'Hayr e et al, 2006) :
zaF\\ z(\-a)F\\
^fc = ' 0 e -e RT RT (2-19)
WTiere IQ = exchange current , a = exchang e coefficient , 1'^^ , = activatio n voltag e drop.
By assuming that I'^^ , is large (greater than 50-100 mV at room temperature a s mentioned by O'Hayre et al. (2006)), equation (2-19 ) simplifies to :
'fc = '0 ^ RT (2-20)
And we have:
'«-5K^)-'"(^
'fc > '0 (2-2i:Where A is the slope of the Tafel curv e given by:
A RT
Equation (2-21 ) is known a s the Tafel equatio n whic h wa s verified experimentall y b y Tafe l in 190 5 (Larminie and Dicks, 2003).
The exchange current ig is derived from (O'Hayr e et al., 2006) as follows :
-AG
/^ = -Fc,.—e ^ ^ (2-23 )
Where c^= reactant concentration, ^= Boltzmann's constant (1.38 X 1 0 " irK),h = Planck's constant (6 626 x 10" J s), AG = size of the activation barrier.
The reactan t concentratio n a t th e electrod e surfac e i s assume d t o b e equa l t o th e concentration alon g the flow channel, this gives:
Pji + PQ
^r = CH,^CO^_= -^ ^ - (2-24 )
Where cjij and cgj ar e the hydrogen and oxygen concentration i n the tlow channel respectively.
Replacing equatio n (2-24) in (2-23), we have:
2.3.2.2 Resistive losses
These losses are due to resistance to charge transports. There is a voltage drop caused b y the resistance of electrodes (when the electrons move fro m anod e to cathode) and the electrolyte (when protons move from anod e to cathode). This voltage drop is given by:
Vr = [fc'- (2-26 )
19
The region on the polarization curv e affected b y these losses is called th e ohmic region .
2.3.3 Fue l cell dynamic s
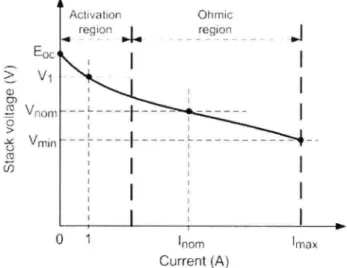
The following dynami c behaviors are considered i n the model:
a. Dynamic s due to the build up of charges at the electrode/electrolyte interface : At the cathode of a PEMFC for instance , there is a layer of protons and electrons on each side . Thi s junction store s electrica l energ y an d behave s lik e a capacitor . This buil d u p o f charge s affect s th e reactio n rat e a t th e electrode , an d thu s th e activation voltage . Whe n ther e i s a change i n current , i t take s som e tim e (Tj), before th e activation voltag e drop reaches the steady state . This gives:
,;^, = ^ I n f ^ ] . - ^ ^ ^ = ^ I n f i ^ l • - ^ (2-27 )
"" zaF ^if/ zaF v/^ ^ sTj+\ ^ '
Where Tj = cell response time.
Dynamics du e to oxygen depletion : This i s present whe n ther e i s a considerable delay i n the air compressor . Th e amoun t o f oxygen provide d a t the cell inpu t i s lesser tha n wha t i s required t o sustain the load . Oxygen utilizatio n increase s an d consequently th e Nernst voltag e (£„ ) reduces. This creates a voltage undershoo t
(V^i) a t th e cel l output . Th e voltag e undershoo t i s proportional t o the maximu m
attainable utilization which depends on the compressor delay and the current rat e of increase . Thi s effect i s represented i n the model b y reducin g th e Nernst volt -age b y a n amoun t proportiona l t o th e utilizatio n whe n th e oxyge n utilizatio n i s greater than its nominal value. The Nemst voltag e is modified to :
Pn = •
P.I-Pn K(U.
-Jo, ^f nam) Ur >Ur Jo, JO,im>m)
Uf <Uf
Jo, Jo,(nnm)
(2-28)
20
The cell dynamics are represented i n figure 4 .
(A ) oltag e > < * Curre n
u
T "
V.lVu
Tim Time (s )Figure 4 Cell dynamics.
2.3.4 Cel l efficienc y
The cel l efficienc y i s usuall y give n wit h respec t t o th e lowe r heatin g valu e (LHV) , that' s with the assumption tha t the water produced i s in steam form. The efficiency i s given by:
n';;Ah°(H20igas)) 100
ZFUr V
JH,
Ah°{H,0{gas)) X 100 (2-29)
Where P = cell output power , Ah" (HjOigasJ) = reaction enthalp y o f water vapor (241,83 kJ/mol), V = cell output voltage.
2.4 Model s proposed an d implementation i n SPS
2.4.1 Actua l cell voltage
From th e above discussion , th e actual cel l voltag e ca n be deduced b y combining th e Nems t voltage, the losses and cell dynamics as follows :
r = E-A\n\2£ I'F
•J -vr.- i ' '
(2-30)For a stack with A'cells in series, the stack voltage is given by:
V,„ = A^ - £ . , - ^ l n - ^ fc
2.4.2
Jc
Where l-V ^ = stack outpu t voltage .
The simplified mode l
V ^^rf+ 1 -/•/ fc (2-31)
From equation (2-31), we have:
''fc = poc-^--i^-[f y-^-R^.jj^
'0 -^^ d^ ^
Where Eg^ = NE„ = open circui t voltage , Rgi„„ = Nr = stack resistance .
(2-32)
Equation (2-32 ) can be represented b y an equivalent circui t show n i n figure 5 . This circuit i s a simplified mode l of the fuel cel l stack where parameters (E^^., R^i„„. ig, NA) are constants.
r-4£ = £ • - <V. 4 In • ^ ^ DC '/C '0^ ^-^.y+ i D ^ohm
-X-<f^
he Jc <:^?->
This mode l represent s a particula r fue l cel l stac k operatin g a t nomina l conditio n o f temperature an d pressure . A diode i s use d t o preven t th e fiow o f negativ e curren t int o th e stack. The model is implemented i n SPS exactly as in figure 5 using a controlled \ oltage and a 1 us delay to break the algebraic loo p (as the output voltage at time / depends on the current at th e sam e instant) . Th e ful l vie w o f th e mode l i s show n i n appendi x A . Th e ope n circui t voltage i s reduce d exponentiall y t o limi t th e outpu t powe r whe n th e curren t reache s it s maximum value .
The dat a require d t o determin e th e mode l parameter s ar e obtaine d fro m stack' s datasheet . Generally fue l cel l stac k manufacturer s provid e dat a showin g th e stac k performanc e a t nominal condition . Dat a whic h ar e usuall y give n o n stac k datasheet s ar e th e followin g (a n example of a stack datasheet fro m NedStac k i s attached i n appendix B):
a. b. c. d. e. f g-h. i.
J-Rated current, voltage and powe r Maximum curren t and powe r Number o f cells
Stack efficienc y Operating temperatur e Supply pressures of gases Air and hydrogen flow rate Purity of hydrogen
Nominal polarizatio n curv e Stack response tim e
2.4.2.1 Data required for parameters determination
For th e simplifie d model , fou r parameter s (E^^., Roi,„,, i^, NA) ar e t o b e determined , whic h requires a t leas t fou r simultaneou s equations . Tw o point s fro m eac h regio n (activatio n an d ohmic) are taken on the polarization curv e as shown in figure 6.
S V | o > o 55 i E Q C Vi nom / 'mm 1 Activation region • < - -L
1
t —
L -r1
1
1
Ohmic region LJ
1
1
1
1
1
1
^ 0 1 'nom Current (A ) 'maxFigure 6 Stack polarization curve showing the required four points.
These points correspond t o the following :
a. Curren t and voltage at nominal operating point: (I„„„,, V„om)
h. Curren t and voltage at maximum operatin g point: {I,„ax, Vmm) c. Voltag e at 0 and 1 A: (E^^., V,)
A stac k respons e tim e i n secon d (T^j) is neede d i f th e use r wishe s t o ad d th e dynami c
2.4.2.2 Parameters determination
From equation (2-32 ) we have at steady state, the following se t of equations:
24 r, = E^^ + NA\ni,-R ^nom = Poc-N^^^ 0 ohm nom] n j ohm nom ymin = Poc-NA\nV^]-R,,„J,„a. (2-33) This gives: NA = iy^-^^nom)il|na.-^)-(^\-^'mln)i^nom-^) •n(A,o»,)(A,u,.v-l)-ln(/,„,,)(/„„„,-l) _ V^ - ynom-NA\n{I„,„„) R ohm '0 = e (^ nom -E.,, + R.,„^ NA J (2-34) 2.4.2.3 Model output
The output of the model are the stack voltage (V) and power (kW )
2.4.3 Th e Detailed mode l
The detaile d mode l represent s a particula r fue l cel l stac k whe n th e parameter s suc h a s pressures, temperature , composition s an d flow rate s o f fue l an d ai r var\' . Thes e variation s affect th e Tafel slop e {A), the exchange current (/>,) and the open circuit voltage (Eg^).
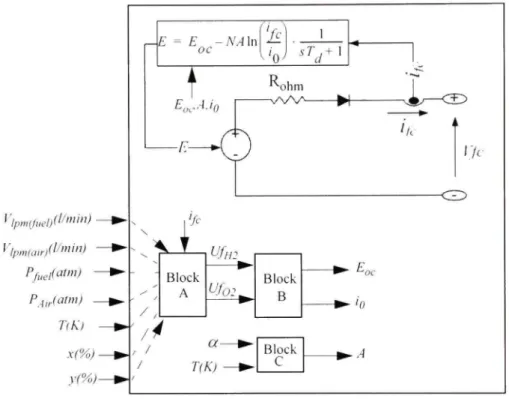
The equivalen t circui t o f th e detaile d mode l (show n i n figure 7 ) i s th e sam e a s fo r th e simplified one . except tha t th e parameters {E^^., i^. A) wil l hav e t o b e update d base d o n th e input pressures and flow rates, stack temperature an d gases compositions.
^ipmlfuel)('^"''"> ^''lpm(airj(>/'»>"> Pj„,l(atm) -TiK) X(%) • y(%)-E = y(%)-E -A'/tlnU^ ' oc j ^ J Roh m r J / 1 ^ A A /
>.r
/ ,V^
Block Ai
Ufij '-'J/J J / T(K) — • / Block B Block C 1 T , + 1 a ' • 1 k E • ' 0 • • ^1.
*• r/c f NFigure 7 Equivalent circuit for the detailed model.
The ope n circui t voltag e i s proportional t o the Nernst voltage . A t n o current , the hydroge n and oxyge n utilizatio n ar e nul l an d th e Nernst voltag e depend s onl y o n th e inle t pressures . When the current i s greater than zero, the Nernst voltage depends on both the utilizations and inlet pressures. The open circuit voltage is then given by:
K.Pn
.KcPn
'fc^O
'fc>^ (2-35)
26
In figure 7, firstly, Block A calculates the utilizations usin g equations (2-16). Then, Block B calculates th e ope n circui t voltag e an d th e exchang e curren t usin g equation s (2-35 ) an d (2-25). Finally Block C calculates the Tafel slop e using (2-22). These blocks are added easily to the SPS simplified model .
When the input flow rates are zero or the maximum curren t i s reached, the Nemst voltag e is reduced exponentiall y t o limi t th e outpu t power . Th e ful l vie w o f th e mode l i s show n i n appendix A .
2.4.3.1 Data required for parameters determination
For the detailed model, in addition to (E^^, Rgi,,,,, ig, NA), five more parameters (or, AG, K, Kj,
K^.) ar e to be determined. Therefore , i n addition t o the fou r point s o n the polarization curv e
and the stack response time, the following variable s are needed :
a. Numbe r o f cells in series (JV)
b. Nomina l LH V stack efficiency (^„o„, ) in % c. Nomina l operatin g temperature (T',,^,,,,) in °C d. Nomina l ai r flow rate (I^'„„Y"om;) '"i liter/min
e. Absolut e supply pressures (PfueKnom)^ Pair(nom)) in atm f. Nomina l compositio n o f fuel an d air (.v„^,„, v„o„,, ^^'nom) •" % g. Voltag e undershoo t (1',^ ) in V
A guid e showin g th e procedur e t o extrac t thes e dat a fro m stack' s datashee t i s attache d i n appendix B .
27
2.4.3.2 Parameters determination
The parameter s (E^^, Rg/„„, i^, NA) ar e determine d exactl y a s i n th e simplifie d model . Th e remaining parameters are determined usin g the set of equations show n in Table IV
Table IV
Parameters determination fo r the detailed mode l
Parameters Equations
a a NRT^ zFNA
AG
AG=-^r_,.in[^
^P^^PH,(nom) ^.(nom) Po,(nom))TR
om)
H,(nom) ^nom°'^°^^ ^f„fnom))Pfuel(n
0,(nom) ynom v / ^ (nom)) air(nom)
u
fn,i„o„,) 2FV ^ n„,,„A/?°(//,0(ga5))A ^U, fo,(„„n,) 2zFP 60000i?r NI nom nom
air(nom) air(nomy nom
K: and K^ K = -^ E = F \
• E ""
" I
K^ U, = 0, Uf = 0 -'«, ^o. -0, 'o. K Kv..
P-c^'^fo^imax) ^fo^(nom)) ^fo,Ona.) = 0. 6A maximum oxyge n utilizatio n durin g transient i s assumed t o be equal t o 60 % as most fue l cells operate with output inductor s which limi t the rate of increase of current. Normally, fue l cells operate with oxygen utilizatio n aroun d 50%.
The Matlab-file use d to calculate the parameters is attached i n appendix C .
2.4.3.3 Model inputs
The inputs to the model arc the tbilowing:
a. Operatin g temperature (°K )
b. Suppl y pressures of gases (atm or bar) c. Ga s flow rates at inlet (liter/minute )
d. Ga s compositions (%H T i n the fuel, %0-i and %H20 in air)
2.4.3.4 Model outputs The model outputs are:
a. Stac k voltage (V) and power (kW)
b. Fue l and air consumptions i n standard lite r per minute (slpm ) c. Stac k efficiency (% )
2.5 Mode l limitation s
The following ar e the limitations of the model:
a. Chemica l reactio n dynamics caused by the variation of partial pressure of species inside the cell is not considere d
29
c. Th e effect o f temperature an d humidity o f the membrane o n the stack resistanc e is not considere d
d. Th e stack output power is limited by the fuel an d air tlow rates supplied
2.6 Conclusio n
In this chapter, a fuel cel l stac k model i s developed an d implemente d i n SPS. The modelin g equations which make up the model are derived and the model assumptions are stated .
Two models are proposed along with their equivalent circuits. The parameters required i n the model ar e determine d base d o n dat a provide d b y th e user . Thes e dat a ar e obtaine d easil y from fue l cel l manufacturer' s datasheet . Th e mode l inputs/output s variable s ar e mentione d and its limitations are stated.
The mai n advantag e o f thes e model s compare d t o th e previou s mode l develope d i n th e literature i s that n o test i s required o n rea l fue l cell s or data treatment an d calculation s prio r to simulation. In addition, these models are generic models and able to emulate the behavio r of any fuel cell s types fed wit h hydrogen and air.
The next chapter discusses the validation of these models and presents a correlation betwee n the model behavior and the real stack's performance .
CHAPTER 3 MODEL VALIDATIO N
3.1 Introductio n
This chapter focuse s o n the validation o f the proposed models . A 6kW-45V PEMF C stac k i s modeled an d it s stead y stat e performanc e i s validate d b y comparin g th e polarizatio n curv e obtained i n simulation with the real curve from th e datasheet .
Data provided by most stack manufacturers ar e usually at nominal condition of operation and do not giv e a clear insight as to how the stack performance change s with parameters suc h as gases pressure, flow rates and temperatures.
In orde r t o observ e th e elTec t o f thes e parameters , experiment s ar e performe d o n th e EPAC-500 (500W-48V , PEMF C stack ) a t differen t condition s o f operation . A detaile d model o f th e stac k i s made an d th e simulatio n result s ar e compare d wit h th e tes t result s t o ascertain the validity o f the model.
3.2 Mode l validation i n steady state, nominal conditio n
A model o f a 6kW-45V, PEMFC stac k (the NedStack PS6 ) from NedStac k i s made using it s datasheet. Dat a ar e extracte d a s describe d i n appendi x B an d th e mode l parameter s ar e determined.
The simplifie d mode l an d th e detaile d mode l ar e equivalen t a t nomina l conditio n o f operation (as their model parameters are equal).
31
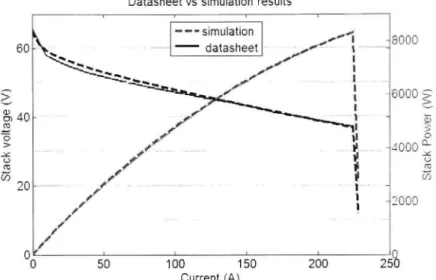
The polarizafio n curve s obtained i n steady stat e fro m bot h model s ar e superimpose d o n th e datasheet curv e as shown in figure 8 .
Datasheet vs simulation result s
8000 6000 § 4000' 2000 50 100 15 0 Current (A) 200 250
Figure 8 Simulation and datasheet results.
The dotte d lin e show s th e simulate d curv e wherea s th e soli d lin e i s th e rea l curv e fro m datasheet. I t is observed tha t th e simulate d curv e matche s exactl y th e real on e i n the ohmi c region. A differenc e i s observe d i n th e activatio n regio n du e t o th e non-linearit y o f th e activation voltage (more points are needed at low current to determine a better value of IQ and a).
The sam e resul t wil l b e obtaine d fo r an y typ e o f fue l cell s a s the y al l hav e simila r polarization curves .
Considering tha t mos t fue l cell s operat e i n th e ohmi c region , th e propose d model s ar e therefore adequat e fo r stead y stat e simulatio n o f fue l cell s powe r systems . Th e leve l o f accuracy o f the model depends on the precision of data provided by the user.
3.3 Mode l validation a t different condition s o f operation
A 500W-48V fue l cel l stack (EPAC-500) from Hpowe r is used to observe the stack behavio r when ga s pressures , flow rate s an d temperatur e change . Th e stac k an d th e tes t setu p ar e provided b y Institut de recherche su r I'hydrogene (IRH ) in Trois-Rivieres.
The tes t setu p (show n i n figur e 40 , appendi x D ) allowe d th e variatio n o f th e followin g parameters:
a. Inlet pressures of gases: Hydroge n i s kep t i n a high pressur e tan k an d it s inle t
pressure i s se t manuall y usin g a pressur e valve . A compresso r i s use d t o pressurize th e inle t air . Ai r inle t pressur e i s se t b y th e use r fro m th e LabVIE W mask (show n i n figure 41 , appendix D) . Both inle t pressures ca n be varied fro m
15 kPa to 35 kPa (relative pressure) .
b. Inlet flow rates of gases: Flo w rat e regulator s ar e used t o allow th e variatio n o f
inlet flow rates. As there i s no return path for th e hydrogen fro m th e stack outle t to th e tank , i t i s no t possibl e t o operat e th e stac k a t fixed hydroge n flow rat e (hydrogen wil l b e wasted) . Therefor e th e stac k alway s operate s a t hydroge n udlizafion close d to 100% . For air, it is possible to impose any flow rate (starting from 1 0 slpm) o r t o operat e a t an y oxyge n ufilizatio n (maximu m o f 50%) . Ai r flow rat e an d oxyge n utilizatio n reference s ar e give n throug h th e LabVIE W mask.
c. Stack temperature: Ai r cooling is used to control the stack temperature. There are
temperature sensor s throughou t th e stac k an d th e averag e temperatur e i s controlled b y varyin g th e inpu t voltag e o f fans . Th e temperatur e ca n b e varie d from 2 7 °C to 50 °C.
d. Load current or power: A n electronic loa d i s used and the user can vary the fue l
33
In order t o compar e th e tes t an d th e simulatio n result s whe n thes e parameter s change , a detailed model is necessary.
3.3.1 Th e stack mode l
As the stack's datasheet i s not available, a performance tes t at a given condition of operation is required to obtain data such as the polarization curve, efficiency, stac k response time etc., which will be used to determine the parameters of the model.
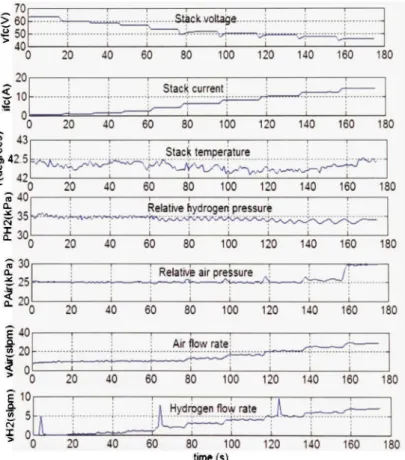
Figure 9 show s th e tes t result s a t hydroge n an d ai r inle t pressure s o f 3 5 kP a an d 2 5 kP a respectively. 70 > 60 a 50 40 .Stack-voUage., 20 40 80 100 120 14 0 16 0 18 0 20 S l O Stack current i 100 12 0 14 0 16 0 18 0 20 4 0 6 0 8 0 to o 12 0 14 0 16 0 18 0 ^ 3 0 a. 2 20
Relati\« air pressure
20 4 0 6 0 8 0 to o 12 0 14 0 16 0 18 0
0 2 0 4 0 6 0 8 0 10 0 12 0 14 0 16 0 18 0
Figure 9 Test results at /*^,y = 25 kPa, Pfj2 = 35 kPa, T= 42.3 "C.
34
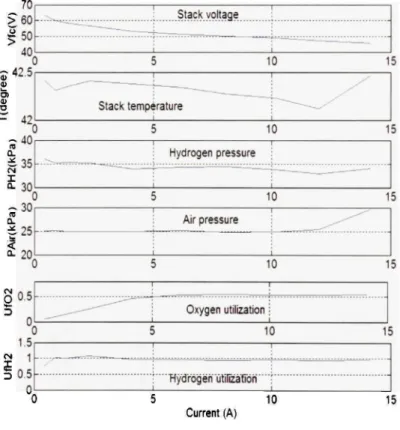
From figur e 9 , th e polarizafio n curv e i s obtaine d b y takin g te n point s o n th e vfc-tim e characteristic. These points ar e chosen i n steady stat e and at similar ga s utilizations. Figur e 10 shows the derived polarization curv e along with the stack temperature, gas pressures and utilizations. I t ca n b e note d tha t th e hydroge n utilizatio n get s highe r tha n lOO^ o at lo w current. This is due to the fact that at lower current, the residue of hydrogen insid e the stack contributes in the reaction.
70 > 6 0 I 5 0 40, :;r42,5 - 42 , ^ 4 0 a. S 30 ™ 3 0 < Q. 20, §05 5 0 I 1,5 § 0, 5 Stackyoltage 10 Stack temperature 10 Hydrogen pressure 10 Air pressure 10 Oxygen utilization j 10 ' Hydrogen "ulilEaBon' Current (A) 10 15 15 15 15 15
Figure 1 0 Steady state results at /*4,> = 25 kPa, Pfj2 = 35 kPa, T= 42.3 "C.
35
a. (/„„,„ , !„„,„ ) = (8.128, 50.28) b- (/,„^ „ (',„,„ ) = ( 14.155, 45.707) c. (£„,,r/ ) = (65.7, 58.4)
a. N= 65 (this value is mentioned on the stack)
b. //„„, „ = 58.83% (using equafion (2-29) )
d- ^aiiinom) ^ 14.9 1 liter/min (using equation (2-16) )
^- y'fuel(nom)^ 'air(nom)) ~ ( L 3 5 , L_5 )
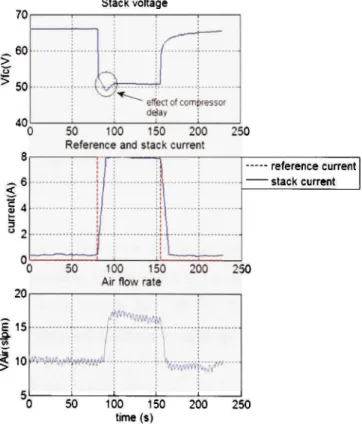
Figure 1 1 shows the result obtained fro m a current interrup t test . Fro m this test, parameter s such as the stack response time, compressor delay, voltage undershoot can be estimated. We have r^ = Is , l], = 2.5 V and compressor delay = Is.
70 ,60 50 40. -^6 < | 4 3 20 Stack voltage
a
^3^^ l/-^ effed of compressor d^ay S 1 5 50 10 0 15 0 20 0 Reference and stack current 250• reference current - stack current
50 10 0 15 0 20 0 25 0 Air flow rate
• r v
10h»*M^MyWiW.'*-4 rSyvivvwEvv"'^
-50 100 15 0 20 0 25 0 time (s)
36
The parameters of the model are determined and the stack is simulated at the same condition of temperature, gas pressures and utilizations.
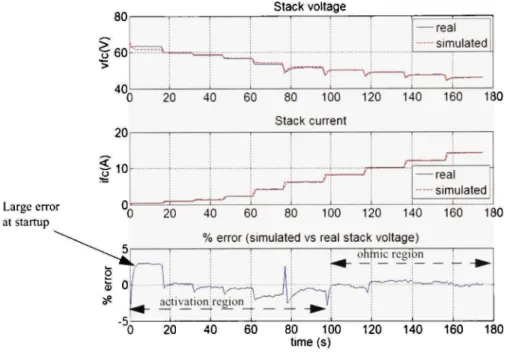
Figure 1 2 shows the simulafion result s along with the percentage error between the simulated and the real output voltage.
80 Stack voltage 60--40, 20 ^ 1 0 : ^ > ^ -real - simulated 20 4 0 6 0 8 0 10 0 12 0 14 0 16 0 18 0 Stack cun-ent Large error at startup —1 r — - i — ^ -real - simulated 0 2 0 4 0 6 0 8 0 10 0 12 0 14 0 16 0 18 0 % error (simulated vs real stack voltage )
20 4 0 6 0 8 0 10 0 12 0 14 0 16 0 18 0 time (s)
Figure 12 Simulation results at P^,-^ = 25 kPa, Pff2 = 35 kPa,
T=42.3''C.
It can be observed from figure 1 2 that in the activation region, the steady state error is within ±1% a t normal operatio n wherea s th e transient an d startup error s are within ±3% . In th e ohmic region , th e error reduce s t o les s tha n ±0.5 % for bot h transien t an d steady stat e conditions. This shows that the stack behavior is well represented by the model.
The larg e erro r at startup is mainly due to the residues o f hydrogen an d oxygen insid e the stack a t the beginning o f the experiment. Thi s make s th e real reactan t utilization s muc h greater than the simulated utilizafions .
37
Now having the stack model, it is possible to submit both the stack and the model to differen t condifions o f operatio n an d compar e thei r behavior . Th e followin g variation s o n th e condition of operation are made:
a. Variatio n of inlet pressures of gases at constant stack temperatur e b. Variatio n of stack temperature at constant inle t pressures
c. Variatio n of inlet air flow rate at constant stack temperature and inlet pressures
3.3.2 Variatio n of inlet pressures of gases at constant stack temperatur e
Figures 42, 43, and 44 in appendix D show the test results at (P^i,., P^i) " (1 ^ 1^^ ' 1 ^ ^^^)-, (P^jy, P/zj) = (25 kPa, 23.5 kPa) and (P^,,, P„2) = (35 kPa, 33 kPa) respectively. The stack temperature is held constant to 42 °C.
The simulation and test results at same conditions are shown in figures 13 , 1 4 and 15 .
Stack voltage — rea l — simulate d 0 2 0 4 0 6 0 8 0 10 0 12 0 14 0 16 0 18 0 Stack current lb < i o *= 5 0 " -— ' . 1 1 fF" i 1
_ r
^
r-f-:1
1 /' — rea l -—- simulated 0 2 0 4 0 6 0 8 0 10 0 12 0 14 0 16 0 18 0 % error "0 2 0 4 0 6 0 8 0 10 0 12 0 14 0 16 0 18 0 time (s)38 70 g60 u •5 50 40, 20 10 10 Stack voltage — rea l — simulate d _ I L _ b 2 0 4 0 6 0 8 0 10 0 12 0 14 0 16 0 18 0 Stack curren t _J L -real - simulated 0 2 0 4 0 6 0 8 0 10 0 12 0 14 0 16 0 18 0 % error -| 1 1 r -iohmic region 0 2 0 4 0 6 0 8 0 10 0 12 0 14 0 16 0 18 0 time (s)
Figure 1 4 (P^i„ Pjf2) = (25 kPa, 23.5 kPa), T= 42"C.
stack voltag e 40, 20 < 10 ^ 0 -10, 10 0 2 0 4 0 6 0 8 0 10 0 12 0 14 0 16 0 18 0 Stack current T r -I 1 1 r ''- I - - - • \ - < • - , — rea l simulated 0 2 0 4 0 6 0 8 0 10 0 12 0 14 0 16 0 18 0 % error n r -ohmic region _[ actiya^n_region ^ 0 2 0 4 0 6 0 8 0 10 0 12 0 14 0 16 0 18 0 time (s)
39
It ca n b e observe d fro m figure s 13 , 1 4 an d 1 5 tha t a s th e ga s pressure s increase , th e percentage erro r i n stead y stat e doe s no t var y muc h i n th e activatio n regio n (erro r les s thantl %, except at startup and abnormal operafion). In the ohmic region this error increases with pressure (less than±0.5% a t P.^^^ = 1 5 kPa, closed to 1 % at P^jy = 25 kPa and closed to 2% at P^i,. = 35 kPa). This difference i n the ohmic regio n i s mainly due to the fac t tha t th e stack resistanc e i s assume d t o b e constan t i n th e mode l a t al l condition s o f operation . I n reality, a s th e ai r pressur e increases , th e relafiv e humidit y insid e th e stac k increases , thi s means cell' s membran e get s mor e humid . Thi s increase s th e membran e conductivit y an d therefore th e stac k resistanc e decreases . This explains wh y th e real stac k voltag e i s greater than the simulated voltage in that region.
For P^jr = 15 kPa and P.j„. -= 25 kPa, the humidity inside the cell is lower or close to its value at nominal conditio n (nomina l humidity) . This means the resistance doesn't var y much an d therefore th e error is very low.
Figure 1 6 shows th e effect o f pressures o n th e stac k voltage . The increas e i n stac k voltag e with pressures is verified experimentall y as well as in simulation. The large error at startup is due to the residues of hydrogen and oxygen inside the stack as stated earlier.
Real Simulated
- PAIr = 35 kPa, PH2 = 33 kPa PAImZS kPa, PH2=23 5 kPa •PAir=15kPa, PH2=15kPa
50 10 0 15 0 20 0 • 0 time (s)
-PA]r= 35kPa. PH2 = 33 kPa PAir= 25 kPa, PH2= 23 5 kPa •PA]r= 15kPa , PH2 = 15kP a
50 10 0 15 0 20 0 time (s)