HAL Id: hal-01078097
https://hal.archives-ouvertes.fr/hal-01078097
Preprint submitted on 28 Oct 2014
HAL is a multi-disciplinary open access
archive for the deposit and dissemination of
sci-entific research documents, whether they are
pub-lished or not. The documents may come from
teaching and research institutions in France or
L’archive ouverte pluridisciplinaire HAL, est
destinée au dépôt et à la diffusion de documents
scientifiques de niveau recherche, publiés ou non,
émanant des établissements d’enseignement et de
recherche français ou étrangers, des laboratoires
A novel interface for audio based sound data mining
Gregoire Lafay, Nicolas Misdariis, Mathieu Lagrange, Mathias Rossignol
To cite this version:
Gregoire Lafay, Nicolas Misdariis, Mathieu Lagrange, Mathias Rossignol. A novel interface for audio
based sound data mining. 2014. �hal-01078097�
A novel interface for audio based sound data mining
Gregoire Lafay
IRCCyN, Ecole Centrale de Nantes 1 rue de la Noe Nantes, France
Nicolas Misdarris
IRCAM 1 Place IgorStravinsky Paris, FranceMathieu Lagrange
IRCCyN, Ecole Centrale de Nantes 1 rue de la Noe Nantes, France
Mathias Rossignol
IRCAM 1 Place IgorStravinsky Paris, FranceABSTRACT
In this paper, the design of a web interface for audio-based sound data mining is studied. The interface allows the user to explore a sound dataset without any written textual hint. Dataset sounds are grouped into semantic classes which are themselves clustered to build a semantic hierarchical struc-ture. Each class is represented by a circle distributed on a two dimensional space according to its semantic level. Sev-eral means of displaying sounds following this template are presented and evaluated with a crowdsourcing experiment.
Categories and Subject Descriptors
H.2.8 [Database Management]: Database Applica-tions—Data mining
General Terms
Design, Experimentation, Human Factors
Keywords
audio-based sound data mining, listening oriented user interface, crowdsourcing experiment
1.
INTRODUCTION
With the growing capability of recording and storage, the problem of indexing large databases of audio has recently been the object of much attention [12]. Most of that effort is dedicated to the automatic inference of indexing metadata from the actual audio recording [13, 11]; in contrast, the ability to browse such databases in an effective manner has been less considered. The temporal aspect of sounds has been studied in [8] and the use of multidimensional projection of audio features in [4].
Typically, a sound data mining interface is based on keyword-driven queries. The user enters a word which characterizes the desired sound, and the interface presents
him with sounds related to this word. The effectiveness of this principle is primarily based on the typological structure and nomenclature of the database. However, some issues arises from this paradigm:
1. Sounds, as many others things, can be described in many ways. Sound may be designated by their sources (a car door), as well as by the action of those sources (the slamming of a car door) or their environments (slamming a car door in a garage) [7, 10, 2]. Designing an effective keyword-based search system requires an accurate description of each sound, which has to be adaptable to the sound representation of each user.
2. Pre-defined verbal descriptions of the sounds made available to the users may potentially bias their selections.
3. Localization of the query interface is made difficult as the translation of some words referring to qual-itative aspects of the sound such as its ambience is notoriously ambiguous and subject to cultural specificities.
4. Unless considerable time and resources are invested into developing a multilingual interface, any sys-tem based on verbal descriptions can only be used with reduced performance by non-native speakers of the chosen language.
To avoid those issues, we propose in this paper sev-eral means of displaying sounds without relying on any textual representation. Their effectiveness is studied with a search-based task whose aim is to listen to a target sound, and browse the database using the eval-uated display to find this target sound as fast as pos-sible. The proposed displays are first described along with the dataset used for evaluation. We then explain the chosen validation protocol, before finally presenting and discussing performance results.
2.
INTERFACE FRAMEWORK
2.1
Dataset structure
The interface framework requires a pre-organization of the sound dataset it has to display. This organization is based on semantic considerations. A sound is char-acterized by a tag describing the source of the sound (man-yelling, car-passing). Sounds are then grouped into classes according to their tags (car > car-passing; car > car-starting). Those classes are in turn packed into classes until high level classes describing broad con-cepts are reached (traffic > car > car-passing). The sound dataset is organized into a hierarchical structure of semantic classes as described in Figure 1. The dif-ferent levels of this hierarchy are called semantic levels. Strictly speaking, the sound samples of the dataset are the leaf semantic levels. All the other classes are repre-sented by a prototype sound that best characterizes the sounds belonging to the class.
That description implies that there are as many leaf classes as sounds in the dataset, which would be un-realistic for large datasets. We therefore propose, in that case, to adapt the organization by considering the leaf classes as collections of semantically similar sound samples. Thus, two sounds of male-yelling would be grouped into a single leaf class with the tag male-yelling. The leaf class would then also have a prototype sound being the most representative item of the different male-yelling sounds belonging to the leaf class.
In order for the semantic hierarchical structure to be perceptually valid, the tags describing the classes were chosen from the names of sound categories found by studies addressing environmental auditory scenes per-ception [10, 2, 5]. In cognitive psychology, sound cate-gories may be regarded as intermediaries between col-lective sound representations and individual sensory ex-periences [5]. It is our belief that using such category names to build the hierarchical structure makes the lat-ter perceptually motivated, and thus meaningful for the users.
2.2
Displays
In this section, two listening oriented displays, called respectively Progressive Display (PD) and Full Display (FD) are presented. Both interfaces 1) allow users to ex-plore a sound dataset without any written textual help and 2) base their display upon the hierarchical structure of the dataset. The two interfaces have been designed in order to see whether a progressive top-down display of the hierarchical structure helps the user explore the dataset.
As shown on Figures 2 and 3, both interfaces are based on the same principle of distributing in a 2D space the hierarchical structure of the sound elements of the dataset. Each sound class is represented by a circle.
Level 0 (top class)
Level 1 Level 2 (leaf class)
Traffic Truck passingTruck
Truck starting car
Human voice
Figure 1: Semantic hierarchical structure of the dataset of urban environmental sounds
Figure 2: Full Display (FD) with a non visible hierarchical organization of semantic classes Circles are packed together according to the hierarchi-cal semantic organization of the dataset, as shown on Figure 4. Thus, subclasses belonging to the same class are close to each others. Circle packing functions of the D3.js (Data-Driven Documents) javascript library [1] are used to distribute the sound classes in the space. The way in which a user visualizes the hierarchical organization varies with the interface:
• PD: users have access to the intermediate seman-tic levels of the hierarchy. Upon first using PD, they observe circles representing the top classes of the semantic hierarchical structure of the dataset. When users click on a circle, they hear the sound prototype of the class and the subclasses are pro-gressively revealed, represented by white circles contained in the circle that has just been clicked. The same action repeats itself until the user reaches the leaf classes of the hierarchy. The leaf classes
(a) (b) (c)
Figure 3: Progressive Display (PD) with a visible hierarchical organization of semantic classes: (a) initial folded version; (b) partly folded version; (c) unfolded version
Traffic
Truck
Truck starting
Figure 4: Spatial configuration of the Progres-sive Display (PD) based on the semantic hierar-chical structure of the dataset
are represented with small gray circles, indicating that there is no subclass to discover. Thus the PD has a constrained exploration system. When a user click on a circle, sub-circles are automati-cally revealed to him in a gradual way. Each time a sub-circle is automatically revealed, its sound prototype is played. Users may stop the discovery process by clicking on an other circle.
• FD: users can directly visualize the whole hierar-chy, down to the leaf classes. Those leaf classes are distributed in the same manner as PD. In that
sense, the spatial configuration of the unfolded ver-sion of PD, which may be obtained after discover-ing all the classes and subclasses, is similar to that of FD, as shown on Figures 2, 3 and 4.
3.
VALIDATION TEST
3.1
Objective
During this test, three interfaces are compared: • PD, which provides a visible hierarchical
organi-zation of semantic classes;
• FD, which provides a non-visible hierarchical or-ganization of semantic classes;
• an Acoustic Display (AD) providing a 2D repre-sentation based on acoustic descriptors. In this case, the spatial configuration is computed by 1) describing the sounds with mel-frequency cepstrum coefficients (MFCCs) and 2) using a non metric multidimensional scaling with Kruskal’s normal-ized stress to compute sound positions in a 2D space. An example of AD can be seen on Figure 5.
By comparing PD and FD, the effect of a visible hi-erarchy on the user is investigated. The goal is to check if forcing the user to browse the high levels of the hi-erarchy helps him to understand and learn the spatial configuration and the organisation of the sound classes.
Figure 5: The Acoustical Display (AD) com-puted using a non metric multidimensional scal-ing on MFCCs based acoustic descriptors By confronting PD and FD with AD, the relative ef-ficiencies of semantic based and acoustic based spatial configurations are compared.
3.2
Experimental protocol
We choose to test and compare the three displays through a crowdsourcing experiment. Here is the link to access the experiment web page1.
Subjects are asked to successively retrieve 13 target sounds in a dataset of 149 urban environmental sound events. The target sounds are distributed such as there are at least two target sounds in each top-level class of the semantic hierarchical structure of the dataset. To minimize order effects, target sounds are randomly presented to each subject.
To listen to a target sound, the subject has to click a Play target sound button. Subject may replay the target sound as many times as they like. A timer is started when the subject clicks on a circle for the first time.
When the target sound is found, subject puts an end to its search by clicking on the Click if found button. This action 1) stops the timer and 2) loads a new target sound. If the subject does not find the correct target sound, an error message appears, and the experiment continues.
During the experiment, two indications are commu-nicated to the subject:
• The research state: ”pause” if the subject is cur-rently not looking for a target sound (at the be-ginning of the experiment, or between two target sounds); ”in progress” if the subject is currently looking for a target sound.
• Remaining target sounds: the number of target sounds which remain to find.
The experiment ends when all the target sounds have been found.
1http://217.70.189.118/soundthings/speedSoundFinding/
It is most important to note that PD do not pack up at each target sound search. When a circle is revealed, it remains visible during the whole experiment.
3.3
Data Collection
Three sets of data are collected during the experi-ment:
• the total duration of the entire experiment. It in-cludes breaks between two target sound searches and it is called the absolute duration.
• the duration of each search. The sum of the 13 duration searches, which is the absolute duration minus the break times between two target sound searches, is called the relative duration.
• the name of each sound which has been heard. • the time at which each sound has been heard.
3.4
Apparatus
A crowd sourcing approach has been adopted. The experiment was designed to be supported by the chrome-browser web navigator. The link to the experiment has been sent to the subjects via three mailing list being music-ir, auditory and uuu-IRCAM (internal IRCAM mailing list). Subjects were allowed to perform the ex-periment once, and on one interface only. Data were automatically collected server-side at the end of the ex-periment. Subjects were asked to use headphones. All the presented sounds were normalized to the same root mean square (RMS) level.
3.5
Participants
60 subject have completed the experiment, 20 for each interface.
4.
RESULTS
4.1
Outlier detection
Outlier detection is an important step of any crowd-sourcing experiment as experimenters do not control the experimental environment in which the subjects per-form the experiment [9][3]. A widely used method to detect outlier in human-computer interaction studies is to consider as outlier an observation which deviates of at least ±2 standard deviation (ST D) from the average [9]. As this method is not robust to the presence of isolated extreme observations (as it is often the case for crowdsourcing experiment), a method using the inter-quartile range (IQR) proposed by [9] is used in this pa-per. With this approach, an observation is considered to be an outlier if it is more than 3 ∗ IQR higher than the third quartile or more than 3 ∗ IQR lesser than the first quartile. For normalized distribute data, the IQR method remove less than 0.00023% of the data whereas
Table 1: Standard deviations of the number of heard sounds per subject, with and without out-liers.
Interface PD FD AD with outliers 141 155 315 without outliers 139 140 146
Table 2: Standard deviations of the relative du-ration per subject, with and without outliers.
Interface PD FD AD with outliers 353 277 520 without outliers 363 249 273
the ST D method remove 4.6% of the data [9]. This methods is applied to the following list of parameters:
• durations of each target sound search • average duration of target sound searches • maximum duration of target sound searches • relative duration
• absolute duration
• number of heard sounds for each target sound search • average number of heard sounds
• maximum number of heard sounds • total number of heard sounds
Using the IQR method, 4 subjects are detected as outliers and removed from the analysis. 1 subject used PD, 1 subject FD, and 2 subjects AD. 2 subjects are detected by observing the absolute duration (4 and 12 hours), 1 subject by observing the total number of heard sounds (1800 heard sounds, roughly 12 times the total size of the corpus) and 1 subject by observing the num-ber of heard sound for the first target sound search (321 heard sounds, including 21 times the target sound).
The tables 1, 2 and 3 measure the effect of the pres-ence of the outliers on the standard deviations of three observed data being the total number of heard sounds, the relative duration and the absolute duration. The re-moval of the outliers have important effects on the data distributions, specially for AD.
4.2
Interface efficiencies
To characterize the displays efficiencies, three set of collected data are assessed:
• the relative duration
Table 3: Standard deviations of the absolute du-ration per subject, with and without outliers.
Interface PD FD AD with outliers 1401 339 4034 without outliers 408 327 273 PD FD AD 5 10 15 20 25 relat ive d ura tion (min)
Figure 6: Boxplot representing the distributions of the relative durations for the PD, FD and AD
• the number of heard sounds
• the number of heard sounds without duplication. By ”without duplication” we mean that, if a same sound prototype is heard 10 times during the 13 searches of the experiment, it counts only for one. The two first data help us qualify the notion of effi-ciency by considering the time and the number of clicks needed to achieve the task (ie. reach the target). The goal for those values is to be as low as possible. The third data allows us to measure the selectivity of the interfaces. A low number of heard sounds without du-plication indicates that subjects understood the spatial organisation of the dataset, and use this knowledge to improve their searches. In contrary, a high number of heard sounds without duplication suggest that the
sub-200 300 400 500 600 700 800 Numbe r of h ea rd so un ds PD FD AD
Figure 7: Boxplot representing the distributions of the numbers of heard sounds for the PD, FD and AD
ject did not understood the way circles are organized in space, and tends to play all the sounds at each search. The maximum number of heard sounds without dupli-cation is the corpus size: 149 sounds.
Concerning the relative durations, distributions of the data are displayed on Figure 6 for the three interfaces. FD seems to perform better than the other interfaces, whereas PD and AD seem to have similar results. To re-fine the analysis, a two sided Wilcoxon rank sum test is considered. It is a non parametric statistical test which tests the null hypothesis that two set of observed data originate from distributions having equal median [6]. As expected, FD is significantly better than the other interfaces (FD-PD: p = 0.0142; FD-AD: p = 0.028) and there is no statistical differences between PD and AD (PD-AD: p = 1).
Distributions of the numbers of heard sounds are dis-played on Figure 7 for the three interfaces. Results are similar of those observed for the relative durations. FD significantly outperforms the other interfaces (FD-PD: p= 0.0115; FD-AD: p = 0.018), whereas PD and AD show similar outcomes (PD-AD: p = 0.3699).
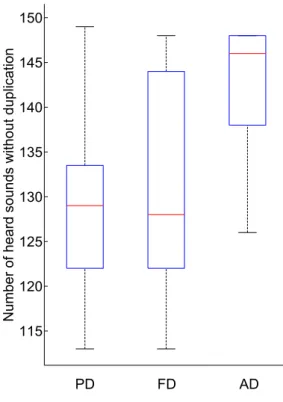
Lastly, Figure 8 displays the distributions of the
num-PD FD AD 115 120 125 130 135 140 145 150 Numbe r of h ea rd so un ds wit ho ut d up licat ion
Figure 8: Boxplot representing the distributions of the numbers of heard sounds without dupli-cation for the PD, FD and AD
ber of heard sounds without duplication. This time the results of AD are significantly lower than those of both PD and FD (AD-PD: p = 8.4910.10−4; AD-FD:
p = 0.027). For AD, 75% of the subjects heard more than 138 sounds, and 25% heard 148 sounds, that is almost the entire database. Considering PD, 75% of subjects heard less than 133 sounds, against 144 for FD. There is no statistical differences between the PD and FD (PD-FD: p = 0.8607), indicating that those two interfaces perform equally.
According to those results, a hierarchical organization of the dataset based on semantic values (PD and FD) allows users to retrieve the 13 target sounds 1) quicker, and 2) by listening to a smaller amount of sounds than an organization based on acoustic descriptors (AD). But those two effects are significantly compromised when users have to parse the entire hierarchy to reach the first target sound, as it the case for PD. It seems that impos-ing a graphical representation of the hierarchy disturbs or confuses the user instead of allowing him to learn the spatial organization of the classes.
4.3
Learning phenomenon
We now study if and how users progressively acquire knowledge about the spatial organization of the classes. To do that, variations of the data over the searches are assessed. Three sets of collected data are used:
• the duration of each target sound search
• the number of heard sounds for each target sound search
• the number of heard sounds for each target sound search without duplication.
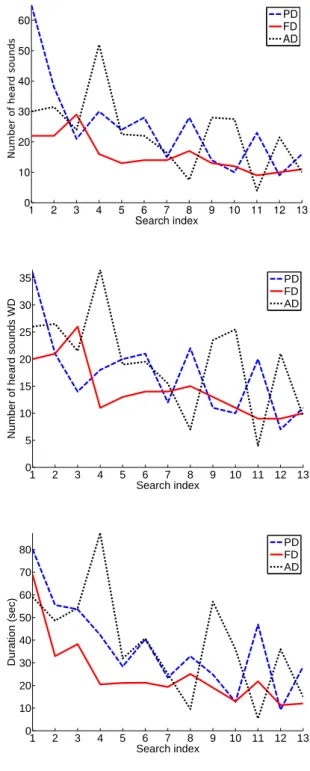
Figure 9 (bottom) displays the evolution of the me-dians of the durations of each target sound search ob-served over the subjects for PD, FD and AD. It is inter-esting to note that both for PD and FD, the maximum value is observed for the first search, whereas it is ob-served for the fourth search for AD. Moreover if the curve profiles of PD and FD seem to progressively de-crease and are very similar, the one of AD is much more irregular. If we compare PD and FD, we note that the durations are systematically shorter for FD, except for the search 12. Furthermore, for FD, a threshold of 25 seconds is reached from the search four, whereas it is of 50 seconds for PD.
Figure 9 (top) displays the evolution of the medians of the numbers of heard sounds for each target sound search, observed over the subjects for the three inter-faces. If the curve profiles of PD and AD seem to be similar to those respectively observed for the durations, here the maximum value for FD is reached for the third search. Again, values of FD are mostly below those of PD, except for the search index 3,10 and 12. For both PD and FD the curves oscillate from the search four, but those oscillations occur in a range of 9 − 17 for FD and 9 − 30 for PD. Similar results are found for the evo-lution of the medians of the numbers of heard sounds without duplication, shown on Figure 9 (middle).
Those results tend to indicate that PD and FD fa-cilitate the learning of the spatial configuration, as the search durations and the numbers of heard sounds at each search decrease over time. Although curves for PD and FD have similar profiles, FD seem to better perform as users of FD where able to find the target sounds faster by clicking on fewer circles.
5.
CONCLUSION
In this paper, two displays allowing users to explore a sound dataset without written textual help are pre-sented. The interfaces distribute sounds represented by circles on a 2D space. The spatial organisation is driven by semantic features. The two graphical displays are as-sessed and compared to a third listening based interface in which spatial configuration depends upon acoustic
1 2 3 4 5 6 7 8 9 10 11 12 13 0 10 20 30 40 50 60 Search index Nu mb er o f h ea rd s o u n d s PD FD AD 1 2 3 4 5 6 7 8 9 10 11 12 13 0 5 10 15 20 25 30 35 Search index N u m b e r o f h e a rd s o u n d s W D PD FD AD 1 2 3 4 5 6 7 8 9 10 11 12 13 0 10 20 30 40 50 60 70 80 D u ra ti o n ( s e c ) Search index PD FD AD
Figure 9: Medians of (top) the numbers of heard sounds at each target sound search, (middle) the numbers of heard sounds without duplication (WD) at each target sound search, (bottom) the relative durations at each target sound search
features. The tests consist in data retrieval tasks. The Full-Display (FD), that allows users to directly visual-ize the leaf classes of the semantic hierarchical structure,
proves to be the most effective interface for the task. Two main conclusions may be derived from this ex-periment. First, a spatial configuration based on se-mantic features is more effective to retrieve target sounds than a spatial configuration based on acoustic features. Second, an imposed visualisation of the semantic hier-archical structure of the dataset does not help user to understand and learn the spatial configuration of the semantic class, but instead disturbs the navigation.
6.
ACKNOWLEDGEMENTS
Research project partly funded by ANR-11-JS03-005-01.
7.
REFERENCES
[1] M. Bostock, V. Ogievetsky, and J. Heer. D3: Data-driven documents. IEEE Trans.
Visualization & Comp. Graphics (Proc. InfoVis), 2011.
[2] A. Brown, J. Kang, and T. Gjestland. Towards standardization in soundscape preference assessment. Applied Acoustics, 72(6):387–392, 2011.
[3] S. Buchholz and J. Latorre. Crowdsourcing preference tests, and how to detect cheating. In INTERSPEECH, pages 3053–3056, 2011. [4] P. Cano, M. Kaltenbrunner, F. Gouyon, and
E. Batlle. On the Use of FastMap for Audio Retrieval and Browsing. ISMIR, 2002.
[5] D. Dubois, C. Guastavino, and M. Raimbault. A cognitive approach to urban soundscapes: Using verbal data to access everyday life auditory categories. Acta Acustica united with Acustica, 92(6):865–874, 2006.
[6] J. D. Gibbons and S. Chakraborti. Nonparametric statistical inference. Springer, 2011.
[7] O. Houix, G. Lemaitre, N. Misdariis, P. Susini, and I. Urdapilleta. A lexical analysis of environmental sound categories. Journal of Experimental Psychology: Applied, 18(1):52, 2012. [8] M. Kobayashi and C. Schmandt. Dynamic
Soundscape: mapping time to space for audio browsing. ACM SIGCHI Conference, 8, 1997. [9] S. Komarov, K. Reinecke, and K. Z. Gajos.
Crowdsourcing performance evaluations of user interfaces. In Proceedings of the SIGCHI Conference on Human Factors in Computing Systems, pages 207–216. ACM, 2013.
[10] M. Niessen, C. Cance, and D. Dubois. Categories for soundscape: toward a hybrid classification. In INTER-NOISE and NOISE-CON Congress and Conference Proceedings, volume 2010, pages 5816–5829. Institute of Noise Control Engineering, 2010.
[11] G. Tzanetakis and P. Cook. Multifeature audio segmentation for browsing and annotation. In IEEE WASPAA, pages 1–4, 1999.
[12] E. Wold, T. Blum, D. Keislar, and J. Wheaten. Content based retrieval of audio. IEEE
Multimedia, 1996.
[13] T. Zhang and C. Kuo. Hierarchical classification of audio data for archiving and retrieving. IEEE Transactions on Acoustics, Speech, and Signal Processing, pages 1–4, 1999.