Cash holdings, corporate governance and
financial constraints
Edith Ginglinger and Khaoula Saddoura
Janvier 2007
Key words: cash holdings, financial constraints, governance
JEL classification: G32, G35
Abstract
We examine the relation between cash holdings, quality of governance and financial constraints. We find that firms with strong shareholder rights hold more cash, contrary to the predictions of agency theory. This result is partly due to the positive correlation that exists between governance quality measures and the degree of financial constraint faced by the firm. We show that governance quality has no impact on cash holdings by financially unconstrained firms. It does, however, have a positive impact on the cash holdings of certain financially constrained firms, particularly family firms. Anti-takeover provisions give these firms extra flexibility, enabling them to issue shares without the founding family losing control, and provide an alternative to high cash holdings.
1. Introduction
Determining the level of cash holdings is one of the most important financial decisions a manager has to make. When there is an inflow of cash, the manager may decide to distribute it to shareholders as dividends or through a share repurchase, invest it, or save it to cover future needs. This last solution is far from negligible: the average level of cash in U.S. firms stood at 22% of assets over the period 1990-2003 (Dittmar and Mahrt-Smith, 2007). Cash holdings may serve commendable purposes, allowing the firm to seize profitable investment opportunities as they arise (Keynes, 1936); or they may, on the contrary, indicate agency problems (Jensen, 1986). In the first case, cash gives the firm flexibility, a particularly valuable resource when under financial constraints. But once the firm has ready access to capital markets, advantage in holding cash is less clear. Such situations may relate to the second case, where large cash holdings result from management’s desire for greater discretion to finance any investments that may arise, even if they are value-reducing, because an increase in the firm’s size tends to increase their own power.
The objective of this article is to compare two hypotheses for cash holdings: flexibility for financially constrained firms (firms with limited access to capital markets), and agency problems. We show that these hypotheses are not mutually exclusive. Measuring potential agency conflicts by the number of anti-takeover provisions in place at French corporations, we show that the least financially constrained firms are also the firms with the weakest shareholder rights. These firms hold less cash than financially constrained firms, often characterized by higher shareholder rights. Our results shed light on the findings in several previous studies that the firms with the weakest shareholder rights had less cash, although their agency conflicts should lead them to hold large cash reserves.
Our study is based on past theoretical and empirical research that has attempted to explain the level of cash holdings on the basis of financial constraints or agency conflicts. One hypothesis argues that financially constrained firms should have higher cash holdings. For example, Kim, Mauer and Sherman (1998) develop a model in which firms’ decisions depend on a tradeoff between costs related to external financing and to low returns on cash holdings, and the ability to make profitable future investments using accumulated cash. Firms with the highest external financing costs, which are more likely to be financially constrained, should hold more cash. Opler, Pinkowitz, Stulz and Williamson (1999) find that firms with the greatest
access to capital markets, such as large firms and those with high credit ratings, and therefore the least financially constrained tend to hold lower ratios of cash to assets. Almeida, Campello and Weisbach (2004) show that in financially constrained firms cash levels are sensitive to cash flows, whereas in financially unconstrained firms the level of cash holdings is independent of cash flow.
The second hypothesis refers to agency theory, in which firms with severe agency conflicts are expected to have the highest cash holdings. In the presence of agency costs resulting from managerial discretion, managers, instead of paying out available funds to shareholders, will prefer to keep funds within the firm, even when available investments are value-reducing. Many studies, that measure agency costs by an index of shareholder rights, confirm this hypothesis. The existing empirical studies fall into two main categories and lead to contradictory findings. In the first category are comparative analyses that use cross-country samples and show that cash holdings are higher in countries with poor shareholder protection and less developed financial markets (Dittmar, Mahrt-Smith and Servaes, 2003). Studies in the second category examine a given country, and find that cash holdings increase with shareholder protection levels, as measured by a governance index (for example Harford, Mansi and Maxwell, 2006, for U.S.) To provide some explanation for these contradictory results, we examine them in the light of the presence of financial constraints. In the first case, access to external resources is difficult and costly for firms located in countries with poorly-developed capital markets. These firms tend to be financially constrained. The governance index used to assess investor protection is largely based on market development and the quality of the institutional and legal environment. There is thus a negative correlation between governance quality and the degree of firms’ financial constraints. The results of cross-country studies emphasising governance characteristics in fact echo the results of studies of financially constrained firms: firms in less developed countries where governance quality is low are likely to be financially constrained, and therefore hold more cash (Khurana, Martin and Pereira, 2006). What remains to be done is to link the contradictory results for a given country to the degree of financial constraint. Our hypothesis is that shareholder rights measures and the firms’ degree of financial constraint can be correlated variables. Harford et al. (2006) find a significant negative correlation between the size of the firm and its governance quality. The same correlation is noted in Gompers, Ishii and Metrick (2003): poorly governed firms are significantly larger than high-quality governance firms. If small firms are supposed to be more financially constrained than large firms, these findings
entail a positive relationship between the degree of financial constraints faced by a firm and the quality of its governance.
In this paper, we examine this issue for French firms for the period 1998 to 2002. The typical French firm has concentrated ownership relative to U.S. firms. Governance quality is assessed by the number of anti-takeover provisions adopted. First, we find that firms with low governance quality have lower cash holdings. Second, we find that this result is partly due to the correlation between governance and financial constraints. The largest and least financially constrained firms are also those with the most widely dispersed ownership. The managers of these firms seek protection through anti-takeover provisions, while small, highly-concentrated ownership firms need less protection against hostile buyers. Although the least financially constrained firms, which on average have lower governance quality than constrained firms, have lower cash holdings, for the subsample of unconstrained firms, we show that governance quality has no impact on cash holdings. However, shareholder rights do have a positive influence on cash holdings for certain financially constrained firms, particularly firms that do not pay dividends and family firms with limited access to external financing. Introducing anti-takeover provisions enables these firms to issue new shares without forfeiting control, providing a source of flexibility that is an alternative to holding large cash reserves.
The remainder of the paper is organized as follows. Section 2 presents our hypotheses related to financial constraints and governance effects on cash holdings. Section 3 describes the governance characteristics of French firms, and the data are discussed in Section 4. Section 5 reports empirical results and our conclusions are contained in Section 6.
2. Financial constraints and governance hypotheses
2.1. Financial constraints and cash holdings
In a world of perfect capital markets, cash holdings are irrelevant. In such an environment, firms would have instant access to external financing. However, when there are transaction costs,1 especially a fixed cost associated with raising capital, firms may find it useful to hold
cash reserves. This incentive will be the greater when the firm is financially constrained, and has profitable investment opportunities and volatile cash flows. As a result, financially constrained firms are led to hold high levels of cash so as to be able to invest in any profitable project that arises. Financially unconstrained firms, on the other hand, have little to gain from cash holdings, as they have easy access to the capital markets, enabling them to take quiet advantage of profitable investment opportunities as they arise. Bates, Kahle and Stulz (2006) demonstrate that changes in the level of cash holdings in US firms over the period 1980-2004 differ depending on whether or not the firm pays out dividends. For non-dividend payers, the mean ratio of cash to total assets more than doubles from 1980 to 2004, whereas the average cash holdings of established stable firms barely increase over that period. The non-dividend payers include many recent IPO firms with a higher idiosyncratic risk (see e.g. Brown and Kapadia, 2007) that reflects their cash flow volatility. These firms are also the most financially constrained. Not only do financially constrained firms have greater cash holdings, but their cash holdings increase with the level of cash flow, as established by Almeida et al. (2004) so that cash in constrained (unconstrained) firms is sensitive (insensitive) to the firm’s cash flow.
2.2. Agency conflicts, governance and cash holdings
In the presence of agency costs, managers may stockpile cash to increase their discretion and pursue their own objectives at shareholder expense. They are thus in a position to seize investment opportunities without having to wait to raise funds, or to undertake value-reducing investments. If shareholders are concerned about potential agency conflicts, adding one dollar to the firm’s cash holdings increases its value by an amount of less than one dollar, as Faulkender and Wang (2005), and Pinkowitz, Stulz and Williamson (2006) have shown. Dittmar and Mahrt-Smith (2007) also document that shareholders assign a lower value to an additional dollar of cash reserves when agency problems are likely to be greater.
Opler et al. (1999) deduce several empirical predictions from the presence of agency costs resulting from managerial discretion. They argue that agency costs are greater when ownership is dispersed, so that widely-held firms are presumed to have greater cash holdings. Likewise, low-leverage firms, which are less subject to the discipline of capital markets, and firms protected by anti-takeover provisions, should hold more cash. While the negative relation
between cash and leverage appears to be confirmed in most studies, tests of the other two predictions have produced mixed results.
The empirical tests of the effects of agency conflicts and governance quality on cash holdings have followed two main approaches. The first approach tests agency theory predictions on samples of countries with heterogeneous legal and institutional environments and varying degrees of capital market development. The second approach examines the effect of shareholder rights on cash holdings in a given legal context.
Using the first approach, Dittmar, Mahrt-Smith and Servaes (2003) analyse 1998 data for approximately 11,000 companies from 45 countries in 1998. They find that firms in countries with the lowest level of shareholder rights hold almost 25% more cash than firms in countries with the highest level of shareholder rights, and conclude that poorly-protected shareholders cannot force managers to disgorge excessive cash. However, these authors do not have firm-level data on shareholder and governance features, and use only the country-wide measures of shareholder rights as developed by La Porta et al. (1998). Thus their study provides no clearcut conclusion at the firm level for the effect of agency costs on cash holdings. Pinkowitz, Stulz, and Williamson (2006) find that cash is less valuable in countries with poor financial and economic development, but their dataset uses a country-level measure of ownership concentration which once again does not allow for tests of the managerial agency problem at the firm level. Kalcheva and Lins (2004) analyse detailed ownership data for a sample of over 5000 firms from 31 countries and show that cash levels are higher when the management group and its family have effective control of a firm. The positive relation between cash holdings and effective managerial control is more pronounced when external shareholder protection is lower. However, their study lacks detailed data on the divergence between the degree of control and cash flow rights. Thus, cross-country studies find that poor shareholder protection leads firms to hold more cash, but this conclusion is limited by the difficulty of obtaining the firm-level governance data, that are needed to separate the effects of corporate governance from that of market development level and financial constraints on firms.
Within country tests of agency theory predictions for cash holdings have mainly focuse on the U.S.2 Opler et al. (1999) find little support for the agency cost motive for cash holdings. They find that management ownership has a positive effect on cash holdings only for low insider ownership (< 5%). They explain this result by arguing that shareholders in the U.S.
enjoy strong protection and can therefore force managers to distribute excess cash. Mikkelson and Partch (2003) find no differences in the ownership structure of cash-rich firms and firms with normal cash levels and Opler et al., 1999 find that anti-takeover amendments have no significant effect on cash holdings. This finding may result from two opposite effects: while anti-takeover devices may encourage entrenched managers to hoard more cash, they can also attract buyers who could use that cash to finance their acquisition. However, Harford (1999) finds that the likelihood of a firm becoming a takeover target is significantly negatively related to holding excess cash.
Harford et al. (2006) examine the relation between the management of cash holdings and an index of shareholder rights, developed by Gompers, Ishii, and Metrick (2003). In contrast to the cross-country research, they find that firms with weak shareholder rights have smaller cash reserves and dissipate cash more quickly, primarily through acquisitions, than managers of firms with strong shareholder rights.
2.3. Financial constraints and governance effects
Overall, the two approaches used in prior empirical tests of the agency effects on cash holdings lead to contradictory results. An alternative interpretation of these findings is that in countries with weak shareholder rights, firms find it more costly to raise external funds, and therefore, they hold more cash. For example, Rajan and Zingales (1998) and Demirguc-Kunt and Maksimovic (1998) find that industries or firms that rely on external financing exhibit greater growth in financially developed countries. Love (2000) shows that in countries with a lower level of financial market development firms hold more cash. Using firm-level data for 35 countries covering about 12,782 firms for the years 1994-2002, Khurana, Martin and Pereira (2006) find the sensitivity of cash holdings to cash flow decreases with financial development. Beck, Demirguc-Kunt and Maksimovic (2004) conclude that the impact of financial underdevelopment is more financially constraining on small than large firms.
Dittmar et al. (2003) show that the impact of the market-to-book ratio on cash is lower in countries with weak shareholder rights, indicating that cash is not simply held to cover future investments, but due to managerial discretion. However, the lack of firm-level governance data prevents a disentangling of governance characteristics from financial constraints.
In within country studies, the least financially constrained firms are also those with the most dispersed ownership, and therefore are firms that are the most likely to introduce
anti-takeover provisions. Thus, the finding that firms with weaker shareholder rights hold less cash may be explained by the fact that these firms encounter the weakest financial constraints, and therefore are the least in need of cash. Governance indexes such as those constructed by Gompers et al. (2003), which attribute considerable importance to anti-takeover amendments, also show positive correlation with firm size.
Our hypothesis is therefore as follows: firms with weaker shareholder rights, as measured by the number of anti-takeover devices adopted, also tend to be the firms with few financial constraints, and that both factors may explain their low cash holdings. The strategy of our research is to separate these two factors, agency costs and financial constraints, by conducting a detailed analysis of the factors that explain cash holdings at French firms.
3. The governance characteristics of French firms
3.1. The French institutional setting
In France, as in most Western European firms, ownership tends to be concentrated. Faccio and Lang (2002) show that 36.93% of European firms are widely-held, whereas in France this percentage decreases to 14%. Similarly, 44.29% of European firms are controlled by a single family, versus 64.82% in France. Although Faccio and Lang assume that 20% of the voting shares suffices for control, we use a more restrictive definition of control, considering a firm to be controlled when the largest shareholder has at least one third of voting rights, given that this level represents a blocking minority. Under French law, there are two types of shareholders’ meeting. Decisions by ordinary meetings, which approve the accounts, appoint and dismiss directors, and approve bond issues. These measures require approval of a majority of 50% of voting rights. Decisions by extraordinary meetings, which are empowered to make all decisions amending the charter, require a two-thirds majority of voting rights.
3.2. Governance index
French law allows various devices intended to discourage takeovers or dissociate voting rights from cash flow rights. These devices reduce minority shareholder rights. We construct a
governance index by adding one point for each provision that reduces minority shareholders’ protection. The following types of provisions are taken into account:
Pyramids are identified as shareholdings of more than 10% of the voting rights. Firms held by another listed firm are typical examples. We broaden the definition of a pyramid to cover situations where one shareholder holds a significant interest in a firm, even if it does not reach a 33.1/3% threshold. (All our results remain valid if only pyramids at the 33.33% level are taken into account).
Dual class shares: these have been allowed since 1983. Low class shares have no voting rights.
Double voting rights can be authorized through the charter of the firm for registered shares that have been held for more than x years (where x is between 2 and 4 years). In contrast to dual-class shares, the voting right is attached not to the share but to the shareholder. If the shareholder with double voting rights sells the share, the buyer acquires a share with only one voting right. All shares, (with either single or double voting rights), are traded on the same trading line, so that the price of the shares is identical.
Voting caps can be authorized by the charter to limit voting rights in general shareholders’ meetings to x% or a certain percentage of votes cast at the meeting. This means a larger shareholder can use only a certain percentage of his voting rights. Voting thresholds place shareholders under an obligation to inform the company when
their shareholding reaches a level of x% of the capital or voting rights (where x is 0.5% or more), under penalty of a 2-year suspension of voting rights. This obligation may be a deterrent for a hostile takeover bid. French law also contains standard notification procedures that apply to all shareholders reaching 5%, 10%, 20%, 33 1/3%, 50% and 66 2/3%.
Limited partnership firm is a corporate structure that has partners with unlimited liability who manage the firm, and passive partners who provide financing and whose liability is limited to their equity contribution. As the active partners’ shares are non-transferable, and the charter can make removal of the managing partner practically impossible, use of this form of legal entity is a highly effective anti-takeover provision.
4. Data
4.1. Sample selection
Our sample incorporates all non-financial firms listed on Euronext Paris at the end of the years 1998, 2000 and 2002. Accounting and financial data are collected from the Compustat and Datastream databases. Governance data are collected manually from the firms’ annual reports3, since computer-based databases supply only a limited amount of governance information, state shareholdings as percentages of capital rather than percentages of voting rights, and supply no information on the anti-takeover provisions needed for constructing our governance index. After eliminating firms for which required data are missing, our final sample contains 818 firm-years.
4.2. Definition of variables
We use a number of proxy variables to test our hypotheses. To assess the relation between cash holdings and a firm’s control structure, we estimate regressions in which the firm’s cash holding is the dependent variable, measured as the ratio of cash and marketable securities to total assets.4 The regressions include ownership variables and a variety of control variables that previous research has shown to be useful to explain variation in cash holdings.5
Ownership variables
Ownership concentration could have important implications for potential agency costs, leading to two opposite cash holding predictions. Large shareholders can monitor managers more effectively, resulting in lower than expected agency costs (Shleifer and Vishny, 1986). From this perspective, ownership concentration should be associated with a lower cost of external financing, reducing the need to hold cash balances. However, Shleifer and Vishny (1997) argue that in controlled-firms, there are agency costs between minority and controlling shareholders. Large shareholders can impose costs on other shareholders in the form of wealth
3 Governance data are partly taken from the database used in Ginglinger and Hamon (2007), with additional information collected directly from annual reports.
4 We checked the robustness of our results by measuring cash holding as the ratio of cash to total assets minus cash, and as cash-to-sales ratio. These alternative measures lead to the same main conclusions.
5 Besides the transaction cost model, the static trade-off model (Myers, 1977) and the pecking order model (Myers and Majluf, 1984) also provide several testable hypotheses.
redistribution, so that ownership concentration may lead to large cash holdings. We measure ownership concentration as the percentage of capital held by the main shareholder. We include a dummy variable, which takes the value of one for all family-controlled firms in which the main shareholder is an individual or a group of individuals, including control by non-listed companies. Other types of control consist of firms held by banks or insurance companies, and by non-financial companies and state-owned firms. We measure the discrepancy between cash flow rights and control rights held by the controlling shareholder as the ratio of the difference between control rights and cash flow rights to the cash flow rights. We employ a dummy variable that takes the value of one if a financial institution owns more than 5% of the capital. A financial institution shareholder can reduce the financial constraints on the firm, as it can facilitate access to loans and other external financing. We also include the governance index defined above.
Definition of financial constraints
We use two measures to assess the extent of the financial constraints faced by the firm. The first, inspired by Almeida et al. (2004), is based on the size of the firm’s assets. A firm is considered financially constrained (unconstrained) if the size of its assets lies in the first (last) three deciles of the distribution. The second measure takes into account the firm’s ability and/or intent to pay out funds to shareholders. We define three categories: financially constrained firms with no dividend payouts and no share repurchases in the year concerned, firms with either dividend payouts or share repurchases, and financially unconstrained firms with both dividend payouts and share repurchases. For robustness, we also perform the tests using the ratio of payouts to assets, assigning to the financially constrained (unconstrained) group those firms in the bottom (top) three deciles of the annual payout distribution, and find similar results.
Firm-specific variables
We measure cash flow as earnings before interest, dividends, and taxes, plus depreciation, divided by assets. Following Almeida et al. (2004), we hypothesize that financially constrained firms should show positive cash flow sensitivity to cash, while unconstrained firms’ cash savings should not be systematically related to cash flow.
We employ the ratio of net working capital to net assets as a proxy for liquid asset substitutes and predict a negative relation between the firm’s cash holdings and its liquid assets.
We include the ratio of capital expenditures to assets and expect a negative relation with cash holdings.
To control for leverage, we use the ratio of long-term debt plus short-term debt divided by total assets. Since Guney, Ozkan and Ozkan (2007) provide evidence of a significant non-linear relation between cash holdings and leverage, we include the squared leverage ratio. As firms with high leverage are more likely to be financially constrained, they can be expected to increase their cash balances for precautionary motives, and the relation between cash holdings and leverage, which is negative at low levels of leverage, can become positive at high levels. Since financially constrained firms may also use more short-term debt, we include the ratio of short-term debt to total debt.
A growth firm, if faced with a cash shortage, has to give up valuable investments. As a proxy for firms’ growth opportunities we use Tobin’s Q, defined as the ratio of the market value of equity plus the book value of debt to the book value of assets. We include the R&D expense-to-sales ratio as a measure of the potential for financial distress costs and asymmetric information, and expect that firms with higher R&D expenses will hold more cash reserves. Firms that do not report R&D expenses are considered to be firms with no R&D expenses.
Firm size is measured as the logarithm of the book value of assets. We expect a negative relation between cash and size because smaller firms are more financially constrained and face higher external financing costs than larger firms.
Dividend payouts may reduce cash holdings, or alternatively, a firm that pays dividends can raise funds by cutting the dividend and therefore need less cash. We use a dividend dummy, that equals 1 if a firm pays a dividend for a given year and zero otherwise.
We expect firms with greater cash flow variability to hold more cash. We include a dummy that equals one if the firm’s cash flow standard deviation on average cash flow over the period 1998-2002 is greater than the median.
5. Empirical results
5.1. Univariate tests
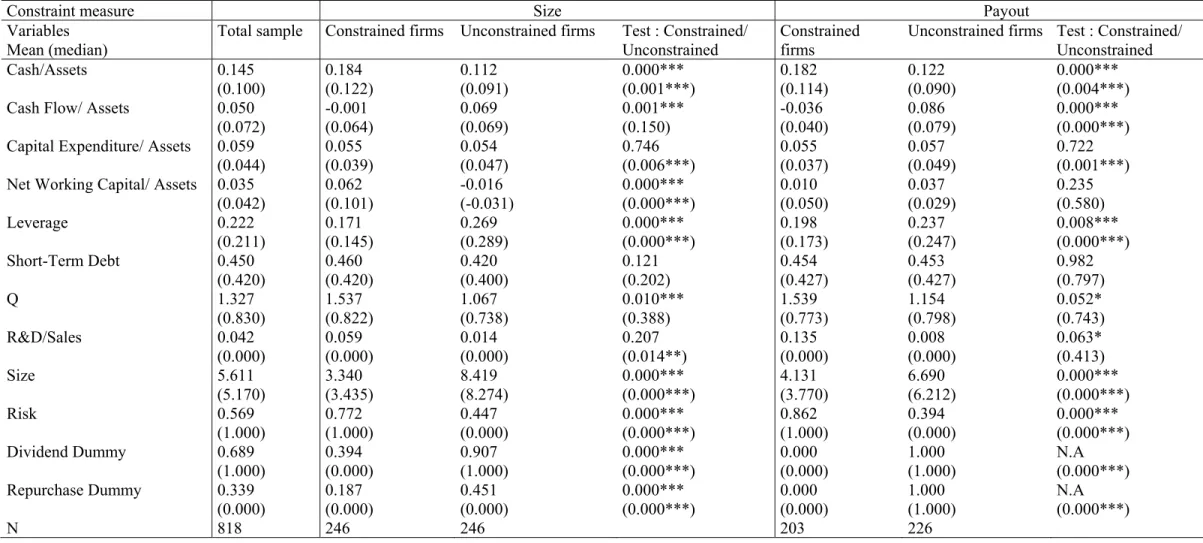
In Table 1, descriptive statistics are reported for the total sample and subsamples of constrained and unconstrained firms, using the two classification criteria, size and payouts to shareholders.
[Insert Table 1 here]
The number of financially constrained firms varies depending on the reference criteria (Table 1, Panel A). Based on the size (payout) criterion, 30% (24.8%) of firms are financially constrained. On average, French firms hold 14.5% of their assets in the form of cash. This percentage is 18.4% (18.2%) for financially constrained firms based on the size (payout) criterion, and 11.2% (12.2%) for unconstrained firms. Financially constrained firms are smaller capitalisation firms, under both criteria, with lower leverage, more growth opportunities and higher risk. They also have a lower cash flow to assets ratio and, based on the size criterion, a higher working capital to assets ratio. This result, which is robust when sector subsamples are considered, may have two explanations. First, the smallest firms are not as good at managing their working capital requirements or are less effective at transforming trade receivables and stocks into liquid assets. Second, they are more likely to come under pressure from customers for longer payment terms and from suppliers for short settlement times.
Financially constrained firms are also different from unconstrained firms in the ownership and governance index (Table 1, panel B). They are more closely-held. Based on the size criterion, the main shareholder of a constrained firm holds 54% (62%) of the capital (voting rights) compared to 36% (42%) in unconstrained firms. The difference between the percentage of capital and the percentage of voting rights is significantly lower for constrained firms. Constrained firms are mostly controlled-firms, with 83% family-controlled, while only 33% of unconstrained firms are family-controlled. Only 12% of constrained firms are widely-held, compared to 41% of unconstrained firms. Finally, only 11% of constrained firms have a financial institution as a shareholder, compared to 32% of unconstrained firms. Thus, family-controlled firms are more often financially constrained, presumably to maintain voting control, so that their options for issuing new shares are limited. Group subsidiaries, in contrast, have
access to intragroup financing and dispersed-ownership firms have ready access to financial market resources, and thus are presumed to be less financially constrained.
The governance index, with an average 1.50, is 1.25 (2.05) for constrained (unconstrained) firms based on the size criterion and 1.24 (1.77) based on the payout criterion. Constrained firms have significantly fewer anti-takeover provisions than unconstrained firms, except for greater use of double voting rights. Since they are more closely-held, they feel less need for defence against a possible buyer. Governance quality, as measured by the index, grows weaker as the firm is more financially unconstrained. This result is not specific to France (Harford et al., 2006 or Gompers et al., 2003).
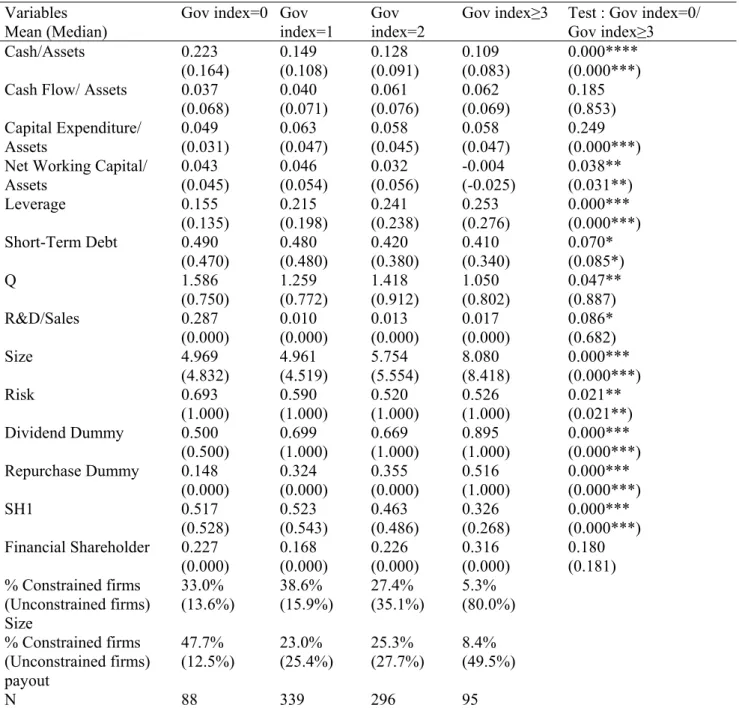
Table 2 shows details of the firms’ financial characteristics by governance index. The fourth group includes firms with a governance index of 3 or 4. Average cash is 22.3% of assets for the group of firms with no anti-takeover provisions, 14.9% (12.8%) for the group of firms that have one (two) protective provisions, and 10.9% for the group of firms with the greatest number of protective provisions. These data show clear differences in terms of financial constraints between the groups, particularly the first and last group. The most protected firms are also the largest, confirming previous observations. Moreover, 50% (14.8%) of firms in the first group pay out a dividend (repurchase shares), compared to 89.5% (51.6%) of firms in the last group. Total leverage increases from 0.155 in the first group to 0.253 in the last group, while the portion of short-term debt decreases. Firms with the most anti-takeover provisions, which are also the largest firms, probably have better access to credit. The average Tobin’s Q declines as the governance index decreases. Finally, the volatility of cash flow is significantly lower for the most protected group of firms, compared to those with a governance index of 0. We also classify firms within each governance group depending on whether they are financially constrained or unconstrained. Based on the size (payout) criterion, 33.0% (47.7%) of firms in the first group are financially constrained, compared to only 5.3% (8.4%) of firms in the last group.
[Insert Table 2 here]
These observations confirm that the cash ratio, but also the degree of financial constraint, decrease as the governance index rises, supporting our hypothesis that the impact of governance on firms’ cash holdings partly results from the fact that they are subject to different financial constraints.
5.2. Governance and financial constraints
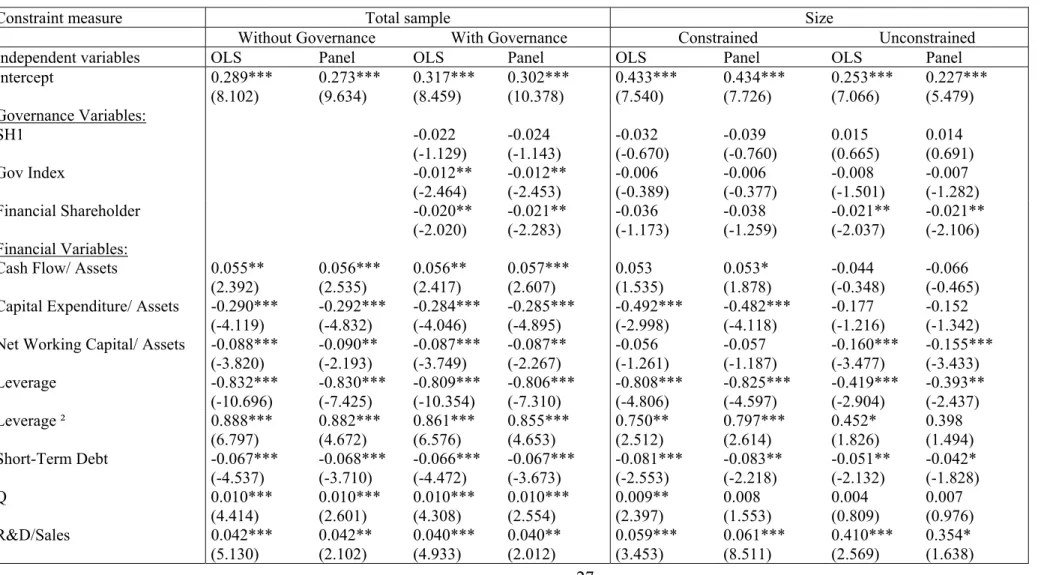
To complement the univariate analysis, we estimate several regression models. Table 3 reports the estimation results from the following regression model, for the full sample and subsamples of size constrained and unconstrained firms.
CASHi,t = α + γ0 gov indexi ,t+ γ1,....,n firm specific variables + γ2 industry dummies + εI,t
(1)
We alternately use OLS regressions and pooled panel regressions6 predicting cash/asset ratios over the period 1998-2002, using the independent variables described earlier (Table 3). The dependent variable is the ratio of cash and marketable securities to assets. Firms are allowed to enter and leave the panel. All models include industry indicators.
[Insert Table 3 here]
The first column of Table 3 reports estimates using OLS regressions with industry and year dummies for the full sample without governance variables. Cash holdings increase significantly with the cash flow to assets ratio, the Tobin’s Q, and the R&D to sales ratio. Cash holdings decrease significantly with the capital expenditure to assets ratio, the net working capital to assets ratio, the dividend dummy and the short-term debt ratio. Similar to Guney et al. (2007), we find a non-linear relation between cash holdings and leverage. Similar results are obtained for the panel regression (column 2, table 3).
Overall, these results are similar to those reported by Opler et al. (1999) and confirm previous findings with the exception of size, which has no significant impact on cash holding.
The next columns of Table 3 add governance variables to these regressions and the previous results are unchanged. The results indicate that there is no evidence of a potential conflict between majority and minority shareholders, given that the percentage of capital held by the largest shareholder has no impact on cash holdings. However, the presence of a financial institution with more than 5% of capital significantly reduces cash levels. This result is robust after controlling for the percentage of shares owned by the main shareholder or the fact that the firm is controlled versus widely-held. Monitoring by a major shareholder also has less of an
effect on the level of cash holdings than the presence of a financial institution shareholder, even when only a small fraction of the capital is held. Thus, the involvement of a bank reduces financial constraints by facilitating both the firms’ access to loans and raising capital on the markets. We find a negative relation between the governance index and firm cash holdings, and therefore a positive relation between the strength of shareholder rights and cash reserves. This result is robust with respect to wether a main shareholder is present, the percentage that the main shareholder owns, and its identity. It is consistent with the findings of Harford et al. (2006) for U.S. firms, and contradicts the prediction by Opler et al. (1999) that firms protected by anti-takeover provisions are likely to hold more cash. Across the full sample, we conclude that poorly controlled managers do not appear to stockpile cash for their own private benefits.
The same regressions are estimated separately for financially constrained firms (the smallest 30%) and financially unconstrained firms (the largest 30%). First, there is a difference in the sensitivity of cash to cash flow. For constrained firms, this sensitivity is positive and significant, while for unconstrained firms it is negative and non-significant. These results are consistent with the findings of Almeida et al. (2006), and confirm that there is a propensity for financially constrained firms to hoard some of their cash flows in the form of cash reserves. Second, the presence of a financial institution shareholder reduces cash in unconstrained firms, but not in constrained firms. Finally, the governance index no longer has any significant influence on cash. These results confirm that the impact of governance quality on the level of firms’ cash holdings is partly explained by the existence of financial constraints, and is not only the result of agency conflicts between managers and shareholders.
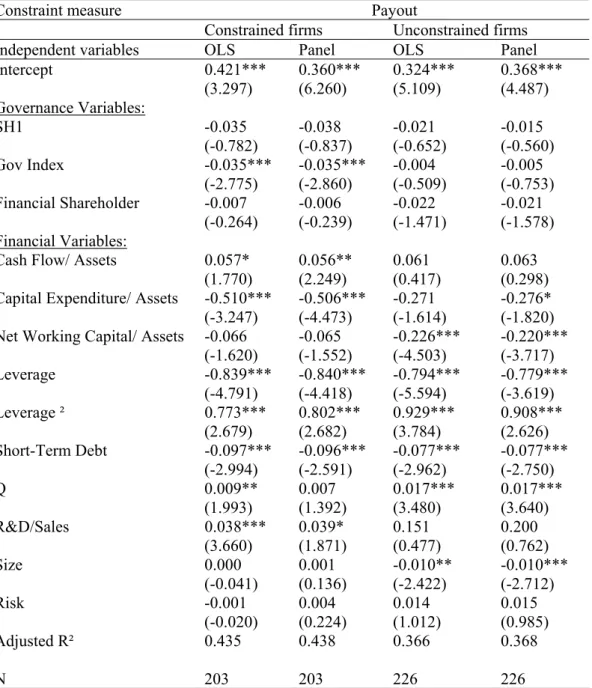
The results of these regressions when financial constraints are measured based on payouts are reported in Table 4. The two definitions of financially constrained firms do not lead to identical subsamples of firms. Constrained firms defined on the basis of the payout criterion differ from constrained firms defined on the basis of the size criterion by having a lower cash flow/assets ratio and a higher net working capital/assets ratio. This group is by construction more heterogeneous in terms of the size of its firms. More specifically, it contains large firms that are unable to pay out dividends because of negative earnings, and growth firms that choose not to pay out dividends. The nature of the financial constraints at these firms is thus likely to be different from the constraints affecting small firms. The results confirm that in the most constrained firms (with no dividend payouts or share repurchases), the level of cash reserves depends on cash flow, that is they are cash flow sensitive. However, in contrast to the results
obtained when size is the measurement criterion for financial constraints, the governance index has a negative influence on the cash holdings of firms with no dividend payouts.
[Insert Table 4 here]
These results establish that governance quality (which is greater when there are few anti-takeover provisions) has no impact on the cash holdings of financially unconstrained firms, and a negative influence on the cash holdings of certain financially constrained firms. This result is not incompatible with the findings of Harford (1999), who establishes a negative relation between the probability of a takeover and cash levels: firms that introduce anti-takeover devices are often potential targets.
5.3. Ownership structure, financial constraints and cash holdings
Althoug the previous results establish that the percentage of shares owned by the main shareholder has no influence on the level of cash holdings, it does affect the degree of monitoring of management and therefore the extent of agency conflicts. Since family firms are predominant in the French market, we conduct further tests of the effect of the type of control of the firm and the main shareholder’s identity. Family firms are likely to face important financial constraints, as their access to capital markets may be limited by their desire to retain voting control. A family firm will hesitate to issue new shares if the controlling family is not in a position to participate in the new issue.
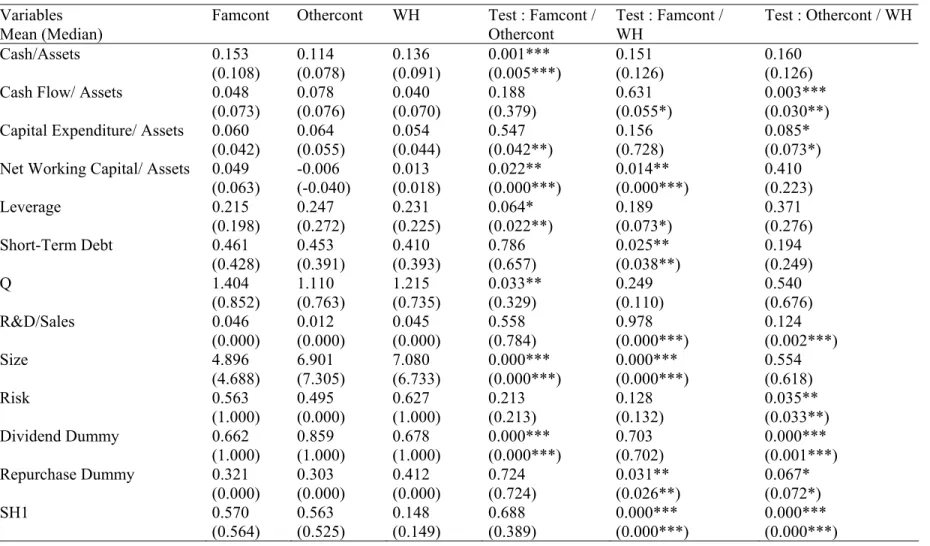
Table 5 shows descriptive statistics by type of ownership: family control, other control, widely-held. The cash/assets ratio is significantly higher for family firms than for other controlled firms and widely-held firms. Family firms are smaller and typically have higher working capital requirements than other firms. On average, the main shareholder owns 57% of the capital and 66% of voting rights. In 15% of family firms there is a financial shareholder, compared to 39% of widely-held firms. The governance index is significantly lower for family firms (1.33) than for non-family firms (1.91 for other controlled firms and 1.81 for widely-held firms), and essentially use double voting rights.
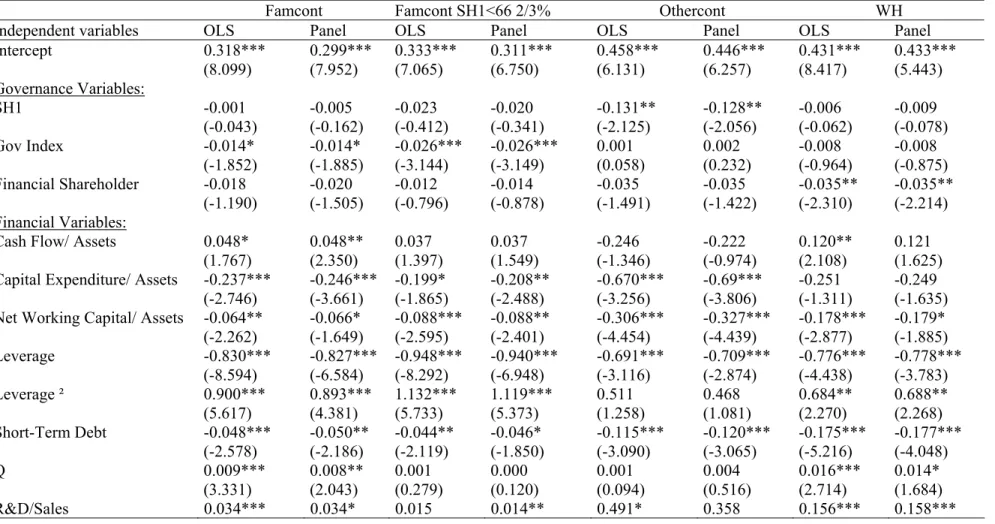
For a clearer assessment of the effect of ownership type on cash and its sensitivity to the governance index, Table 6 presents regressions explaining the level of cash for family-controlled firms, other family-controlled firms and widely-held firms.
[Insert Table 6 here]
Results relating to financial explanatory factors for cash levels are consistent with the previous results. For widely-held firms, paying out dividends reduces cash levels. The negative impact of having a bank shareholder is particularly sharp for widely-held firms.
Non-family controlled firms have the lowest cash holdings. Unlike other firms, they do not increase their cash holdings with rising growth opportunities nor with the level of their cash flow. Some of these firms benefit from intragroup financing and therefore do not have to stockpile cash to seize growth opportunities or avoid costly external financing. For these firms, cash holdings decrease as the main shareholder’s fraction of the capital increases. This finding may be due to centralised cash management in groups, when the firm studied is a closely-held subsidiary.
Finally, the results confirm that the governance index only has an impact on cash for family firms. This effect is particularly significant if we exclude very closely-held firms, for which the risk of loss of control is small or non existent, and focus on family firms whose primary shareholder owns less than 66 2/3% of the capital. It is the degree of shareholder protection against takeovers rather than the percentage of capital owned that has an effect on cash. It is not the discipline exercised by the controlling family that affects cash holdings, particularly as in a family firm, the manager often comes from the controlling block. Instead, cash holdings are influenced by the introduction of provisions that enable firms to issue shares as necessary without the family block running a risk of losing control. For family firms, anti-takeover devices thus represent an alternative source of flexibility to holding large cash reserves.
6. Conclusion
The cash held by firms may result from the need for financial flexibility to undertake profitable investment opportunities as they arise, but also from self-interested managers’ desire to hoard cash for their own private benefits. Previous studies testing this last explanation have produced contradictory results. Within country studies highlight a positive relationship between
governance quality and cash holdings, while cross-country studies, stress a negative one. We reconcile these two results by highlighting the links between financial constraints and shareholder rights. In cross-country studies, firms in developing countries, characterised by severe financial constraints and weak shareholder rights, hold large amounts of cash. We show that within the context of France, managers of the largest firms, which we consider as less financially constrained, introduce anti-takeover provisions, leading to low quality governance. In subsamples of low financial constrained firms, cash holdings are not affected by the governance index. However, governance quality is positively related to cash holdings for some financially constrained firms, particularly those that make no payouts and family firms with limited access to capital markets. The introduction of anti-takeover provisions gives these firms an alternative source of flexibility, enabling them to issue shares without losing control. This acts as a substitute for holding large cash reserves.
References
Almeida, H., Campello, M. and M.S. Weisbach, 2004, The Cash Flow Sensitivity of Cash,
Journal of Finance, 59, 1777- 1804.
Bates T.W., Kahle K. and R. Stulz, 2006, Why do U.S. firms hold so much more cash than they used to?, Working paper, NBER
Beck, T., Demirguc-Kunt, A. and V. Maksimovic, 2004, Financial and Legal Constraints to Growth: Does Firm Size Matter?, Working paper, University of Maryland.
Brown G., and N. Kapadia, 2007, Firm-specific risk and equity market development, Journal of
Financial Economics, forthcoming.
Demirguc-Kunt, A., and V. Maksimovic, 1998, Law, Finance and Firm Growth, Journal of
Finance, 53, 2107-2131.
Dittmar, A., Marth-Smith, J. and H. Servaes, 2003, International corporate governance and corporate cash holdings, Journal of Financial and Quantitative Analysis, 38, 111-133.
Dittmar, A and J. Marth-Smith, 2007, Corporate Governance and the Value of Cash Holdings,
Journal of Financial Economics, forthcoming.
Faccio, M. and L. Lang, 2002, The separation of ownership and control: an analysis of ultimate ownership in western European corporations, Journal of Financial Economics, 65, 365- 395. Faulkender M.W. and R. Wang, 2006, Corporate Financial Policy and the Value of Cash,
Journal of Finance, 64, 1957-1990
Ferreira, M.A. and A. Vilela, 2004, Why do firms hold cash? Evidence from EMU Countries,
European Financial Management, 10, 295-319.
Ginglinger E. and J. Hamon, 2007, Ownership, control and market liquidity, Working paper, University Paris Dauphine.
Gomes, A. and W. Novaes, 2005, Sharing of control versus monitoring as corporate governance mechanisms. Working Paper, ssrn.
Gompers, P., J. Ishii, and A. Metrick, 2003, Corporate governance and equity prices, Quarterly
Journal of Economics, 118, 107-155.
Guney, Y., Ozkan, A. and N. Ozkan, 2007, International Evidence on the Non-linear Impact of Leverage on Corporate Cash Holdings, Journal of Multinational Financial Management, 17, 45-60
Harford, J., 1999, Corporate cash reserves and acquisitions, Journal of Finance, 54, 1969-1997. Harford, J., Mansi S.A. and W.F. Maxwell, 2006, Shareholder rights and corporate cash
holdings, AFA Boston meetings.
Jensen, M. and W. Meckling, 1976, Theory of the firm: managerial behaviour, agency costs and ownership structure, Journal of Financial Economics, 3, 305-360.
Jensen, M. (1986) Agency costs of free cash flow, corporate finance, and takeovers, The
American Economic Review, 76, 323-329.
Kalcheva, I. and K.V. Lins, 2003, International evidence on cash holdings and expected managerial agency problems. Working Paper, ssrn.
Keynes, J.M., 1936, The General Theory of Employment. Interest and Money, London: McMillan.
Kim, C-S., Mauer, D.C. and A.E. Sherman, 1998, The determinants of corporate liquidity: theory and evidence, Journal of Financial and Quantitative Analysis, 33, 335- 359.
Khurana I., Martin X. and R. Pereira, 2006, Financial development and the cash flow sensitivity of cash, Journal of Financial and Quantitative Analysis, 41, 787-807.
Kusnadi, Y., 2005, Corporate governance mechanisms and corporate cash holdings. Working Paper, ssrn.
La Porta, R., Lopez-de-Silanes, F., Shleifer, A. and R.W. Vishny, 1998, Law and finance, The
Journal of Political Economy, 106, 1113- 1155.
Love, I., 2003, Financial Development and Financing Constraints, The Review of Financial
Studies, 16, 765-791.
Mikkelson, W.H. and M.M. Partch, 2003, Do persistent large cash reserves hinder performance?
Journal of Financial and Quantitative Analysis, 38, 275- 294.
Miller, M. and D. Orr, 1966, A Model of the Demand for Money by Firms, Quarterly Journal of
Economics, 80, 413-435.
Myers, S.C., 1977, Determinants of corporate borrowing, Journal of Financial Economics, 5, 147- 175.
Myers, S.C. and N.S. Majluf, 1984, Corporate financing and investment decisions when firms have information that investors do not have, Journal of Financial Economics, 13, 187- 221. Opler, T., Pinkowitz, L., Stulz, R. and R. Williamson, 1999, The determinants and implications
of corporate cash holdings, Journal of Financial Economics, 52, 3-46.
Ozkan, A. and N. Ozkan, 2004, Corporate cash holdings: an empirical investigation of UK companies, Journal of Banking and Finance, 28, 2103-2134.
Pinkowitz, L., Stulz, R. and R. Williamson, 2006, Does the contribution of corporate cash holdings and dividends to firm value depend on governance? A cross-country analysis,
Journal of Finance, 61, 2725 – 2751.
Rajan, R., and L. Zingales, 1998, Financial Dependence and Growth, American Economic
Review, 88, 559-586.
Shleifer, A. and R.W. Vishny, 1986, Large shareholders and corporate control, Journal of
Political Economy, 95, 461- 488.
Shleifer, A. and R.W. Vishny, 1997, A survey of corporate governance, Journal of Finance, 52, 737- 784.
Table 1. Descriptive statistics
Panel A. Description of firm specific variables
This panel provides summary statistics on key variables for our sample of 818 firm-year observations (year-end 1998, 2000, 2002), and subsamples of constrained and unconstrained firms. Constrained firms (Size) are those in the bottom three deciles of the size distribution. Unconstrained firms (Size) are those in the top three deciles of the size distribution. Constrained firms (Payout) neither pay dividends nor repurchase their shares. Unconstrained firms (Payout) pay dividends and repurchase their shares. Cash/Assets is the ratio of cash and equivalents to total assets. Cash flow is earnings before interest & taxes plus depreciation & amortization. Net Working Capital is working capital minus cash and equivalents. Leverage is total debt over total assets. Short-term debt is the ratio of short- term debt to total debt. Q is measured as the market value of equity plus the book value of debt, divided by the book value of assets. R&D/Sales is the R&D expenses to sales ratio. Size is defined as the natural logarithm of total assets. Risk is a dummy that equals 1 if Cash flow volatility is greater than the sample median, where Cash flow volatility represents cash flow standard deviation over the period 1998-2002. Dividend Dummy equals 1 if the firm pays dividends during a given year. Repurchase Dummy equals 1 if the firm repurchases its shares during a given year. N is the number of firm-year observations. P-values are reported for the test for equality of means (Student test), and the test for equality of medians (Wilcoxon test). ***, **, * indicates significance at the 1%, 5% and 10% level, respectively..
Constraint measure Size Payout
Variables Mean (median)
Total sample Constrained firms Unconstrained firms Test : Constrained/ Unconstrained
Constrained firms
Unconstrained firms Test : Constrained/ Unconstrained Cash/Assets 0.145 (0.100) 0.184 (0.122) 0.112 (0.091) 0.000*** (0.001***) 0.182 (0.114) 0.122 (0.090) 0.000*** (0.004***)
Cash Flow/ Assets 0.050
(0.072) -0.001 (0.064) 0.069 (0.069) 0.001*** (0.150) -0.036 (0.040) 0.086 (0.079) 0.000*** (0.000***) Capital Expenditure/ Assets 0.059
(0.044) 0.055 (0.039) 0.054 (0.047) 0.746 (0.006***) 0.055 (0.037) 0.057 (0.049) 0.722 (0.001***) Net Working Capital/ Assets 0.035
(0.042) 0.062 (0.101) -0.016 (-0.031) 0.000*** (0.000***) 0.010 (0.050) 0.037 (0.029) 0.235 (0.580) Leverage 0.222 (0.211) 0.171 (0.145) 0.269 (0.289) 0.000*** (0.000***) 0.198 (0.173) 0.237 (0.247) 0.008*** (0.000***) Short-Term Debt 0.450 (0.420) 0.460 (0.420) 0.420 (0.400) 0.121 (0.202) 0.454 (0.427) 0.453 (0.427) 0.982 (0.797) Q 1.327 (0.830) 1.537 (0.822) 1.067 (0.738) 0.010*** (0.388) 1.539 (0.773) 1.154 (0.798) 0.052* (0.743) R&D/Sales 0.042 (0.000) 0.059 (0.000) 0.014 (0.000) 0.207 (0.014**) 0.135 (0.000) 0.008 (0.000) 0.063* (0.413) Size 5.611 (5.170) 3.340 (3.435) 8.419 (8.274) 0.000*** (0.000***) 4.131 (3.770) 6.690 (6.212) 0.000*** (0.000***) Risk 0.569 (1.000) 0.772 (1.000) 0.447 (0.000) 0.000*** (0.000***) 0.862 (1.000) 0.394 (0.000) 0.000*** (0.000***) Dividend Dummy 0.689 (1.000) 0.394 (0.000) 0.907 (1.000) 0.000*** (0.000***) 0.000 (0.000) 1.000 (1.000) N.A (0.000***) Repurchase Dummy 0.339 (0.000) 0.187 (0.000) 0.451 (0.000) 0.000*** (0.000***) 0.000 (0.000) 1.000 (1.000) N.A (0.000***) N 818 246 246 203 226
Panel B. Ownership and governance variables
This panel provides summary statistics of ownership and governance variables for our sample of 818 firm-year observations (year-end 1998, 2000, 2002), and subsamples of constrained and unconstrained firms. Constrained firms (Size) are those in the bottom three deciles of the size distribution. Unconstrained firms (Size) are those in the top three deciles of the size distribution. Constrained firms (Payout) neither pay dividends nor repurchase their shares. Unconstrained firms (Payout) pay dividends and repurchase their shares. SH1 is the percentage of capital held by the main shareholder. VRSH1 is the percentage of voting rights held by the main shareholder. (VRSH1–SH1)/SH1 measures the discrepancy between cash flow and control rights. WH is the percentage of widely held firms. Famcont is the percentage of family controlled firms (in which the main shareholder is an individual or a group of individuals). Othercont is the percentage of firms controlled by a non-family shareholder. Financial shareholder is a dummy that equals 1 if a bank or an insurance company holds more than 5% of the capital. Gov Index is the index measuring the number of anti-takeover provisions adopted by the firm. Dual Class Shares, Pyramid, Limited Partnership, Double Voting Rights, Voting Caps, Voting Thresholds are dummies that equal 1 if the firm uses that provision. N is the number of firm-year observations. P-values are reported for the test for equality of means (Student test), and the test for equality of medians (Wilcoxon test). ***, **, * indicates significance at the 1%, 5% and 10% level, respectively.
Constraint measure Size Payout
Variables Mean (median)
Total sample Constrained firms Unconstrained firms
Test : Constrained/ Unconstrained
Constrained firms Unconstrained firms Test : Constrained/ Unconstrained SH1 0.48 (0.51) 0.54 (0.57) 0.36 (0.38) 0.000*** (0.000***) 0.50 (0.53) 0.45 (0.49) 0.039** (0.048**) VRSH1 0.55 (0.60) 0.62 (0.66) 0.42 (0.40) 0.000*** (0.000***) 0.56 (0.61) 0.54 (0.61) 0.388 (0.393) (VRSH1 – SH1)/SH1 0.18 (0.15) 0.16 (0.14) 0.23 (0.19) 0.000*** (0.014**) 0.14 (0.09) 0.23 (0.22) 0.000*** (0.000***) WH 0.22 (0.00) 0.12 (0.00) 0.41 (0.00) 0.000*** (0.000***) 0.21 (0.00) 0.26 (0.00) 0.231 (0.232) Famcont 0.66 (1.00) 0.83 (1.00) 0.33 (0.00) 0.000*** (0.000***) 0.72 (1.00) 0.61 (1.00) 0.012** (0.013**) Othercont 0.12 (0.00) 0.05 (0.00) 0.25 (0.00) 0.000*** (0.000***) 0.06 (0.00) 0.13 (0.00) 0.023** (0.025**) Financial Shareholder 0.21 (0.00) 0.11 (0.00) 0.32 (0.00) 0.000*** (0.000***) 0.20 (0.00) 0.26 (0.00) 0.179 (0.180) Gov Index 1.50 (1.00) 1.25 (1.00) 2.05 (2.00) 0.000*** (0.000***) 1.24 (1.00) 1.77 (2.00) 0.000*** (0.000***)
Dual Class Shares 0.02
(0.00) 0.00 (0.00) 0.05 (0.00) 0.000*** (0.000***) 0.00 (0.00) 0.03 (0.00) 0.014** (0.020**) Pyramid 0.22 (0.00) 0.11 (0.00) 0.43 (0.00) 0.000*** (0.000***) 0.14 (0.00) 0.26 (0.00) 0.001*** (0.002***) Limited Partnership 0.03 (0.00) 0.00 (0.00) 0.05 (0.00) 0.000*** (0.000***) 0.01 (0.00) 0.02 (0.00) 0.812 (0.812) Double Voting Rights 0.76
(1.00) 0.80 (1.00) 0.72 (1.00) 0.046** (0.046**) 0.67 (1.00) 0.88 (1.00) 0.000*** (0.000***) Voting Caps 0.03 0.00 0.10 0.000*** 0.00 0.06 0.000***
(0.00) (0.00) (0.00) (0.000***) (0.00) (0.00) (0.000***) Voting Thresholds 0.45 (0.00) 0.34 (0.00) 0.69 (1.00) 0.000*** (0.000***) 0.42 (0.00) 0.53 (1.00) 0.033** (0.033**) N 818 246 246 203 226
Table 2. Financial characteristics and governance index
This table provides summary statistics on key variables for subsamples of firms defined according to their governance index (year-end 1998, 2000, 2002). Gov Index is the index measuring the number of anti-takeover provisions adopted by the firm. Cash/Assets is the ratio of cash and equivalents to total assets. Cash flow is earnings before interest & taxes plus depreciation & amortization. Net Working Capital is working capital minus cash and equivalents. Leverage is total debt over total assets. Short-term debt is the ratio of short-term debt to total debt. Q is measured as the market value of equity plus the book value of debt, divided by the book value of assets. R&D/Sales is the R&D expenses to sales ratio. Size is defined as the natural logarithm of total assets. Risk is a dummy that equals 1 if Cash flow volatility is greater than the sample median, where Cash flow volatility represents cash flow standard deviation over the period 1998-2002. Dividend dummy equals 1 if the firm pays dividends. Repurchase Dummy equals 1 if the firm repurchases its shares. SH1 is the percentage of capital held by the main shareholder. Financial shareholder is a dummy that equals 1 if a bank or an insurance company holds more than 5% of the capital. N is the number of firm-year observations. P-values are reported for the test for equality of means (Student test), and the test for equality of medians (Wilcoxon test). ***, **, * indicates significance at the 1%, 5% and 10% level, respectively.
Variables Mean (Median)
Gov index=0 Gov index=1
Gov index=2
Gov index≥3 Test : Gov index=0/ Gov index≥3 Cash/Assets 0.223 (0.164) 0.149 (0.108) 0.128 (0.091) 0.109 (0.083) 0.000**** (0.000***) Cash Flow/ Assets 0.037
(0.068) 0.040 (0.071) 0.061 (0.076) 0.062 (0.069) 0.185 (0.853) Capital Expenditure/ Assets 0.049 (0.031) 0.063 (0.047) 0.058 (0.045) 0.058 (0.047) 0.249 (0.000***) Net Working Capital/
Assets 0.043 (0.045) 0.046 (0.054) 0.032 (0.056) -0.004 (-0.025) 0.038** (0.031**) Leverage 0.155 (0.135) 0.215 (0.198) 0.241 (0.238) 0.253 (0.276) 0.000*** (0.000***) Short-Term Debt 0.490 (0.470) 0.480 (0.480) 0.420 (0.380) 0.410 (0.340) 0.070* (0.085*) Q 1.586 (0.750) 1.259 (0.772) 1.418 (0.912) 1.050 (0.802) 0.047** (0.887) R&D/Sales 0.287 (0.000) 0.010 (0.000) 0.013 (0.000) 0.017 (0.000) 0.086* (0.682) Size 4.969 (4.832) 4.961 (4.519) 5.754 (5.554) 8.080 (8.418) 0.000*** (0.000***) Risk 0.693 (1.000) 0.590 (1.000) 0.520 (1.000) 0.526 (1.000) 0.021** (0.021**) Dividend Dummy 0.500 (0.500) 0.699 (1.000) 0.669 (1.000) 0.895 (1.000) 0.000*** (0.000***) Repurchase Dummy 0.148 (0.000) 0.324 (0.000) 0.355 (0.000) 0.516 (1.000) 0.000*** (0.000***) SH1 0.517 (0.528) 0.523 (0.543) 0.463 (0.486) 0.326 (0.268) 0.000*** (0.000***) Financial Shareholder 0.227 (0.000) 0.168 (0.000) 0.226 (0.000) 0.316 (0.000) 0.180 (0.181) % Constrained firms (Unconstrained firms) Size 33.0% (13.6%) 38.6% (15.9%) 27.4% (35.1%) 5.3% (80.0%) % Constrained firms (Unconstrained firms) payout 47.7% (12.5%) 23.0% (25.4%) 25.3% (27.7%) 8.4% (49.5%) N 88 339 296 95
Table 3. Governance and financial constraints
This table reports the estimated coefficients from regressing cash holdings on governance variables and various control variables for the total sample and subsamples of constrained and unconstrained firms (year-end 1998, 2000, 2002). Constrained firms (Size) are those in the bottom three deciles of the size distribution. Unconstrained firms (Size) are those in the top three deciles of the size distribution. The dependent variable in all models is the ratio of cash and equivalents to total assets. SH1 is the percentage of capital held by the main shareholder. Gov Index is the index measuring the number of anti-takeover provisions adopted by the firm. Financial shareholder is a dummy that equals 1 if a bank or an insurance company holds more than 5% of the capital. Cash flow is earnings before interest & taxes plus depreciation & amortization. Net Working Capital is working capital minus cash and equivalents. Leverage is total debt over total assets. Leverage² is the squared leverage ratio. Short-term debt is the ratio of short-term debt to total debt. Q is measured as the market value of equity plus the book value of debt, divided by the book value of assets. R&D/Sales is the R&D expenses to sales ratio. Size is defined as the natural logarithm of total assets. Dividend Dummy equals 1 if the firm pays dividends. Risk is a dummy that equals 1 if Cash flow volatility is greater than the sample median, where Cash flow volatility represents cash flow standard deviation over the period 1998-2002. All models include industry indicators. OLS regressions also include year indicators. N is the number of firm-year observations. All t-statistics are corrected for heteroskedasticity using White’s (1980) correction and are in parentheses. ***, **, * indicates significance at the 1%, 5% and 10% level, respectively.
Constraint measure Total sample Size
Without Governance With Governance Constrained Unconstrained
Independent variables OLS Panel OLS Panel OLS Panel OLS Panel
Intercept 0.289*** (8.102) 0.273*** (9.634) 0.317*** (8.459) 0.302*** (10.378) 0.433*** (7.540) 0.434*** (7.726) 0.253*** (7.066) 0.227*** (5.479) Governance Variables: SH1 -0.022 (-1.129) -0.024 (-1.143) -0.032 (-0.670) -0.039 (-0.760) 0.015 (0.665) 0.014 (0.691) Gov Index -0.012** (-2.464) -0.012** (-2.453) -0.006 (-0.389) -0.006 (-0.377) -0.008 (-1.501) -0.007 (-1.282) Financial Shareholder -0.020** (-2.020) -0.021** (-2.283) -0.036 (-1.173) -0.038 (-1.259) -0.021** (-2.037) -0.021** (-2.106) Financial Variables:
Cash Flow/ Assets 0.055**
(2.392) 0.056*** (2.535) 0.056** (2.417) 0.057*** (2.607) 0.053 (1.535) 0.053* (1.878) -0.044 (-0.348) -0.066 (-0.465) Capital Expenditure/ Assets -0.290***
(-4.119) -0.292*** (-4.832) -0.284*** (-4.046) -0.285*** (-4.895) -0.492*** (-2.998) -0.482*** (-4.118) -0.177 (-1.216) -0.152 (-1.342) Net Working Capital/ Assets -0.088***
(-3.820) -0.090** (-2.193) -0.087*** (-3.749) -0.087** (-2.267) -0.056 (-1.261) -0.057 (-1.187) -0.160*** (-3.477) -0.155*** (-3.433) Leverage -0.832*** (-10.696) -0.830*** (-7.425) -0.809*** (-10.354) -0.806*** (-7.310) -0.808*** (-4.806) -0.825*** (-4.597) -0.419*** (-2.904) -0.393** (-2.437) Leverage ² 0.888*** (6.797) 0.882*** (4.672) 0.861*** (6.576) 0.855*** (4.653) 0.750** (2.512) 0.797*** (2.614) 0.452* (1.826) 0.398 (1.494) Short-Term Debt -0.067*** (-4.537) -0.068*** (-3.710) -0.066*** (-4.472) -0.067*** (-3.673) -0.081*** (-2.553) -0.083** (-2.218) -0.051** (-2.132) -0.042* (-1.828) Q 0.010*** (4.414) 0.010*** (2.601) 0.010*** (4.308) 0.010*** (2.554) 0.009** (2.397) 0.008 (1.553) 0.004 (0.809) 0.007 (0.976) R&D/Sales 0.042*** 0.042** 0.040*** 0.040** 0.059*** 0.061*** 0.410*** 0.354*
Size -0.001 (-0.569) -0.001 (-0.569) 0.000 (0.047) 0.000 (0.120) Dividend Dummy -0.023** (-2.277) -0.020** (-2.006) -0.022** (-2.185) -0.020* (-1.934) -0.036 (-1.582) -0.033* (-1.684) 0.002 (0.119) -0.001 (-0.040) Risk -0.001 (-0.121) -0.001 (-0.152) -0.002 (-0.271) -0.003 (-0.334) -0.013 (-0.489) -0.010 (-0.555) -0.024** (-2.324) -0.024** (-2.160) Adjusted R² 0.361 0.359 0.366 0.365 0.343 0.342 0.284 0.271 N 818 818 818 818 246 246 246 246
Table 4. Governance and financial constraints defined by payout policy
This table reports the estimated coefficients from regressing cash holdings on governance variables and various control variables for subsamples of constrained and unconstrained firms (year-end 1998, 2000, 2002). Constrained firms (Payout) neither pay dividends nor repurchase their shares. Unconstrained firms (Payout) pay dividends and repurchase their shares. The dependent variable in all models is the ratio of cash and equivalents to total assets. SH1 is the percentage of capital held by the main shareholder. Gov Index is the index measuring the number of anti-takeover provisions adopted by the firm. Financial shareholder is a dummy that equals 1 if a bank or an insurance company holds more than 5% of the capital. Cash flow is earnings before interest & taxes plus depreciation & amortization. Net Working Capital is working capital minus cash and equivalents. Leverage is total debt over total assets. Leverage² is the squared leverage ratio. Short-term debt is the ratio of short-term debt to total debt. Q is measured as the market value of equity plus the book value of debt, divided by the book value of assets. R&D/Sales is the R&D expenses to sales ratio. Size is defined as the natural logarithm of total assets. Dividend Dummy equals 1 if the firm pays dividends. Risk is a dummy that equals 1 if Cash flow volatility is greater than the sample median, where Cash flow volatility represents cash flow standard deviation over the period 1998-2002 All models include industry indicators. OLS regressions also include year indicators. N is the number of firm-year observations. All t-statistics are corrected for heteroskedasticity using White’s (1980) correction and are in parentheses. ***, **, * indicates significance at the 1%, 5% and 10% level, respectively.
Constraint measure Payout
Constrained firms Unconstrained firms Independent variables OLS Panel OLS Panel Intercept 0.421*** (3.297) 0.360*** (6.260) 0.324*** (5.109) 0.368*** (4.487) Governance Variables: SH1 -0.035 (-0.782) -0.038 (-0.837) -0.021 (-0.652) -0.015 (-0.560) Gov Index -0.035*** (-2.775) -0.035*** (-2.860) -0.004 (-0.509) -0.005 (-0.753) Financial Shareholder -0.007 (-0.264) -0.006 (-0.239) -0.022 (-1.471) -0.021 (-1.578) Financial Variables:
Cash Flow/ Assets 0.057* (1.770) 0.056** (2.249) 0.061 (0.417) 0.063 (0.298) Capital Expenditure/ Assets -0.510***
(-3.247) -0.506*** (-4.473) -0.271 (-1.614) -0.276* (-1.820) Net Working Capital/ Assets -0.066
(-1.620) -0.065 (-1.552) -0.226*** (-4.503) -0.220*** (-3.717) Leverage -0.839*** (-4.791) -0.840*** (-4.418) -0.794*** (-5.594) -0.779*** (-3.619) Leverage ² 0.773*** (2.679) 0.802*** (2.682) 0.929*** (3.784) 0.908*** (2.626) Short-Term Debt -0.097*** (-2.994) -0.096*** (-2.591) -0.077*** (-2.962) -0.077*** (-2.750) Q 0.009** (1.993) 0.007 (1.392) 0.017*** (3.480) 0.017*** (3.640) R&D/Sales 0.038*** (3.660) 0.039* (1.871) 0.151 (0.477) 0.200 (0.762) Size 0.000 (-0.041) 0.001 (0.136) -0.010** (-2.422) -0.010*** (-2.712) Risk -0.001 (-0.020) 0.004 (0.224) 0.014 (1.012) 0.015 (0.985) Adjusted R² 0.435 0.438 0.366 0.368 N 203 203 226 226
Table 5. Cash holdings and ownership structure
This table provides summary statistics on key variables, ownership and governance variables for subsamples by control type (year-end 1998, 2000, 2002). Famcont are family controlled firms (in which the main shareholder is an individual or a group of individuals). Othercont are firms controlled by non-family shareholders. WH are widely held firms. Cash/Assets is the ratio of cash and equivalents to total assets. Cash flow is earnings before interest & taxes plus depreciation & amortization. Net Working Capital is working capital minus cash and equivalents. Leverage is total debt over total assets. Short-term debt is the ratio of short-term debt to total debt. Q is measured as the market value of equity plus the book value of debt, divided by the book value of assets. R&D/Sales is the R&D expenses to sales ratio. Size is defined as the natural logarithm of total assets. Risk is a dummy that equals 1 if Cash flow volatility is greater than the sample median, where Cash flow volatility represents cash flow standard deviation over the period 1998-2002. Dividend Dummy equals 1 if the firm pay dividends. Repurchase Dummy equals 1 if the firm repurchases its shares. SH1 is the percentage of capital held by the main shareholder. VRSH1 is the percentage of voting rights held by the main shareholder. (VRSH1–SH1)/SH1 measures the discrepancy between cash flow and control rights. Financial shareholder is a dummy that equals 1 if a bank or an insurance company holds more than 5% of the capital. Gov Index is the index measuring the number of anti-takeover provisions adopted by the firm. Dual Class Shares, Pyramid, Limited Partnership, Double Voting Rights, Voting Caps, Voting Thresholds are dummies that equal 1 if the provision is present. All models include industry indicators. OLS regressions include also year indicators. N is the number of firm-year observations. P-values are reported for the test for equality of means (Student test), and the test for equality of medians (Wilcoxon test). ***, **, * indicates significance at the 1%, 5% and 10% level, respectively.
Variables Mean (Median)
Famcont Othercont WH Test : Famcont /
Othercont Test : Famcont / WH Test : Othercont / WH Cash/Assets 0.153 (0.108) 0.114 (0.078) 0.136 (0.091) 0.001*** (0.005***) 0.151 (0.126) 0.160 (0.126)
Cash Flow/ Assets 0.048
(0.073) 0.078 (0.076) 0.040 (0.070) 0.188 (0.379) 0.631 (0.055*) 0.003*** (0.030**) Capital Expenditure/ Assets 0.060
(0.042) 0.064 (0.055) 0.054 (0.044) 0.547 (0.042**) 0.156 (0.728) 0.085* (0.073*) Net Working Capital/ Assets 0.049
(0.063) -0.006 (-0.040) 0.013 (0.018) 0.022** (0.000***) 0.014** (0.000***) 0.410 (0.223) Leverage 0.215 (0.198) 0.247 (0.272) 0.231 (0.225) 0.064* (0.022**) 0.189 (0.073*) 0.371 (0.276) Short-Term Debt 0.461 (0.428) 0.453 (0.391) 0.410 (0.393) 0.786 (0.657) 0.025** (0.038**) 0.194 (0.249) Q 1.404 (0.852) 1.110 (0.763) 1.215 (0.735) 0.033** (0.329) 0.249 (0.110) 0.540 (0.676) R&D/Sales 0.046 (0.000) 0.012 (0.000) 0.045 (0.000) 0.558 (0.784) 0.978 (0.000***) 0.124 (0.002***) Size 4.896 (4.688) 6.901 (7.305) 7.080 (6.733) 0.000*** (0.000***) 0.000*** (0.000***) 0.554 (0.618) Risk 0.563 (1.000) 0.495 (0.000) 0.627 (1.000) 0.213 (0.213) 0.128 (0.132) 0.035** (0.033**) Dividend Dummy 0.662 (1.000) 0.859 (1.000) 0.678 (1.000) 0.000*** (0.000***) 0.703 (0.702) 0.000*** (0.001***) Repurchase Dummy 0.321 (0.000) 0.303 (0.000) 0.412 (0.000) 0.724 (0.724) 0.031** (0.026**) 0.067* (0.072*) SH1 0.570 (0.564) 0.563 (0.525) 0.148 (0.149) 0.688 (0.389) 0.000*** (0.000***) 0.000*** (0.000***)
VRSH1 0.661 (0.672) 0.615 (0.614) 0.174 (0.173) 0.007*** (0.004***) 0.000*** (0.000***) 0.000*** (0.000***) (VRSH1 – SH1)/SH1 0.184 (0.172) 0.108 (0.043) 0.228 (0.051) 0.000*** (0.000***) 0.051* (0.231) 0.000*** (0.070*) Financial Shareholder 0.148 (0.000) 0.253 (0.000) 0.390 (0.000) 0.026** (0.010***) 0.000*** (0.000***) 0.017** (0.021**) Gov Index 1.332 (1.000) 1.909 (2.000) 1.808 (2.000) 0.000*** (0.000***) 0.000*** (0.000***) 0.438 (0.492)
Dual Class Shares 0.015
(0.000) 0.061 (0.000) 0.000 (0.000) 0.066* (0.004***) 0.005*** (0.104) 0.014** (0.001***) Pyramid 0.094 (0.000) 0.697 (1.000) 0.316 (0.000) 0.000*** (0.000***) 0.000*** (0.000***) 0.000*** (0.000***) Limited Partnership 0.004 (0.000) 0.020 (0.000) 0.096 (0.000) 0.256 (0.055*) 0.000*** (0.000***) 0.004*** (0.017**)
Double Voting Rights 0.843
(1.000) 0.566 (1.000) 0.633 (1.000) 0.000*** (0.000***) 0.000*** (0.000***) 0.279 (0.274) Voting Caps 0.002 (0.000) 0.000 (0.000) 0.136 (0.000) 0.669 (0.669) 0.000*** (0.000***) 0.000*** (0.000***) Voting Thresholds 0.375 (0.000) 0.556 (1.000) 0.621 (1.000) 0.001*** (0.001***) 0.000*** (0.000***) 0.290 (0.285) N 542 99 177