HAL Id: hal-01007535
https://hal.archives-ouvertes.fr/hal-01007535
Submitted on 13 Aug 2020HAL is a multi-disciplinary open access archive for the deposit and dissemination of sci-entific research documents, whether they are pub-lished or not. The documents may come from teaching and research institutions in France or abroad, or from public or private research centers.
L’archive ouverte pluridisciplinaire HAL, est destinée au dépôt et à la diffusion de documents scientifiques de niveau recherche, publiés ou non, émanant des établissements d’enseignement et de recherche français ou étrangers, des laboratoires publics ou privés.
Prediction and analytical description of single laser
tracks geometry. Characterization and analysis of 316L
stainless steel microstructure
Hussam El Cheikh, Bruno Courant
To cite this version:
Hussam El Cheikh, Bruno Courant. Prediction and analytical description of single laser tracks ge-ometry. Characterization and analysis of 316L stainless steel microstructure. Laser Technology, Applications and Future Prospects (Lasers and Electro-Optics Research and Technology), 2013. �hal-01007535�
D
ESCRIPTION OF
S
INGLE
L
ASER
T
RACKS
G
EOMETRY
.
C
HARACTERIZATION
AND
A
NALYSIS OF
316L
S
TAINLESS
S
TEEL
M
ICROSTRUCTURE
Hussam El Cheikh and Bruno Courant
LUNAM Université, Université de Nantes, Ecole Centrale Nantes,Institut de recherche en Génie Civil et Mécanique (GeM)
(UMR CNRS 6183) Equipe Etat Mécanique et Microstructure (EMM), CRTT Saint-Nazaire cedex, France
A
BSTRACTDirect Laser Fabrication (DLF) is a process making possible the manufacture of functional parts directly from a command file injecting powder in a laser beam. The powder melting and solidification processes lead to the fabrication of this part layer by layer. In this study, deposition of 316L stainless steel powder on a steel substrate is carried out using a 700W fiber laser. Three values of each processing parameters (laser power P, scanning speed V and powder mass flow Qm) are fixed and so 27 different
experiments have been made and analyzed. The layer geometry is an important process characteristic and its mastery is essential to control the final part fabrication. Analytical relationships between the laser tracks geometrical characteristics (width, height, area, penetration depth) and the processing parameters are established. The proposed analytical relationships look like
y
a
0
P
1Q
2V
3
b
0m
where y is one of these geometrical characteristics.
Two kinds of models are explored to predict the clad geometrical form and characteristics. The first one is an analytical model in which the powder distribution in the feed jet is supposed to govern the laser clad geometry. It is then proved that the powder distribution in the jet can’t determinate the final clad geometry. In the second one the general form of the clad cross section is supposed to be a disk due to the surface tension forces. Analytical relationships are established between the radius and the disk
Hussam El Cheikh and Bruno Courant 2
centre on one hand and the process parameters on the other hand. Comparisons between experimental observations and simulated geometries are very convincing.
Thermal study is carried out using the one source point method and the so called Green functions. The microstructure is experimentally observed, analyzed and explained with the thermal modelling through the solidification front velocity and the temperature gradients calculations.
N
OMENCLATURE P Laser power (W)Qm Powder mass flow (g/s) V Laser velocity (m/s) H Laser clad height (m) W Laser clad width (m)
Hf Molten pool depth in the substrate (m)
S Cross section area of the molten pool above the substrate (m2)
Sf Cross section area of the molten pool in the substrate (m2) R Virtual disk radius (m)
Pe Powder efficiency ρ Density (kg/m3)
Ql Absorbed laser energy in unit time [J/s]
Qc Heat flow crossing the molten zone toward the substrate [J/s] Abs Absorption
G (x,y,z) Green function T (x,y,z) Temperature
Tm Molten temperature (K) T0 Initial Temperature (K)
t Time(s)
α Diffusivity (m2/s)
d Diameter of the spherical molten zone (m) k Conductivity [W/(m.K)]
A Interface area between the molten pool and the substrate (m2) rp Powder jet stream Radius [m]
L Distance between the nozzle and the substrate surface [m] l Distance from the nozzle and the powder jet focus plan [m]
a0,b0,α1,α2,α3 Regression parameters
I.
I
NTRODUCTIONI.1. Start with Laser Manufacturing
Since the discovery of the laser [Maiman, 1960], scientists have continued to develop its applications. The laser is playing an increasingly important role in our daily lives and in the industrial world. The progress made on the quality of lasers, their power and reliability, range
of applications continues to grow in the industrial field. It extends from the medical field with eye surgery or skin treatment laser until the industry with the marking, cutting and welding. Direct laser fabrication is a field of application of high power lasers issue from rapid prototyping. One or more materials, in powder form, are injected into a laser beam, to be melted and deposit after solidification to form a clad. Layer upon layer, it is possible to manufacture parts mono-or multi-material pieces. Metal pieces in 3D complex form can be realized. This new way of making objects, called additive manufacturing, could, according to some, become the preferred manufacturing technique and unavoidable in the future as it frees the imagination of designers, eases logistics and new achievements cannot be achieved using the conventional means. Already established in the automotive and aerospace manufacturing methods additive conquer space, art and jewellery. Meanwhile, many scientific studies are conducted worldwide to optimize the performance of this new process, especially the geometric accuracy and surface quality of parts produced. The main advantage of the technique is the absence of moulds and tools in the parts development, and the ability to quickly produce prototypes or functional parts of complex geometries.
The idea of introducing the laser in the world of manufacturing began with William M. Steen and V. M. Weerasinghe [Weerasinghe et Steen, 1983]. The first work has been done at Sandia National laboratory (Light Engineered Net Shaping (LENS)) and at Los Alamos Laboratory (Direct Light Fabrication (DLF)) by [Mazumder et Singh, 1986], [Mazumder et Kar, 1987]. Thin layers of metal are melted and deposit successively. They showed that a 3D object can be achieved directly from a database type CAD with properties equivalent or better to those obtained with other methods. In the following years several studies have started in the manufacturing of direct laser deposition based on laser cladding technique. In 1987 C.F. Marsden studied the absorption of the laser power during the deposition of a coating [Marsden et al., 1987], and in 1990, he studied the interaction of the powder with the laser [Marsden and al., 1990]. In 1991, [Hoadley et al., 1991] describe by physical models, the individual influence of each process parameter on the clad characterization. In 1992 [Hoadley et Rappaz, 1992] developed a 2D model of the transfer heat to aid the powder mixes quickly and uniformly in the molten zone.
Technologies issues from rapid prototyping provide innovative solutions for the production of parts (reducing the time and new features). Rapid production from laser fusion of metal powder targets a market of complex shape, small size, high value and produced in small series. The market for additive fabrication becomes important and is currently growing: 24.1% increase in revenue related to the additive manufacturing in 2010 according to Wohlers report 2011.
I.2. Direct Laser Fabrication Process with Powder Projection
Direct Laser Fabrication (DLF) is a method for manufacturing parts with single or multi-materials directly from powders injected into the beam and without the presence of a binder. As shown in Figure 1, the powder melts and is deposited on the workpiece. The formed clad height varies from 0.1 to 2 mm, depending on the laser power, the material type and the amount of powder sent per unit length. The accumulation layer by layer allows the manufacture of the part.
Hussam El Cheikh and Bruno Courant 4
The manufacturing machine used consists of a coaxial nozzle in relative motion with respect to a moving table on which is placed the substrate to initiate the manufacture of the piece. This machine can perform movements following five degrees of freedom for the realization of 3D parts with complex geometries that are not achievable without joining by conventional methods. Control of the process is made from CAD data. As shown in Figure 2, the focusing plane of the laser coincides with the substrate surface.
The injected powder and part of the substrate melt and mix following the Marangoni effect movements in the melting pool. Once the first deposit is complete, the nozzle goes up a distance ∂z, defined in the CAD file, to form the second layer and so on. The velocity of the nozzle (powder + laser) allows the solidification of the melt and the formation of a deposit.
The different parameters which can influence the obtained clad are:
The geometry of the powder jet stream (nozzle geometry, carrier gas flow rate, and forming gas flow rate);
The position of the focusing plane of the powder jet stream;
The powder mass flow;
The laser beam divergence;
The position of the of the laser focusing plane;
The laser power and its distribution in the beam;
The nozzle movement with regard to the building part.
It is necessary to analyze the influence of each parameter, and optimize experimental conditions to obtain the best possible part. In this study, the geometry of the powder jet stream, the focusing planes position, the laser beam divergence are fixed and supposed to be yet optimized. Influence of the three main parameters which are the laser power P, the velocity of the laser beam with regard to the building part V and the powder mass flow Qm are studied.
Figure 2. Principle of Direct Laser Fabrication (DLF).
I.3. Advantages and Weaknesses of the Direct Laser Fabrication Process
Compared to rapid prototyping processes, direct manufacturing obviously allows creating directly a functional part that can be tested or even used immediately in its environment with the actual loads. (DLF) offers several advantages over other conventional manufacturing methods:
Time Reduction
Under the pressure of international markets, time is a very important criterion for achievement of technical and commercial objectives. The (DLF) can meet this requirement because no moulds and tools are necessary and the transcription from the CAD model to the produced part is direct. It allows gaining competitiveness and responsiveness.
Flexibility
The (DLF) enables creation of parts with very complex geometries and without assembly. The design is free and so parts are more esthetical and lighter. The multi-material structures can further increase functionality and lightness. It is also possible to produce specific coatings of excellent quality, lower distortion and also to repair damaged parts with high adhesion [Toyserkani et al., 2005]. This process is ideal for all productions of custom objects (mass customization).
Hussam El Cheikh and Bruno Courant 6
a)
b)
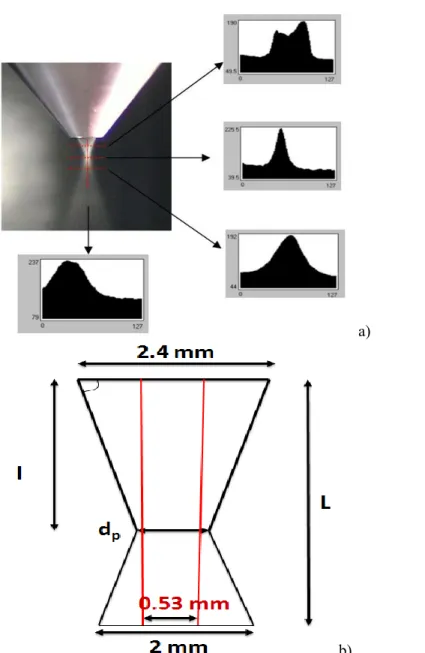
Figure 3. (a) Powder stream pictures analysis. (b) Powder cone shape from the nozzle issue to the laser focused plan.
Environment
Single pieces manufacturing from powders allows limiting transports of different elements and reducing or even removing machining procedures leading to the loss of material. This process is often described as favourable for environmental protection. Actually a serious assessment of its environmental impact remains to be done because the laser efficiency still low and powder has to be produced.
Thermal Control
The process uses a laser high energy to melt the under layer and the injected powder. The control of the melting zone geometry is possible through the input parameters, in particular
laser power and velocity. The geometry of this melting zone must be optimized to improve the microstructure and minimize internal stresses because they determine the mechanical properties of the fabricated part.
Multi-material
One of the opportunity offered by this technique, and therefore one of the issues to consider, is the realization of multi-material parts. Various kinds of powders can be injected simultaneously. Controlling their mass percentages, functionality of the part can be adjusted to the local solicitations.
Note also that some limitations exist for Direct Laser Fabrication process. It can’t allow making parts with materials that crack at hot or cold temperature or which are too viscous at liquid state. In addition, a post-processing is currently required to remove the mounting supports and/or polish the part surface.
The main applications are:
Aerospace and automotive (F1). Examples: TA6V, Inconel 718 (aircraft engines), aluminum alloys 2000, 7000, 6000 (fuselage).
Medical field with biocompatible alloys. Examples: Stainless steels (904, 316), Cr-Co, TA6V.
Tools or injection moulds. Examples: Steel 100Cr6, 42CD4, nickel base alloys.
Art: jewellery, sculptures. Examples: Stainless Steel.
Maintenance of weapons with damage parts repairing or even building of new parts no longer available on the market.
Hussam El Cheikh and Bruno Courant 8
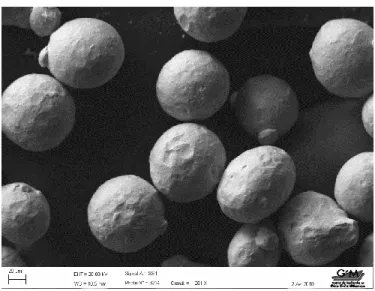
Figure 5. 316L Powder.
II.
E
XPERIMENTALC
ONDITIONSA 5 axes machine associated with a 700 W fiber laser (Ytterbium Fiber Laser System, diameter: 150 µm diameter, wave length about 1070-1080 µm) and a coaxial nozzle specially designed according to the laser beam characteristics is used in this study. A carrier gas (Ar) flow, fixed at 3L/min, import the powder while a secondary gas (Ar) flow, fixed at 5L/min, is shaping the powder stream. This nozzle is also equipped with a cooling channel to dissipate heat.
Figure 3 shows the conic powder jet stream geometry under the nozzle. Horizontal and vertical image analyses are studied. On the upper part of the jet, the horizontal image analysis displays two distributions due to the coaxial form of the nozzle. In the powder focus plan and under it only one distribution remains. An image analysis software is used to study the powder distribution in the jet from the light reflection. The obtained function is not directly the powder distribution in the jet but rather a projection of this distribution in the image plan. Nevertheless, it can be deduced that, in the focus plan, the powder distribution is an almost symmetrical Gaussian type distribution.
The vertical line in Figure 3a displays the distribution along the z axis. As shown in the image analysis, the higher concentration of the powder stream is in the focus plan. The coaxial nozzle allows a perfect symmetry of the particles distribution in the stream and very few particles outside the main trajectories. The powder focus plan, at a distance l (l=3.5 mm) from the nozzle, is a disk with a diameter dp (dp= 2 rp = 0.6 mm). The work distance L is constant and equal to 5 mm. Under the powder focus plan the powder distribution remains a Gaussian type distribution. The distance between the focus plan and the substrate surface is (1.5 mm) and in the interaction plan the powder stream is 2 mm in diameter. The laser beam is focused on the substrate surface while the focused plan for the powder stream is 5 mm above. Figure 4 shows the uniform laser power distribution in the focus plan. The diameter is 0.53 mm.
Hussam El Cheikh and Bruno Courant 10
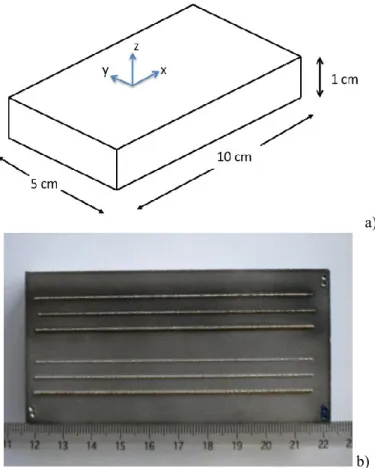
In this study, 316L with particles size between 45 and 90 μm are used to build the experimental single laser tracks on the steel substrate [Figure 5]. For each single laser track the laser power, the powder feed rate and the relative velocity are kept constant. The process duration is adjusted in order to obtain in each case the same length track of 90 mm. Each single laser track is produced on the same steel plate with same dimensions shown in Figure 6. To avoid any board effect, laser tracks are carried out at a distance of 10 mm from the substrate boards.
Experimental results are analysed with observations on laser tracks cross sections. Cross section characteristics change with power, velocity and powder feed rate. Characteristics of each single track are evaluated measuring the clad height H, the clad width W, the penetration depth Hf, and areas S and Sf. All these dimensions are presented in Figure 7.
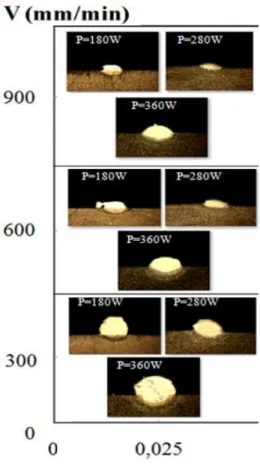
To study the effects of the main laser cladding parameters on the clad geometry, tracks were produced in a wide variety of power P (180, 280 and 360 W), velocity V (300, 600 and 900 mm/min) and mass feed rate Qm (0.025, 0.05 and 0.075 g/s). Samples are polished and etched with Nital (2%). Every combinations of the 3 values of the 3 parameters are explored which represents 27 single tracks as shown in Figure 8. For each one 2 cross-sections are studied and the mean result is reported in [Table 1].
III.
E
FFECTS OFP
ROCESSP
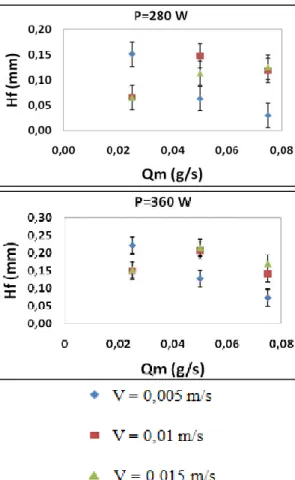
ARAMETERSIII.1. Effects on the Depth Penetration H
fFor the lowest power (180 W), fusion of the substrate still low and is even nonexistent in half cases (Figure 9). The molten zone reaches about 50 microns in cases 2 and 3, only 20 microns in cases 1 and 6 and is not visible in other cases. This induces a high relative uncertainty on these measures. However, in all cases, a deposit is actually performed and adheres to the substrate. So, a part of the powder and the substrate melt at least superficially. In low laser power conditions and for constant speed, the molten zone depth decreases when the powder mass flow increases.
Two interpretations can be advanced at this level to explain this relationship. On one hand, the powder mass flow increase induces an increase in the number of powder particles between the nozzle and substrate. This increase of powder grains leads to a larger part of the laser beam absorbed in the powder jet stream. And consequently a lower part of the laser beam reaches the substrate. On the other hand, we notice that a mass flow increase implies a clad height increase and so the laser-clad interaction surface climbs away from the substrate, at least in part. These two phenomena, heat source masking and interaction plan shift, lead to a reduction of the molten zone depth when the mass flow increases. For laser power of 280 W and 360 W, the same effect is strictly noticed only for a speed of 0.005 m/s. For the two other speeds, the melt depth variation is not monotonous and reaches a maximum for the intermediate speed. This illustrates the interaction between the various process parameters and the complexity that can be encountered in predicting the geometry of the laser track.
Figure 10, does not meet either the expected variations. As speed increases the melt depth does not decrease systematically, as it could be expected due to the laser fluence decrease. This can be explained by the concurrency of this phenomenon with the interaction plan shift.
As the speed increase the powder mass delivered by meter decreases, so the laser clad height decreases and the interaction surface (laser-clad) comes nearer the substrate which favours the substrate melting. Because of this concurrency, the melted zone depth is very difficult to predict. This makes more necessary the need to simulate the process.
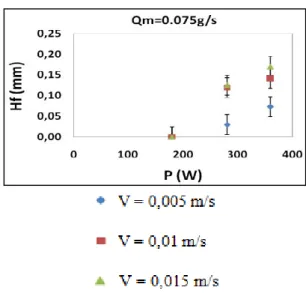
The process analysis should not be limited to the influence of each parameter in isolation. Figure 11 clearly shows that when other parameters remain unchanged, the laser power increase induces an increase of the molten zone depth. This relationship is not linear. In conclusion, the laser power is the parameter that has the clearest effect on the melted zone depth. The nozzle speed and the powder mass flow modulate the laser power effect varying the distance between the interaction surface (laser-clad) and the substrate.
a)
b)
Hussam El Cheikh and Bruno Courant 12
Figure 7. Cross section characteristics of a single laser track.
Table 1. Experimental measures for each single laser track
P Qm V W H S Hf Sf Clad N° W g/s mm/min mm mm mm2 mm mm2 1 180 0,025 300 0,56 0,47 0,25 0,03 0,01 2 180 0,025 600 0,50 0,19 0,07 0,05 0,01 3 180 0,025 900 0,43 0,15 0,05 0,05 0,08 4 180 0,050 300 0,41 0,73 0,53 0,00 0,00 5 180 0,050 600 0,38 0,39 0,19 0,00 0,00 6 180 0,050 900 0,42 0,24 0,09 0,02 0,00 7 180 0,075 300 0,28 0,81 0,59 0,00 0,00 8 180 0,075 600 0,39 0,47 0,22 0,00 0,00 9 180 0,075 900 0,40 0,33 0,12 0,00 0,00 10 360 0,025 300 0,83 0,49 0,36 0,22 0,11 11 360 0,025 600 0,72 0,27 0,15 0,15 0,07 12 360 0,025 900 0,68 0,20 0,09 0,15 0,07 13 360 0,050 300 0,86 0,82 0,76 0,13 0,06 14 360 0,050 600 0,71 0,42 0,27 0,21 0,09 15 360 0,050 900 0,62 0,26 0,14 0,22 0,08 16 360 0,075 300 0,90 0,90 0,89 0,07 0,03 17 360 0,075 600 0,73 0,59 0,41 0,14 0,06 18 360 0,075 900 0,71 0,35 0,18 0,17 0,07 19 280 0,025 300 0,66 0,32 0,17 0,15 0,07 20 280 0,025 600 0,60 0,14 0,06 0,07 0,04 21 280 0,025 900 0,53 0,09 0,03 0,07 0,03 22 280 0,050 300 0,64 0,68 0,52 0,06 0,03 23 280 0,050 600 0,62 0,37 0,19 0,15 0,05 24 280 0,050 900 0,55 0,22 0,09 0,11 0,04 25 280 0,075 300 0,65 0,80 0,70 0,03 0,01 26 280 0,075 600 0,56 0,47 0,28 0,12 0,04 27 280 0,075 900 0,56 0,27 0,12 0,13 0,04
III.2. Effects on the Clad Height H
Figure 12 shows the powder mass flow and the laser power effects on the deposit height. For a constant laser power and speed, the deposit height increases with the powder mass flow. For the lowest speed 0.005 m/s (300 mm/min), the deposit height is the highest. As it is intuitively expected, the height H increases with the mass flow increase and a light saturation can be observed in most cases for higher powder mass flow.
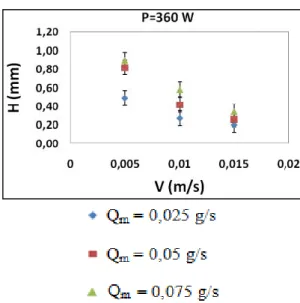
Figure 13 shows the laser speed and power effects on the deposit height for the three mass flows. For constant laser power and powder mass flow, the deposit height decreases with the laser speed increase. For the lowest mass flow (0.025 g/s), the deposit height is also the lowest. It can be considered that with the speed increase, the height decreases in a hyperbolic way. This was expected because the deposit height is almost proportional to the deposit mass per meter and so proportional to the ratio Qm/V. Figure 14 shows that the laser power has few effects on the clad height. Curves are almost horizontal. The laser speed and powder mass flow have a major influence on the deposit height.
Hussam El Cheikh and Bruno Courant 14
Figure 9. For each laser power, observations of the melt depth variation Hf as a function of mass flow Qm for the three velocities V.
Hussam El Cheikh and Bruno Courant 16
Figure 10. For each laser power, observations of the melt depth variation Hf as a function of velocities
Figure 11. For each mass flow Qm, observations of the melt depth variation Hf as a function of laser
power P for the three velocities V.
Hussam El Cheikh and Bruno Courant 18
Figure 12. For each laser power, observations of the variation on the height of the deposit H as a function of mass flow Qm for the three velocities V.
Figure 13. For each laser power, observations of the variation on the height of the deposit H as a function of velocities V for the three mass flows Qm.
Hussam El Cheikh and Bruno Courant 20
Figure 14. For each mass flow Qm, observations of the variation on the height of the deposit H as a
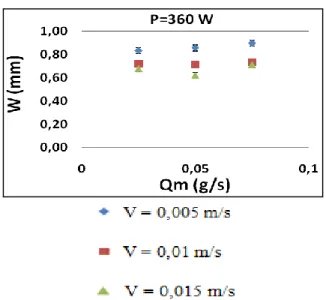
Figure 15. For each laser power, observations of the variation on the width W as a function of the mass flow Qm for the three velocities V.
Hussam El Cheikh and Bruno Courant 22
Figure 16. For each laser power, observations of the variation of the width W as a function of velocities V for the three mass flow Qm.
Figure 17. For each mass flow Qm, observations of the variation of the width W as a function of laser
power P for the three velocities V.
III.3. Effects on the Clad Width W
The deposit width W is considered at the substrate surface and is equal to the molten zone width in the substrate. It does not always correspond to the maximum width of the deposit clad. In Figure 15, for a laser power of 180 W, width variations as the deposit mass flow increases are not significant. So, the powder mass flow has no influence on the molten zone width.
Figure 16 allows analyzing the clad width variations according to the laser speed. For laser powers of 280 and 360 W, the width decreases as the speed increases. This can be expected because the absorbed power per unit length decreases and so the molten zone volume decreases. The same effect is observed in the case of laser remelting. In the case of the lowest laser power (180 W), deposit width variations are more complicated to explain. With the lowest powder mass flow (0.025 g/s), the deposit width decreases as the laser speed increases, whereas with the highest powder mass flow (0.075 g/s), the width increases as the speed increases. The competition between variations of the absorbed power per unit length and the distance laser-clad interaction surface can explain these apparently surprising results. The laser speed increases and the powder mass flow decreases leads to a smaller deposit clad and so the laser-clad interaction surface is closer the substrate. As the laser speed increases and the powder mass flow decreases lead to a smaller melting bath the laser-clad interaction surface subsiding lead to bigger melting bath at substrate surface level. This phenomenon effect on the melting bath width is the highest when the laser power is the lowest (180W). In this case and for the lowest powder mass flow, the absorbed power per unit length decreases is the dominant effect and for the highest powder mass flow the laser-clad interaction surface subsiding is dominant.
Figure 17 shows a simple relationship between the molten zone width and the laser power. The more the laser beam power is high the more the deposit width is large. Again the same variations as in the simple laser remelting case are observed.
Hussam El Cheikh and Bruno Courant 24
IV. P
ARAMETRICS
TUDYEffects of the different parameters analysed, more quantitative relationships are searched between the clad geometry characteristics and the experimental parameters (P, Qm, V). The clad mass is measured after each single track fabrication for the two power series (180 and 360). In the 280W serial case, the mass measure has not been possible for a technical problem.
Being capable to predict the laser track characteristics is really important to build a wall and finally to fabricate an object. [Onwubolu et al., 2007] chosen a regression analysis as 𝑌 = ∝0+ ∝ 𝑥1+ ∝2 𝑥2+ … . ∝𝑛 𝑥𝑛 where xi are the process parameters. Unfortunately, correlation coefficients presented are quite low. U. De Oliveira [De Oliveira et al. 2005] searched and founded more persuasive relationships like
P
1Q
2V
3
m . In our study, we
also made the assumption that some combinations as
P
1Q
2V
3
m are able to predict the
different laser track geometry characteristics. Using the Log function a linear regression is used to determine , and . We finally obtain relationships as
y
a
0
P
1Q
2V
3
b
0m
where y is one of the laser track geometry parameters while a and b are constants. With our experimental results, H is found proportional to
P
14Q
34V
1m with a correlation coefficient
R=0.97 (i.e. R²=0.94) taking into account all the 27 experiments. [Figure 18] shows these results.
The powder mass which falls on the substrate per meter is Qm V-1 (This is also the relationship proposed by U. De Oliveira). However, the laser power plays a non negligible part because it melts powder grains and the more the amount of melted powder increases the more the clad height increases. The correct representation of the relationship between the clad height and the process parameters could be written in the form
V Q Q P V Q P m m m 4 1 1 4 3 4 1 .
The first factor takes notice of the laser power effect on the powder melting. The R coefficient value of 0.97 shows a good correlation and the uniform distribution of the residuals confirms the linear model. The experimental repeatability uncertainty for the clad height is 0.040mm. If the linear regression formula is used to predict the clad height from the process parameters the uncertainty on this calculated clad height is 0.060mm. These two values are sufficiently narrow to show that this linear relationship between H and
1 4 3 4 1
V
Q
P
m is relevant. [Figure 19].The clad width is also proportional to a similar process parameters combination, with
0 , 75 . 0 2 1
and 30.25. It is to be noticed that the mass feed rate Qm has a negligible influence on the clad width. The two parameters laser power and velocity are sufficient to determine the single track width which could be the sign of a thermal effect like in the re-melting process. With our experimental measures a correlation coefficient R= 0.96 isfound with
P
34V
14. The experimental repeatability uncertainty concerning the width is 0.040 mm, whereas uncertainty on the estimated width using the linear dependence between W andP
34V
14 is 0.068mm which is comparable with the previous height uncertainty.Concerning the clad section area, the same method leads to the combination
P
Q
V
32 mwith a coefficient R equal to 0.978. The repeatability uncertainty is 0.025mm² and the uncertainty obtained for the estimated surface with the linear relationship is 0.049mm². [Figure 20]
Of course the clad mass is also proportional to
P
Q
mV
32 as the clad mass is proportional to the cross section surface. [Figure 21]The relationship between experimental parameters and the powder efficiency measuring the proportion of powder mass which stays on the substrate [Table 2] has also be determined. The uncertainty is 4.1% for the repeatability uncertainty and 5.2% for the estimated one. This is an important criterion because one of the Direct Laser Process goals is to do not lose matter by machining.
a)
b)
Hussam El Cheikh and Bruno Courant 26
a)
b)
Figure 19. a) Clad width versus P3/4/V1/4. b) Residuals.
a)
b)
Hussam El Cheikh and Bruno Courant 28
Figure 21. The linear dependence between the cross section surface and the clad mass.
These relationships are very useful to predict the clad width and height but not the complete geometry and do not help to understand the physical phenomenon involved during the process. Another way to predict the clad geometry is to simulate the supposed physical phenomenon involved.
V.
P
REDICTION OF THEG
EOMETRICALF
ORM OF THEC
LADThe deposited layer results from powder accumulation. First the clad height is supposed to be proportional to the number of powder grains which fall on each point. The clad geometry is then directly induced by the powder distribution in the jet. Three powder distributions are tested [El Cheikh et al. 2012] in order to explore various possible cases.
The powder distribution is given by f (x, y) and expressed in units: kg.m-2.s-1. The mass which fell on a little surface (ds=dx.dy) after the passage of the laser is given by:
𝑑𝑚 = ∫ 𝑓(𝑥, 𝑦). 𝑑𝑥. 𝑑𝑦. 𝑑𝑡0𝑡
The time t during which the powder fall on this surface is given by: 𝑡 =𝑉𝑏
where b is the chord of the powder deposition disk [Figure 22]: 𝑡 =2 rp
V √1 − y2
rp2
The powder height h which fell under the studied surface behind the powder jet is given by:
𝜌 =ℎ.𝑑𝑥.𝑑𝑦𝑑𝑚 → ℎ =𝜌.𝑑𝑥.𝑑𝑦𝑑𝑚 where is the powder density.
And finally: ℎ =1𝜌∫ 𝑓(𝑥, 𝑦). 𝑑𝑡 2 rp V √1− y2 rp2 0
Beneath the powder jet, b is only a part of the chord and so depends on x and y. ℎ =1𝜌∫b(x,y)V 𝑓(𝑥, 𝑦). 𝑑𝑡
0
Hussam El Cheikh and Bruno Courant 30
Figure 23. Geometry of the deposited layer in case of a uniform powder distribution.
Hussam El Cheikh and Bruno Courant 32
Figure 26. Fitting with three different functions to describe experimental results.
V.1. Uniform Distribution
If the powder distribution is uniform, the density of the powder feed rate is given by 2
)
,
(
p mr
Q
y
x
f
where Qm is the powder feed rate and rp the radius of the powder deposition circle. One can find that, behind the powder jet, the profile is given by 2 2
2
2
r
y
r
v
Q
p p m
andbeneath the powder jet by
)
(
2
2 2 2r
y
x
v
t
r
v
Q
p p m
.Table 2. Relationship between geometrical characterization and process parameters
Relationship Correlation coefficient (R2)
H 𝑃14𝑄𝑚34/𝑉 0.944
W 𝑃34𝑉14 0.922
S 𝑃 𝑄𝑚 /𝑉√𝑉 0.957
Pe 𝑃4 3𝑄𝑚 −1 3𝑉−12 0.910 Sf 𝐿𝑛 (𝑃45 𝑄𝑚 −1 4) 0.649 Hf 𝐿𝑛 (𝑃2𝑉14 𝑄 𝑚 −1 4) 0.765
V.2. Gaussian Distribution
If the powder distribution is Gaussian along
x
andy
axis:2 2 2 ) ( 2
)
,
(
rp y Vt x p me
r
Q
y
x
f
One can find that the profile behind and beneath the powder jet takes the following form:
)]
.
(
)
(
.[
.
2
2
2 2 2 p p r y p mr
t
v
x
erf
r
x
erf
e
r
v
Q
p
V.3. Polynomial Distribution
If the distribution is supposed to be parabolic:
c
y
x
b
y
x
a
c
br
ar
y
x
f
(
,
)
2
(
)
2
(
)
One can find that under the powder jet: 2 3 2 2 4
(
)
.
3
8
r
y
r
v
Q
p p m
The equation behind the powder jet is
2 2 2 2 2 2 2 2 3 3( .). 2 ( 3( .) 2 )] ) . [( 2 p p p p m r v y r t v x r y r y y t v x t v x Q
and zero everywhere else.
One can notice that with this approach the laser power is not took into account. Concerning the height H, this is not really significant because H has been found
Hussam El Cheikh and Bruno Courant 34
experimentally proportional to
P
14Q
34V
1m and so in our case P1/4 varies from 1 to 1.19
while Qm3/4 varies from 1 to 2.28 and V-1 from 1 to 3. On the other hand, it is critical for the determination of W which has been found proportional to
P
34V
14. This can be explained by the fact that the clad width is controlled by a thermal effect which depends directly on the power P. This parameter plays an important part on the powder melting in the jet and on the melting bath dimensions.[Figure 26] shows fittings on two representative laser tracks geometries, a spread one and a near semi-circular one. While the experimental cross section is represented by blue points, the blue curve corresponds to the uniform distribution, the red one to the polynomial distribution and the green one to the Gaussian distribution.
The Gaussian and polynomial distributions are more suitable for the spread geometry while the uniform distribution is better for the semi-circular one. One can use the proposed analytical relationships for specific conditions but it is not likely that the powder distribution in the jet changes from a Gaussian distribution to a uniform one as process parameters are modified. Furthermore in the case of the lower laser speeds the clad geometry is a part of a disk and none of these distributions can leads to such geometry. So, in our case, the laser clad geometry is not directly induced by the powder distribution in the jet. In order to simulate the laser clad process in the stationary case, it is more efficient to fix the cross-section geometry as a part of a disk.
Figure 27. Schematic representation of the clad cross section.
V.4. Circular Form
V.4.1. Theory
Actually, we have experimentally observed that clad dimensions depend on process parameters while the cross section always remains a part of a virtual disk which centre can be below or above the work piece surface [Figure 8]. This second modelling represents the clad cross-section by a circular form and the new request is to determine the centre location and the radius of this disk. The disk centre is found above the work piece surface when the
velocity isn’t great enough to avoid the accumulation of the deposited material. The usefulness of the proposed model is to predict the height, the width, the surface and the general form of the cross section in any cases.
This circular geometry suggests that surface tension forces are dominant. The calculation of the capillary length gives a result of 0.004 meter. The liquid bath has a characteristic length smaller than this capillary length and so the gravity effect is negligible and the liquid shape is almost spherical (circular in the cross-section plane and slightly lengthened along the laser displacement axis because of the laser movement).
A similar approach exist, using the Simpson’s rule, but is limited to cases where the clad is flattened. It allows describing the clad height and width by Davis et al. (2006), to optimize clad parameters by Pinkerton and Li (2004) and to avoid excessive dilution and overlap porosity by Colaco et al. (1996).
Figure 28. Observed kind of Clad.
This approach is more general and allows the prediction of the form, the height, the width and the area of the clad from the process parameters in all cases.
Relationships between the Geometrical Characteristics R, W and the Process Parameters
Figure 27 shows the virtual disk supposed to describe the laser track shape.
The disk is defined by its centre location and its radius R. They both depend on process parameters. W is the clad width and also the disk chord at z=0. Taking into account only the powder which is incorporated in the clad, the actual surface of the clad cross-section is given byPeQm
ρ V .
[Figure 28] shows the two kinds of clad which can be obtained during the deposition. They differ from their centre location which can be located below or above the substrate surface. The powder mass deposited is related to the laser clad volume above the substrate surface.
In the limit case the circle centre is located on the substrate surface and one can show that
PeQm
ρ V = πR2
2 . Then the disk radius is given by: R = √ 2 Qm Pe
π ρ V . This case is a very interesting
one to build a structure because of its semi-circular geometry. Outside this limit case:
Hussam El Cheikh and Bruno Courant 36
Type 1: If PeQm
ρ V < πW2
8 , the disk centre is below the substrate surface and at a
distance √R2− (W 2)
2
from it. The radius R is obtained by solving the equation:
PeQm ρ V = 1 6W(R(1 − √1 − ( W 2R)2)(3R 2(1 − √1 − (W 2R)2) 2+ 4W2) (V.4.1)
This case is also interesting and corresponds to the flattened one.
Type 2: If PeQm
ρ V > πW2
8 , The disk centre is above the surface substrate and at a
distance √R2− (W 2)
2
from it. The radius R is obtained by solving the equation:
PeQm ρ V = πR2− 1 6W(R(1 − √1 − ( W 2R)2)(3R2(1 − √1 − ( W 2R)2)2+ 4W2)) (V.4.2)
This case can't be used to build a full density structure but can be interesting for a porous one.
Finally the clad geometry can be expressed as an analytical expression which is the one of the circle of radius R and centred at the distance √R2− (W
2) 2
below or above the substrate surface. The disk radius can be calculated knowing the width W and the powder efficiency Pe. It is to be noticed that the laser power is hidden behind Pe. We suggest two different methods to predict Pe and W.
Determining Pe and W with Parametric Relationships
Each clad is defined by the corresponding process parameters (P, Qm, V). The previous parametric study can be used to link the clad cross section characteristics W, H and Pe to the process parameters. The geometrical form of the clad can now be predicted. This is presented in [Figure 29]. The continue line represent the prediction from experimental measurements of the width and the powder efficiency. The dotted line is the prediction from parameters (P, Qm, V) and the analytical relationships previously determined. It clearly shows that in the limits determined by our experiments we are able to predict the clad geometry from the analytical parametric relationships presented above.
Figure 29. Confrontation between geometrical representations of the clad geometry obtained with experimental measures of W and Pe (continue line) and analytical determination of W and Pe from the
parametric relationships (dotted line) at P=180 W.
In [Figure 30] the cross section simulations obtained with the parametric relationships (dotted lines) are compared with those obtained with the experimental measured width (continue line) and superimposed with the experimental photographs.
These overlays are convincing, so this method can be used to predict the clad geometry and improve the process. The powder efficiency Pe is easy to measure weighing the part before and after the process. The width W can be easily measured as long as the clad doesn’t correspond to the type 2 because of the narrowing bellow the clad upper part which imposes a cross section observation. A way to avoid this measure and to generalize the modelling is to determine the width W from a theoretically.
Hussam El Cheikh and Bruno Courant 38
b)
c)
Figure 30. Confrontation between experimental results and simulated ones obtained with the analytical relationships at different power a-180, b-280 and c-360W.
Determining W Using a Thermal Study
The relationship between W and the experimental parameters doesn’t involve the parameter Qm. This observation shows that a thermal process governs the parameter W. This is also in agreement with the usually accepted fact that only the powder which falls in the melting bath stay in the clad (Lin, 1999). The clad width is given by the molten pool dimension. The laser beam moves in the x direction at a constant velocity, many assumptions can be made to simplify the interaction between the laser and the substrate as follow:
The substrate is considered as a semi-infinite solid initially at the room temperature T0.
The melting zone is supposed to be a sphere whose surface is always at the melting temperature Tm.
Thermo-physical properties are temperature independent.
In the steady state the pool geometry is constant. An energy balance is established between the absorbed laser energy in unit time, Ql, and the energy transported through the boundary of the melting pool in contact with the substrate and the deposit clad in unit time Qc by the heat conduction.
Ql = Q (V.4.3)
The laser energy in unit time absorbed by the work piece is expressed as
Ql= Abs P (V.4.4)
The proposed assumptions lead to a spherical symmetry problem solvable in one direction.
In these conditions and in case of transient conduction, an analytical solution is given by (Holman, 1990):
Qc = k A (T√π α tm−T0) (V.4.5)
where A is the surface at the temperature Tm crossed by the heat flux i.e. the area of the melting pool in contact with the substrate and the deposit clad.
In laser cladding, the melting zone is almost spherical and the surface contact A represents a part of its surface as shown in [Figure 31], A = f π d2 .
The characteristic time for the melting zone to cross above a point is given as:
t =dv (V.4.6)
From Equation (V.4.5) and Equation (V.4.6) the melting zone diameter is given by: d = (Absf )23( P √π α
πk√V(Tm−T0)) 2
3 (V.4.7)
Hussam El Cheikh and Bruno Courant 40
The width is given versus the melting temperature and the thermo physical proprieties of the clad material, and depends on the laser beam power and velocity.
However, powder efficiency depends on the particular nozzle used and seems difficult to generalize with an analytical relationship. The formula proposed by Liu and Li (2005) has been tried with our experimental results without success. So Pe is kept as an experimental entry.
Results obtained with the analytical model are given in [Figure 32].
The continue line is the clad representation when W is calculated with the parametric relationships while the dotted line is the clad representation when the width W is calculated from the thermal analytical model. The visual confrontation shows a good agreement. So this model can predict the general geometry of the clad cross section. Changes induced by the parameters variations are well reproduced.
W = K . ( πk√V(T P √π α
m−T0)) 2 3
with K=Abs/f.
Absorption depends on the laser radiation, the used materials and the surface temperature. The fraction f can be estimated between 0.50 and 0.75. In our case, good results are obtained with a constant K equal to 0.26. So a calibration remains to be done.
b)
Figure 32. (Continued)
c)
Figure 32. Confrontation between the representation of the clad geometry obtained with the analytical relationship (continue line) and with the thermal analytical model (dotted line) at different power, a- 180W, b-280W and c-360W.
Hussam El Cheikh and Bruno Courant 42
Figure 33. Temperature distribution for a laser power of 180 W, a powder mass flow of 0.025g/s and a velocity of 0.01m/s. A cross section view in the (x,y) plan at y=0 (a), and in the (y,z) plan at x=0 (b).
Laser cladding process success depends on the ability to predict the laser clad geometry from the process parameters. Assuming the fact that the clad geometry is governed by the surface tension on the melted bath and so that the clad geometry is a part of a disk it is shown that it is possible to predict, with a good uncertainty, the complete geometrical characteristics of the laser clad. This modelling can also be useful in association with a more complete thermal study to determine the shape of the melting pool, and the temperature distribution in the building part.
Figure 34. 3D temperature distribution for a laser power of 180 W, mass flow of 0.025g/s and a velocity of 0.01m/s. T>600°C (a), melting zone shape (b).
VI.
T
HERMALS
TUDYAND
M
ICROSTRUCTUREP
REDICTIONVI.1. Thermal Study
Thermal simulations in laser processes are usually raised with the Finite Element Method very time consuming especially for a 3D problem [ref]. A simpler and faster alternative
Figure 33. Temperature distribution for a laser power of 180 W, a powder mass flow of 0.025g/s and a velocity of 0.01m/s. A cross section view in the (x,y) plan at y=0 (a), and in the (y,z) plan at x=0 (b).
consists in using the point source method [ref] directly in the substrate surface. Regrettably the clad geometry is neglected and the calculated thermal field around the melting is too far from reality. In this part, a way to avoid this main defect is proposed. Temperature fields induced in the substrate by the laser source are calculated considering the laser beam as a point source applied on the building deposit surface. This is possible precisely using results presented above.
This approach requires several simplifying assumptions:
The laser-powder interaction occurs at the clad surface extremity where it is being built. In reality, interaction between the laser and the powder has already started in the powder jet stream. An overestimated absorption coefficient compensates a part of it.
The substrate is considered as semi-infinite body. This is reasonable considerintg the small size of the melting zone.
The heat lost by convection and radiation is negligible compared to the supply of heat in the clad [Davis et al., 1986], [Cheng and Kar, 1997]. Losses are generally considered underestimating the absorption coefficient.
Thermo-physical properties of the part are considered independent of temperature.
A steady state is established.
The latent heat of fusion and vaporization are not taken into account, so temperatures will not be calculated in the melting zone.
The laser moves in the positive x direction with a constant velocity. The governing equation for the quasi-steady state heat conduction problem is given by
0
)
,
,
(
2
k
z
y
x
q
x
T
V
T
,
x,y andz
0
.T is the temperature; q is the heat source, k the conductivity, α the thermal diffusivity and V the moving work piece velocity.
Boundary conditions are taken as 0
)
,
,
(
x
y
z
T
T
asx
;
y
,
x
. T0 is the ambient temperature.The problem can be solved by using the Green’s functions which satisfy the thermal equation:
,
0
)
(
)
(
)
(
2
k
z
z
y
y
x
x
x
G
v
G
f
f
f
x,
y
,
z
Hussam El Cheikh and Bruno Courant 44
The Green’s functions in the case of a quasi-stationary state are given by the following equation: 2 2 2 2 2 2 ) ( ) ( ) ( ) ( ) ( ) ( ) [( 2 exp 4 1 ) , , ( f f f f f f f z z y y x x z z y y x x x x V k z y x G
For one point source heating the clad layer extremity, the temperature at a point (x,y,z) is given by:
T(x, y, z) = T
0+
Abs P2πkexp [−V2α((x−xf)+√(x−xf)2+(z−yf)2+(z−zf)2 ]
√(x−xf)2+(z−y
f)2+(z−zf)2
Only the part, in the substrate and the clad layer, has to be taken into consideration. A function, called zf, depending on the space variables x and y is defined using the disk model to delimit the upper part of the substrate and the clad layer surface. This function zf(x, y) is so
given by: 𝑧𝑓(𝑥, 𝑦) = If[(√(𝑥 +𝑊4) 2 + 𝑦2<𝑊 2 && 𝑥 > (− 𝑊 4)) , √𝑅2− (𝑥 + 𝑊 4) 2 − 𝑦2− √𝑅2− (𝑊 2) 2 , If [(Abs[𝑦] < 𝑊2 && 𝑥 < (−𝑊4)), √𝑅2− 𝑦2− √𝑅2− (𝑊 2)2, 0]]
where W is the laser track width and R is the circle radius. The source point is located at the clad extremity at a distance W/4 from the x axis centre.
The temperature distribution in the case of a laser power of 180 W, a powder mass flow of 0.025g/s and a velocity of 0.01m/s is shown in [Figure 33]. The melting zone limit is defined as the isotherm 1535°C and the shown isotherms are {T0, 100, 200, 300, ..., 1500,Tm}, where T0 is the ambient temperature (T0=20°C). Figure 34 shows the 3D melting zone geometry (Figure 34-b), and the volume in which temperature is higher than 600°C (Figure 34-a).
Absorption is fixed at 50% while the conductivity corresponds to the substrate conductivity 30 W/m/s. This choice is justify by the fact that heat is pumped from the melting zone by the substrate and so depends on the substrate conductivity. This modelling is not suitable in cases for which a narrowing is observed at the clad bottom because it should be as if heat should travel this empty space. Anyway, this configuration is not suitable for direct fabrication.
Figure 35. Solidification speed Vs and laser speed V at the solidification front level.
Figure 36. Longitudinal cross section for clad n 10 (general view x100 and detailed zone x200).
VI.2. Microstructure Prediction
Once the clad geometry and the thermal field in the building part calculated, the microstructure simulation seems possible. This part focuses on the confrontation between thermal simulations and the observed microstructures to understand variations of the grains morphologies and sizes. The microstructure characteristics depend on the solidification conditions in an extremely complex way. It depends on the physicochemical conditions prevailing in low space-time dimensions. Simulations require a precise knowledge of temperature gradients and solute concentrations in areas of transformations. However, a simplified and elegant approach is possible: the microstructure of the deposits is considered to be simply dependent on the temperature gradient (𝑔𝑇=𝜕𝑇𝜕𝑡) and the solidification front
velocity 𝑉𝑆. These two quantities being considered in the normal direction to the solidification
front [Kurz and Fisher, 1986]. The quotient of the temperature gradient by the solidification front velocity governs the grains morphology, whereas the product of these two parameters governs the grains size. The solidification speed is related to the laser speed by the equation 𝑉𝑆 = 𝑉 𝑐𝑜𝑠𝜃, where θ is the angle between the solidification front normal vector
Hussam El Cheikh and Bruno Courant 46
Figure 37. Cross section for clad n 16 (x200).
Figure 38. Temperature Gradients and melting zone limit for clad n 6. (P=180 W, Qm=0,050 g/s and V=0,01 m/s). Axis in (mm).
Figure 39. Product of the gradient temperature and the velocity of solidification (𝑔𝑇. 𝑉𝑠) for clad n 6.
Figure 40. Quotient of the gradient temperature and the solidification front velocity (𝑔𝑇. 𝑉𝑠) for clad n 6.
Expressed in C.s/m².
At the extreme bottom of the melting zone, the solidification front normal vector is perpendicular to the laser speed direction thus the speed VS becomes zero. The ratio of the temperature gradient gT on the solidification speed VS (gT/Vs) exceeds a critical value and
then the grains growth is stable. The product (gT. Vs) is very small which promotes the
growth of large grains. A planar growth is then observed at the bottom of the molten zone as shown in Figure 36-a, b and Figure 37. At the top of the deposit laser clad, a part of the solidification front is perpendicular to the laser direction. The solidification front normal is then parallel to the laser moving speed and thus the solidification speed VS is maximal and equal to the laser beam speed. The quotient (gT/Vs) is minimal and the solidification front
destabilization is maximum. This destabilization implies dendrites growth with potentially multiple branches. Elsewhere in the clad, the intermediate case must appear i.e. columnar dendrites growth. The columnar grains size depends on the process parameters and is always observed between 10 and 20 µm.
Each process parameters influence is studied separately observing the deposits characteristics variations when one parameter varies while the two other ones are kept constant.
Simulations of the temperature gradients and the solidification speeds are caring out using the Green functions method in order to access to the product and quotient of these two quantities. The following figures show sectional views, in the plane y = 0, for the temperature gradient (Figure 38), the product (gT. Vs) (Figure 39) and the quotient (gT/Vs) (Figure 40).
Figure 38 shows the calculated temperature gradients around the melting zone. For the clad n 6, simulation indicates that the gradients are of the order of 5.106-7.106 C / m.
The product (gT. Vs), exhibited in Figure 39, is zero at the bottom of the melting zone and
gradually increases to reach over than 6104 °C/s at the top of the deposit. The grain size decreases when gT. Vs is growing and so the smallest grains are situated at the top of the
molten zone. The quotient (gT/Vs), exhibited in Figure 40, is minimal at the top of the molten
zone with about 300.106C.s/m². At the bottom of the melting zone, as the solidification velocity is zero, this ratio tends to infinity. This explains the well succession of different types of grains observed in the melting zone depending on the position of these grains in the clad deposit.
Hussam El Cheikh and Bruno Courant 48
VI.2.1. Influence of the Laser Scanning Velocity V
When the laser scanning velocity increases, the solidification front velocity also increases as the melt follows the beam. Grains tend to become smaller as the speed increases as the product gT. Vs grows. This can be seen experimentally (Figure 44). For a constant power and
mass flow, grains size is the tallest with a speed of 300 mm/min the smallest with a speed of 900 mm/min.
Figure 43 shows simulated results of the product of the solidification front velocity and the temperature gradient (𝑔𝑇. 𝑉𝑠). Only the value of the product 𝑔𝑇. 𝑉𝑠 at the solidification
front is interesting. This product is much greater at the top of the deposit, when the solidification speed Vs is equal to the laser speed. At this level, the calculated value is about 12000°C/s for the lowest speed, 25000°C/s for the intermediate speed and 38000°C/s for the fastest speed. When the scanning velocity increases the grain size should decrease. This result is consistent with [Kobryn et al., 2000].
Figure 41. Temperature gradients and melting zone limit for clads n 13, 14 and 15.
Figure 42. Solidification front velocity Vs for clads n 13, 14 and 15.
Figure 44 shows three samples obtained with different velocities and the same power and mass flow. The three samples are the experimental witness of grain size variations with the scanning velocity and show that the grain size decreases when the laser speed increases. Note that with the strong variations in the value of this product in the same clad deposit we can observe different grain sizes in the same deposit (it varies from 0°C/s at the bottom of the molten zone up to several thousand °C/s at the top of the molten zone).
Hussam El Cheikh and Bruno Courant 50
VI.2.2. Influence of the Laser Beam Power P
Influence of the laser power P is studied on samples obtained with the same mass flow and velocity. The three deposits (5, 14 and 23) are built with a mass flow of 0.050 g/s, a speed of 0.010 m/s and the different powers 180, 360 and 280 W respectively. When the speed remains constant, the solidification front velocity is constant; consequently the product (𝑔𝑇. 𝑉𝑠) is governed by the temperature gradient. Our simulations show that increasing the
laser power the molten zone becomes larger and the temperature gradients decrease near the solidification front. [Figure 45] shows the simulated product (𝑔𝑇. 𝑉𝑠). For a laser power of
180W (clad n 5), 𝑔𝑇. 𝑉𝑠 is around 50000°C/s at the top of the clad, for a power of 280W (clad
n 23), (𝑔𝑇. 𝑉𝑠) is around 30000°C/s, and for a power of 360W (clad n 14), (𝑔𝑇. 𝑉𝑠) is around
25000°C/s.
For a constant speed and mass flow, grains in the clad obtained with a power of P= 180W are the smallest. Figure 46 shows the microstructure observed with an optical microscope.
Figure 43. Product of the solidification front velocity and the temperature gradient (gT.Vs) and the
melting zone limit for clads n 13, 14 and 15.
VI.2.3. Influence of the Powder Mass Flow Qm
Influence of the powder mass flow is studied on samples obtained with the same laser power and scanning velocity but different mass flows. Clads n 10, 13 and 16 have the same speed 0.005 m/s, same power 360 W and three mass flows equal to 0.025 g/s, 0.050 g/s and 0.075 g/s respectively. The scanning velocity remaining constant the solidification velocity is
kept in the same interval. (𝑔𝑇. 𝑉𝑠) simulations (Figure 47) show that this product is constant
on the melting zone boundary regardless of the powder mass flow sent. Grains size should not change between these three deposits. Figure 48 witness to the ineffectiveness of the powder mass flow on grains size.
Hussam El Cheikh and Bruno Courant 52
Figure 46. Observed microstructure for clads n 5, 14 and 23.
Hussam El Cheikh and Bruno Courant 54
Figure 47. Product (gT.Vs) and melting zone limit for clads n 10, 13 and 16.
Figure 48. Observed microstructure for the clads n 5, 14 and 2.3.
C
ONCLUSIONIn the present work, relationships such as (