Science Arts & Métiers (SAM)
is an open access repository that collects the work of Arts et Métiers Institute of Technology researchers and makes it freely available over the web where possible.
This is an author-deposited version published in: https://sam.ensam.eu
Handle ID: .http://hdl.handle.net/10985/18317
To cite this version :
Shahin EBRAHIMI, Laurent GAJNY, Claudio VERGARI, Elsa ANGELINI, Wafa SKALLI -Vertebral rotation estimation from frontal X-rays using a quasi-automated pedicle detection method - European Spine Journal - Vol. 28, p.3026–3034 - 2019
Any correspondence concerning this service should be sent to the repository Administrator : [email protected]
Vertebral rotation estimation from frontal X‑rays using
a quasi‑automated pedicle detection method
Shahin Ebrahimi1 · Laurent Gajny1 · Claudio Vergari1 · Elsa D. Angelini2,3 · Wafa Skalli1
Abstract
Purpose Measurement of vertebral axial rotation (VAR) is relevant for the assessment of scoliosis. Stokes method allows estimating VAR in frontal X-rays from the relative position of the pedicles and the vertebral body. This method requires identifying these landmarks for each vertebral level, which is time-consuming. In this work, a quasi-automated method for pedicle detection and VAR estimation was proposed.
Method A total of 149 healthy and adolescent idiopathic scoliotic (AIS) subjects were included in this retrospective study. Their frontal X-rays were collected from multiple sites and manually annotated to identify the spinal midline and pedicle positions. Then, an automated pedicle detector was developed based on image analysis, machine learning and fast manual identification of a few landmarks. VARs were calculated using the Stokes method in a validation dataset of 11 healthy (age 6–33 years) and 46 AIS subjects (age 6–16 years, Cobb 10°–46°), both from detected pedicles and those manually anno-tated to compare them. Sensitivity of pedicle location to the manual inputs was quantified on 20 scoliotic subjects, using 10 perturbed versions of the manual inputs.
Results Pedicles centers were localized with a precision of 84% and mean difference of 1.2 ± 1.2 mm, when comparin with manual identification. Comparison of VAR values between automated and manual pedicle localization yielded a signed dif-ference of − 0.2 ± 3.4°. The uncertainty on pedicle location was smaller than 2 mm along each image axis.
Conclusion The proposed method allowed calculating VAR values in frontal radiographs with minimal user intervention and robust quasi-automated pedicle localization.
Keywords Vertebral axial rotation · Scoliosis · X-rays · Machine learning · Pedicle detection
Introduction
Adolescent idiopathic scoliosis (AIS) is a three-dimensional deformity of the spine. While Cobb angle measurements on frontal radiographs are widely used to assess scoliosis
* Laurent Gajny
severity, such 2D measurements are affected by projection bias, and do not take into account the patient’s transverse plane [1, 2]. 3D reconstruction from low dose biplanar X-rays is now routinely used in clinics. 3D reconstruction methods such as [3] have been widely validated, and their clinical relevance is more and more underlined, for diag-nosis and early assessment of progressive scoliosis [4–9], and for the evaluation of orthopedic treatments [10, 11]. In particular, vertebral axial rotations (VARs) can be accu-rately assessed. In [12], the authors reported a reproducibil-ity of 6.1° on severe scoliotic subjects. However, low-dose biplanar X-ray systems are not yet generalized. Therefore, assessing the three-dimensional aspect of AIS from a single radiograph is of great interest.
The most natural alternative is the study of a single fron-tal radiograph. Indeed, by observing the relative position and radiographic appearance of vertebral bodies, pedicles and spinous process in frontal X-rays, vertebral rotations (axial and frontal) can also be estimated. Stokes et al. [13] proposed a quantitative method to approximate VAR from the position of pedicles and vertebral body on frontal radio-graphs. They reported a 95% confidence interval for this estimate of 7.1°. However, the method required a tedious manual annotation of both pedicle and vertebral body cent-ers. Thus, our study aims at providing a quasi-automatic tool for VAR quantitative assessment based on pedicle detection in single frontal radiographs of scoliotic patients. This study could secondly be used to automatically improve current 3D spine models.
Pedicles have specific visual characteristics on frontal radiographs, and therefore have the potential of being auto-matically detected using image processing. Previous works [14–17] proposed various deformable models for pedicle segmentation. While returning accurate segmentations, these approaches require a tedious manual initialization at each pedicle and lack extensive validation. An alternative approach [18] developed a machine learning-based pedicle detection method to detect the lower end of left pedicles in L1, L2, and L3. However, they reported an accuracy of 48% for their best classifier.
In this study, a method for quasi-automated pedicle detection in frontal radiographs is described and evaluated in terms of sensitivity and precision compared to manual selection of the pedicles. The influence of manual annota-tions is also evaluated through a simulated reproducibility
study. The detected pedicles were further evaluated via the obtained regressed measures of VAR, comparing to values obtained via manual pedicle selection and to the values extracted from 3D reconstruction of the spine.
Materials and methods
Data
A training dataset of 92 biplanar radiographs (EOS™ imag-ing system, Paris, France) of healthy and scoliotic patients (Cobb angles 3°–93°, mean ± SD: 42° ± 24°) and associated 3D spine reconstructions [3] was built retrospectively. At different steps of an iterative process, this dataset was used to statistically infer the approximate position of the pedicles.
A second dataset of 57 frontal radiographs—extracted from biplanar X-rays—of healthy and scoliotic subjects was built retrospectively for training and testing. Testing involved manual inputs to generate search areas for the pedicles, and automated post-processing to detect pedicles within the search areas and then to infer missing pedicles. Patients’ characteristics are reported in Table 1. Patients suf-fering from very severe scoliosis, wearing braces or having metallic implants were not included in this dataset. For all radiographs, manual annotation of the pedicles was con-ducted by biomedical engineers specialized in spine imaging as well as 3D reconstruction of the spine using a previously validated method [3]. This study used previous data col-lection approved by the ethical committee, and patients or parents informed consent was obtained.
Manual initialization
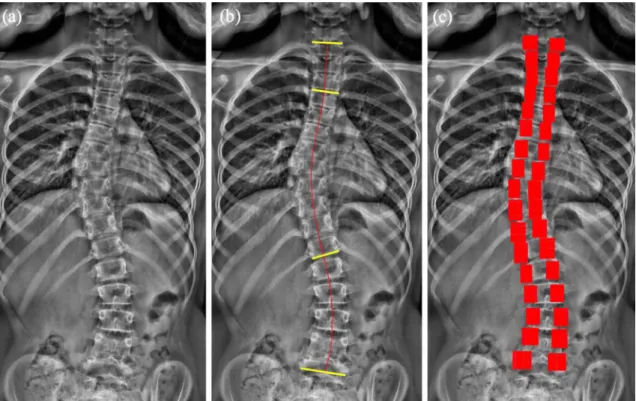
First, a 2D model of the spine was estimated via manual drawing of the spinal curve and positioning of four vertebral endplates on the radiograph: the upper endplates of T1 and T4, and the lower endplates of T12 and L5 (Fig. 1b). From this initial model, probable pedicle positions were approxi-mated by rectangular ROIs (Fig. 1c).
Visual descriptors extraction
After image enhancement using a combination of classical image filters, two types of visual descriptors were applied:
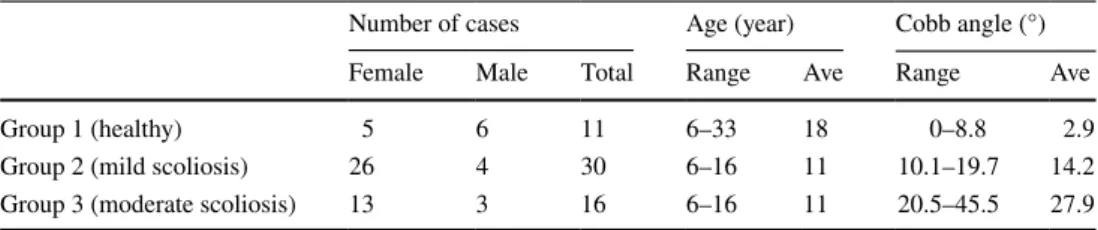
Table 1 Training and testing
datasets characteristics. (Ave = average)
Number of cases Age (year) Cobb angle (°) Female Male Total Range Ave Range Ave Group 1 (healthy) 5 6 11 6–33 18 0–8.8 2.9 Group 2 (mild scoliosis) 26 4 30 6–16 11 10.1–19.7 14.2 Group 3 (moderate scoliosis) 13 3 16 6–16 11 20.5–45.5 27.9
Histograms of oriented gradients (HOG) [19] and a specific configuration of contextual features (CF) [20] that combines local and remote visual information, around the pixel being analyzed.
Pedicles detection
Random Forest (RF) classifiers were trained for pedicle detection, using the HOG and CF features. RF is a super-vised learning algorithm based on positive and negative instances, required in a training phase. RF has been chosen thanks to its ability to correctly classify instances based on a large amount of visual descriptors. The manually deline-ated pedicles in the training dataset were used as positive instances. Negative instances were randomly sampled from non-pedicle regions. Given the variability of pedicle shape and size, the spine was split into three regions (T1–T7, T8–T12, L1–L5). One RF classifier per region was learned. For training classifiers in T8–T12 and L1–L5 regions, the X-rays were down-sampled by two, leading to approximately uniform pedicle sizes in pixels in all regions.
In the testing phase, within each ROI, a grid of 26 × 24 candidate pixels was automatically defined (Fig. 1c). As shown in Fig. 2a, b, the classifiers sometimes identified mul-tiple clusters of pixels as belonging to one pedicle. In order to retain only one cluster, first mathematical morphology
filtering was applied to group the detected pixels into at most two distinct clusters within each ROI (Fig. 2c). Then, cluster size and probability measures of its pixels, as assigned by the classifiers, helped retaining the most probable cluster (Fig. 2d).
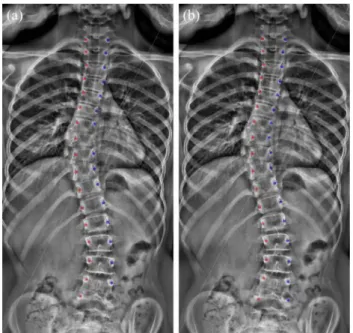
The pedicle’s center for each selected cluster in Fig. 2d was calculated as the weighted mean of the cluster pixels coordinates, using probability measures as weights (Fig. 3a).
Refinement stage
An automatic refinement helped choosing the most robust pedicle centers and estimate the missing ones. First, false positives were discarded using a priori knowledge regarding inter-pedicular segment orientation and length. Then, the actual positions of these rejected false positives, as well as undetected pedicles, were inferred using the 2D spine shape model (Fig. 3b).
Computation of vertebral orientations
VARs were computed using the Stokes method [13], as described hereafter: (1) VAR = arctan(w 2d× a − b a + b )
Fig. 1 2D statistical shape modeling. a Original frontal radiograph
image. b Manually identified spinal line and four vertebral end-plates: the upper endplates of T1 and T4 and lower endplates of T12
and L5. c Using the manual inputs in b, a 2D model of the spine was obtained, from which approximate position of pedicles and search regions-of-interest (ROIs) are estimated (in red)
where w and 2d are the width and depth of the ver-tebra, respectively, while a/b are the distances between left/right pedicles and vertebral body center. Values of the width-to-depth (w/2d) ratio were derived from the patient dataset described in [3] (See Table 2). Manual VARs were calculated by considering a manually defined spinal curve passing through vertebral body centers.
In addition, vertebral frontal rotations were also calcu-lated by measuring the angle α between the inter-pedicular line f and the image horizontal axis h (Fig. 4).
Analysis
For all 57 subjects, positions of detected pedicle centers were compared to the positions of the manually delineated ones. A distance lower than 2 mm [21] was considered as a true positive (TP), otherwise as a false positive (FP). As 100% of pedicles were either detected or inferred, sensitivity was 100%
Fig. 2 Pedicle localization procedure. Candidate pixels are illustrated in red, and detected pedicle pixels are illustrated in blue (right) and green (left). a Red candidate pixels within bounding boxes are exam-ined to classify them as belonging to a pedicle or not. b Output of the random forest classifiers, showing pixels probably belonging to a
pedicle. c Using mathematical morphology filtering in each bounding box, detected pixels are grouped into a maximum of two clusters. d In each bounding box, the cluster with the highest score is kept and used to calculate pedicle centers
Fig. 3 Final pedicle centers detected by the proposed method. a Out-come of the pedicle center detection (a pedicle was not detected in T8 and L5) and b final results after the refinement stage used to infer missing pedicles and remove false positive detections (all pedicles were detected)
Table 2 Average values of vertebrae width-to-depth (w/2d) ratios (in mm) from T1 to L5
Vertebra Width-to-depth ratio T1 1.24 T2 1.08 T3 0.97 T4 0.89 T5 0.83 T6 0.78 T7 0.75 T8 0.73 T9 0.71 T10 0.70 T11 0.69 T12 0.69 L1 0.69 L2 0.70 L3 0.71 L4 0.73 L5 0.79
inherently. Precision was calculated as the rate of true posi-tives (TP/(TP + FP) × 100%). Quality of the detected pedicle center positions was evaluated in terms of root-mean-square error (RMSE) with respect to the manually delineated cent-ers. Signed and unsigned frontal and axial rotation differences were computed, comparing detected and manually delineated pedicles. In addition, as 3D reconstructions were performed for all subjects, the calculated VARs were also compared to those obtained from the 3D models.
A subset of 20 scoliotic subjects (Cobb angle = 18.9° ± 7.5°) helped analyzing the influence of manual inputs on pedicle location. The manual inputs were modified ten times for each subject by adding a Gaussian noise with zero mean and stand-ard deviation of 1 mm along the medio-lateral axis and 0.5 mm along the longitudinal axis. These ranges were extracted from a reproducibility analysis performed for this study based on six subjects and two operators who replicated twice their manual inputs. The proposed sensitivity study enabled us to investigate a larger number of subjects and repetitions (N = 200). Standard deviations of inferred pedicle locations along both axes were quantified for each subject and averaged on the full subset.
Results
Pedicle detection precisions were 83%, 85%, and 86%, respec-tively, for T1–T7, T8–T12 and lumbar regions. Detailed infor-mation is presented in Table 3.
Table 4 reports the RMSE distances between detected pedicles and manually delineated ones. A mean RMSE ± SD of 1.2 ± 1.2 mm was achieved over all vertebrae.
Table 5 reports the vertebral frontal rotation difference values. The average signed error ± SD was − 0.2° ± 3.5°, and the average absolute frontal rotation difference was 2.4° ± 2.6°.
Table 6 reports the VAR difference values when using the Stokes method for pedicles from the proposed algorithm and the manual delineations. The average signed error ± SD was − 0.2° ± 3.4°.
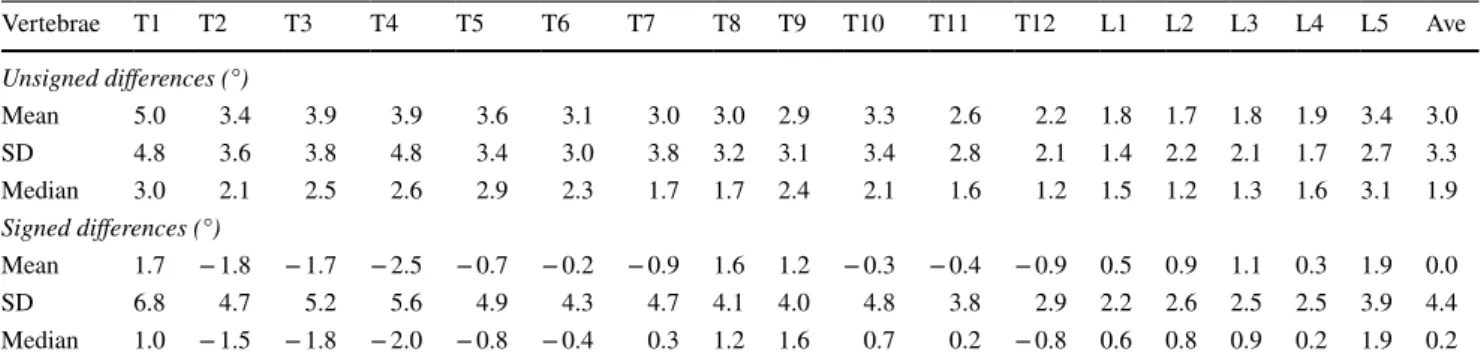
Table 7 reports the VAR difference values between the proposed method using the Stokes method and the 3D spine models. The average of signed differences was 0.0° ± 4.4°.
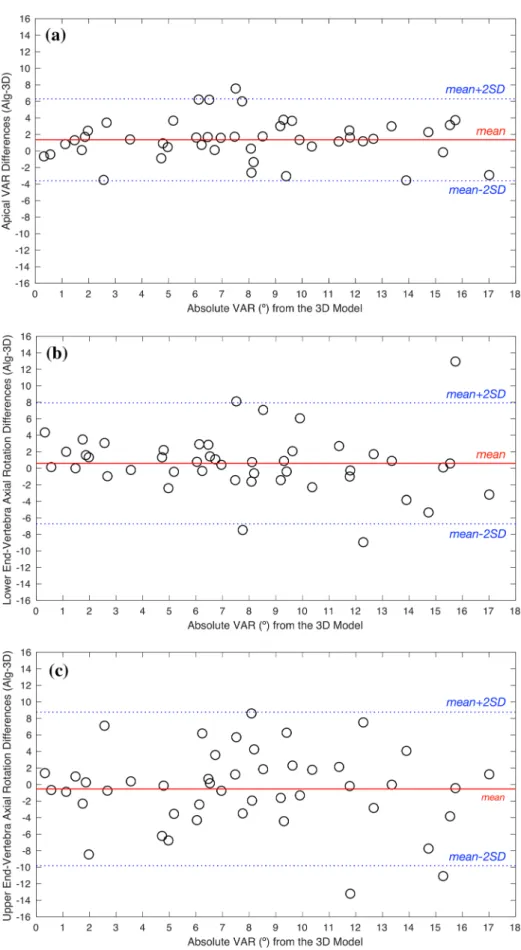
Figure 5 presents the Bland–Altman plots for the average VAR difference values between the proposed algorithm and the 3D spine reconstructions for the apical, and two upper/ lower junctional vertebrae of 46 scoliotic patients with the lowest SD of 2.5° for apical vertebrae.
For the same dataset, Table 8 reports the average VAR differences within and outside the main scoliotic curve. The
Fig. 4 Geometric basis for the measurement of vertebral frontal
rota-tion α
Table 3 The algorithm performance metric on the detected pedicles within the confidence interval (2 mm to the manual reference)
Vertebral level T1 T2 T3 T4 T5 T6 T7 T8 T9 T10 T11 T12 L1 L2 L3 L4 L5 Ave. (T1–L5) Precision (%) 68 85 85 90 84 83 85 89 84 79 84 88 92 95 95 89 57 84
Table 4 Pedicle position differences between automatic detection and manual delineation (RMSE in mm)
Vertebral level Mean SD Median
T1 1.7 1.8 0.7 T2 1.1 1.0 0.7 T3 1.1 1.1 0.7 T4 1.0 1.2 0.6 T5 1.0 1.1 0.6 T6 1.2 1.2 0.8 T7 1.1 1.4 0.6 T8 1.0 1.1 0.6 T9 1.2 1.3 0.7 T10 1.3 1.4 0.8 T11 1.3 1.2 0.9 T12 1.1 1.0 0.9 L1 0.9 0.7 0.7 L2 0.8 0.7 0.6 L3 0.8 0.6 0.6 L4 1.0 1.1 0.7 L5 2.2 1.9 1.7 Ave. (T1–L5) 1.2 1.2 0.7
average of signed differences for these first regions were 0.5° ± 3.8° and − 0.2° ± 4.4°, respectively.
The sensitivity analysis led to a global uncertainty on pedicle location of 2 mm (twice the average standard devia-tion observed on the full subset) on the longitudinal axis and 1.6 mm on the medio-lateral axis. Looking at each subject independently, an uncertainty range from 0.9 to 2.8 mm on the frontal axis and from 1.2 to 3.4 mm for the longitudinal axis were obtained.
Discussion
Vertebral axial rotation is of primary importance for ana-lyzing a scoliotic spine. Although ideally VAR can be obtained in standing position from biplanar radiographs and associated 3D reconstructions, single frontal radio-graphs are still widely used in clinics, with a need for time-consuming manual localization of all pedicles. In this work, a quasi-automated pedicle localization method was proposed, based on an original combination of machine
Table 5 Differences of vertebral frontal rotation values (proposed detection method vs. manual 2D delineation)
Vertebrae T1 T2 T3 T4 T5 T6 T7 T8 T9 T10 T11 T12 L1 L2 L3 L4 L5 Average Unsigned differences (°) Mean 2.2 1.6 2.1 2.1 3.1 2.7 2.4 2.2 3.4 3.5 2.5 2.6 2.0 1.6 1.6 1.7 2.7 2.4 SD 2.4 1.6 2.4 2.3 2.9 2.5 2.5 2.4 3.9 3.2 3.0 2.6 1.8 1.9 1.5 2.4 2.8 2.6 Median 1.2 1.0 1.3 1.4 2.1 2.1 1.9 1.5 2.0 2.8 1.5 2.0 1.4 1.2 1.3 0.9 1.4 1.5 Vertebrae T1 T2 T3 T4 T5 T6 T7 T8 T9 T10 T11 T12 L1 L2 L3 L4 L5 Total Signed differences (°) Mean − 1.5 − 0.1 − 0.1 0.2 0.0 0.1 0.0 0.1 − 2.6 − 0.9 − 0.6 − 0.1 0.2 − 0.2 0.1 0.4 0.7 − 0.2 SD 2.9 2.3 3.2 3.1 4.3 3.7 3.5 3.3 4.5 4.7 3.9 3.7 2.7 2.5 2.2 2.9 3.8 3.5 Median − 0.4 0.2 0.1 0.2 − 0.6 0.0 0.6 0.4 − 0.9 − 0.5 0.0 0.2 0.7 0.1 0.0 0.3 − 0.3 0.0
Table 6 Differences of vertebral axial rotation values (VAR), using the Stokes method (proposed detection method vs. manual 2D delineation)
Vertebrae T1 T2 T3 T4 T5 T6 T7 T8 T9 T10 T11 T12 L1 L2 L3 L4 L5 Ave Unsigned differences (°) Mean 3.3 2.7 2.5 2.5 2.5 2.4 2.2 2.2 1.9 2.3 2.0 1.4 1.2 0.9 0.9 1.1 2.5 2.0 SD 3.9 3.0 3.1 4.2 2.9 2.3 4.2 2.5 2.5 3.3 2.9 2.0 1.1 0.8 0.7 1.0 2.2 2.8 Median 1.7 2.1 1.4 1.2 1.7 2.0 0.9 1.4 1.1 1.1 1.0 0.7 1.0 0.8 0.8 0.8 1.8 1.1 Signed differences (°) Mean 1.6 − 1.0 − 0.6 − 1.2 0.0 − 0.3 − 1.3 0.4 0.2 − 1.1 − 1.1 − 0.4 − 0.1 0.1 0.3 0.1 1.1 − 0.2 SD 4.9 3.9 3.9 4.7 3.9 3.4 4.5 3.3 3.1 3.9 3.3 2.4 1.6 1.2 1.1 1.5 3.2 3.4 Median 0.5 − 0.3 − 0.4 − 0.5 − 0.2 − 0.4 − 0.3 1.1 0.1 0.0 0.2 − 0.1 0.3 0.1 0.5 0.2 1.0 0.1
Table 7 Differences of vertebral axial rotation values (VAR), using the Stokes method with proposed detection method versus 3D reconstruction Vertebrae T1 T2 T3 T4 T5 T6 T7 T8 T9 T10 T11 T12 L1 L2 L3 L4 L5 Ave Unsigned differences (°) Mean 5.0 3.4 3.9 3.9 3.6 3.1 3.0 3.0 2.9 3.3 2.6 2.2 1.8 1.7 1.8 1.9 3.4 3.0 SD 4.8 3.6 3.8 4.8 3.4 3.0 3.8 3.2 3.1 3.4 2.8 2.1 1.4 2.2 2.1 1.7 2.7 3.3 Median 3.0 2.1 2.5 2.6 2.9 2.3 1.7 1.7 2.4 2.1 1.6 1.2 1.5 1.2 1.3 1.6 3.1 1.9 Signed differences (°) Mean 1.7 − 1.8 − 1.7 − 2.5 − 0.7 − 0.2 − 0.9 1.6 1.2 − 0.3 − 0.4 − 0.9 0.5 0.9 1.1 0.3 1.9 0.0 SD 6.8 4.7 5.2 5.6 4.9 4.3 4.7 4.1 4.0 4.8 3.8 2.9 2.2 2.6 2.5 2.5 3.9 4.4 Median 1.0 − 1.5 − 1.8 − 2.0 − 0.8 − 0.4 0.3 1.2 1.6 0.7 0.2 − 0.8 0.6 0.8 0.9 0.2 1.9 0.2
Fig. 5 Bland–Altman plot for the axial rotation of apical vertebrae (a), lower junctional vertebrae (b), and upper junc-tional vertebrae (c) of 46 sco-liotic patients as illustrated in black circles. (Alg = algorithm, 3D = 3D reconstruction)
learning, image processing and statistical shape modeling. Stokes method was then used for VAR estimation.
The original formulation of visual descriptors used by the classifiers proved to be very efficient for pedicle detection. On the other hand, the refinement strategy based on statisti-cal shape modeling and image processing made the algo-rithm robust to false detections. Exploiting a 2D statistical shape model also provided the a priori knowledge required for estimating missing pedicles; hence, a 100% pedicle center detection sensitivity was achieved. When considering a distance threshold of 2 mm, a localization precision of 84% was achieved after the refinement stage, which is promising compared to the respective sensitivity and precision val-ues of 77% and 88% before the refinement stage. Precision decreased after refinement because statistical estimates of missing values were then taken into account. Overall, after the refinement step, average pedicle localization RMSE was limited to 1.2 ± 1.2 mm. As this method has been trained on frontal radiographs acquired with the EOS system, a replica-tion study with maybe another training might be necessary before applying it on radiographs acquired with a different radiographic system.
To the best of our knowledge, the presented method has been more extensively validated than the methods available in the literature, by considering each thoracic and lumbar vertebra on a reasonably sized cohort including pathologic subjects. For instance, Doré et al. [14] tested their approach of pedicle segmentation and vertebral frontal rotation assess-ment on T1–L4 of only five scoliotic patients. In [16], VARs were estimated from segmented pedicles (T4–L4) on frontal radiographs of only 12 scoliotic subjects, and in [18], the authors focused on L1–L3 left pedicles of 21 subjects.
In addition, these methods were based on either an exten-sive manual initialization of each pedicle location [14, 16] or a pixel-wise examination of the image [18] (resulting in a potentially large computational cost). In [14], poorly visible pedicles were a priori discarded, and in [16] all pedicles in their dataset were visible. The proposed method did not have these limitations, as a fast initialization was proposed with few landmarks for the full spine, and the derived statistical shape model could deal with poorly visible pedicles. In addi-tion, the sensitivity of pedicle location to the limited manual
inputs has been analyzed. It appeared to be very low, with a global uncertainty of pedicle location of less than 2 mm in both longitudinal and medio-lateral axes.
The proposed method showed limited number of false positives in the lumbar region. The thoracic region was more challenging due to anatomical structure superimpositions, which could generate shadow artifacts with visual appear-ance similar to pedicles or cause poor contrast. Axial rota-tion could also be higher in the thoracic than in the lumbar region, significantly altering pedicle projection in frontal radiographs. Based on our experiments, missed-detections could typically occur on poorly visible pedicles or from mis-placement of the search area during the initialization.
Moreover, when using Stokes method for VAR estima-tion, comparison between quasi-automated pedicle detec-tion and manual pedicle delineadetec-tion showed a mean differ-ence of 1.2 ± 1.2 mm, for all vertebrae. These differdiffer-ences were within reported uncertainty of Stokes method. There-fore, from a single frontal X-Ray, VAR could be estimated with the proposed method.
Finally, among the works aiming to infer VAR from frontal images, none has compared their results with VAR obtained from a 3D reconstruction of the spine. However, this is essential to assess the relevance of such measurement from a single frontal X-Ray. The bias of signed values was negligible (Table 7). The standard deviation of VAR differ-ences between the proposed algorithm and the 3D recon-struction was 1° higher than the standard deviation obtained when comparing our method to the manual 2D method (4.4° and 3.4°, respectively). One reason is that in the Stokes method, the vertebral width-to-depth ratio was set to aver-age values, and hence not patient specific. Therefore, VARs computed from the proposed method were affected by ver-tebral shape variability, which is accounted for in 3D recon-structions. Regarding VAR differences between the proposed method and 3D reconstructions of specific vertebrae in the main curve (apical vertebra and junctional vertebrae), the average signed error of 1.3° ± 2.5° was achieved for apical vertebrae. This value for the upper and lower end vertebrae was − 0.5° ± 4.6° and 0.6° ± 3.7°, respectively. The error was higher in T1–T7, and hence higher average error for upper end vertebrae was expected.
Conclusion
The proposed quasi-automatic pedicle detection method enables a reliable vertebral rotations estimation from a sin-gle frontal radiograph when 3D reconstruction is not avail-able. The proposed method can be used as a standalone vertebral rotation estimation tool, and has potential appli-cations toward the automation of 3D spine reconstructions.
Table 8 Difference of VAR values (proposed algorithm–3D recon-struction) in (°)
Vertebrae Within the main scoliotic
curve Outside the main scoliotic curve
Mean 0.5 − 0.2
SD 3.8 4.4
The proposed method could also be extended to other ana-tomical structures in the spine.
Acknowledgements The authors are grateful to the ParisTech Biome-cAM chair program on subject-specific musculoskeletal modeling for funding (with the support of ParisTech and Yves Cotrel Foundations, Société Générale, Proteor and Covea).
Compliance with ethical standards
Conflict of interest The authors have no conflicts of interest to declare.
References
1. Illés TS, Burkus M, Somoskeőy S et al (2017) The horizontal plane appearances of scoliosis: what information can be obtained from top-view images? Int Orthop. https ://doi.org/10.1007/s0026 4-017-3548-5
2. Illés TS, Lavaste F, Dubousset JF (2019) The third dimension of scoliosis: the forgotten axial plane. Orthop Traumatol Surg Res 105:351–359. https ://doi.org/10.1016/j.otsr.2018.10.021
3. Humbert L, De Guise JA, Aubert B et al (2009) 3D reconstruc-tion of the spine from biplanar x-rays using parametric models based on transversal and longitudinal inferences. Med Eng Phys 31:681–687. https ://doi.org/10.1016/j.meden gphy.2009.01.003
4. Vergari C, Gajny L, Courtois I et al (2019) Quasi-automatic early detection of progressive idiopathic scoliosis from biplanar radiography: a preliminary validation. Eur Spine J. https ://doi. org/10.1007/s0058 6-019-05998 -z
5. Skalli W, Vergari C, Ebermeyer E et al (2017) Early detection of progressive adolescent idiopathic scoliosis. Spine 42:823–830.
https ://doi.org/10.1097/BRS.00000 00000 00196 1
6. Mainard-Simard L, Lan L, Fort D (2017) The advantages of 3D imagery in diagnosing and supervising children’s and teenagers’ scoliosis. Arch Pédiatr 24:1029–1035 (in French). https ://doi. org/10.1016/j.arcpe d.2017.07.008
7. Ferrero E, Lafage R, Diebo BG et al (2017) Tridimensional analy-sis of rotatory subluxation and sagittal spinopelvic alignment in the setting of adult spinal deformity. Spine Deform 5:255–264.
https ://doi.org/10.1016/j.jspd.2017.01.003
8. Rehm J, Germann T, Akbar M et al (2017) 3D-modeling of the spine using EOS imaging system: inter-reader reproducibility and reliability. PLoS One 12:e0171258. https ://doi.org/10.1371/journ al.pone.01712 58
9. Newton PO, Khandwala Y, Bartley CE et al (2016) New EOS imaging protocol allows a substantial reduction in radiation expo-sure for scoliosis patients. Spine Deform 4:138–144. https ://doi. org/10.1016/j.jspd.2015.09.002
10. Lebel DE, Al-Aubaidi Z, Shin E-J et al (2013) Three dimen-sional analysis of brace biomechanical efficacy for patients with
AIS. Eur Spine J 22:2445–2448. https ://doi.org/10.1007/s0058 6-013-2921-3
11. Courvoisier A, Garin C, Vialle R, Kohler R (2015) The change on vertebral axial rotation after posterior instrumentation of idi-opathic scoliosis. Child Nerv Syst 31:2325–2331. https ://doi. org/10.1007/s0038 1-015-2891-3
12. Ilharreborde B, Steffen JS, Nectoux E et al (2011) Angle measure-ment reproducibility using EOS three-dimensional reconstructions in adolescent idiopathic scoliosis treated by posterior instrumenta-tion. Spine 36:E1306–E1313. https ://doi.org/10.1097/BRS.0b013 e3182 29354 8
13. Stokes IA, Bigalow LC, Moreland MS (1986) Measurement of axial rotation of vertebrae in scoliosis. Spine 11:213–218 14. Doré V, Duong L, Cheriet F, Cheriet M (2007) Towards
seg-mentation of pedicles on posteroanterior x-ray views of scoliotic patients. In: Kamel M, Campilho A (eds) Image analysis and rec-ognition: 4th international conference, ICIAR 2007, Montreal, proceedings. Springer, Berlin, pp 1028–1039
15. Zhang J, Shi X, Wang Y, et al (2010) Snake-based approach for segmenting pedicles in radiographs and its application in three-dimensional vertebrae reconstruction. In: 2010 IEEE international conference on image processing. IEEE, pp 2569–2572
16. Zhang J, Lou E, Hill DL et al (2010) Computer-aided assessment of scoliosis on posteroanterior radiographs. Med Biol Eng Com-put 48:185–195. https ://doi.org/10.1007/s1151 7-009-0556-7
17. Kumar S, Nayak KP, Hareesh KS (2012) Semiautomatic method for segmenting pedicles in vertebral radiographs. Proc Technol 6:39–48. https ://doi.org/10.1016/j.protc y.2012.10.006
18. Cunha P, Moura DC, Barbosa JG (2012) Pedicle detection in planar radiographs based on image descriptors. In: Campilho A, Kamel M (eds) Image analysis and recognition: 9th international conference, ICIAR 2012, Aveiro, proceedings, part II. Springer, Berlin, pp 278–285
19. Dalal N, Triggs B (2005) Histograms of oriented gradients for human detection. In: Proceedings—2005 IEEE computer society conference on computer vision and pattern recognition. CVPR, Washington, DC, pp 886–893
20. Ebrahimi S, Gajny L, Skalli W, Angelini E (2019) Vertebral corners detection on sagittal x-rays based on shape modelling, random forest classifiers and dedicated visual features. Comput Methods Biomech Biomed Eng Imaging Vis 7:132–144. https :// doi.org/10.1080/21681 163.2018.14631 74
21. André B, Dansereau J, Labelle H (1992) Effect of radiographic landmark identification errors on the accuracy of three-dimen-sional reconstruction of the human spine. Med Biol Eng Comput 30:569–575. https ://doi.org/10.1007/BF024 46787
Affiliations
Shahin Ebrahimi1 · Laurent Gajny1 · Claudio Vergari1 · Elsa D. Angelini2,3 · Wafa Skalli1
1 Institut de Biomécanique Humaine Georges Charpak, Arts et
Métiers Institute of Technology, Paris, France
2 LTCI, Department Image-Data-Signal, Telecom ParisTech,
Paris, France
3 ITMAT Data Science Group, NIHR Imperial BRC, Imperial