FINAL REPORT
DETECTION OF ICE FRONT INITIATION ON THE PEACE
RIVER IN NORTHERN ALBERTA
Freeze-up 2013-2014
REFERENCE NO. CO 73797
Presented to:
British Columbia Hydro and Power Authority
Prepared by:
Monique Bernier, Yves Gauthier, Jimmy Poulin Antoine Padel and Helena Los
Institut national de la recherche scientifique Centre Eau Terre Environnement
490, rue de la Couronne Québec (Québec) G1K 9A9
Research report R1559
iii
TABLE OF CONTENT
List of tables ... v
List of figures ... vii
1 Project background ... 1
2 Study objectives ... 2
3 Scope of services, deliverables and schedule ... 3
4 Activities conducted ... 5
5 Satellite data ... 6
6 Extracting Ice information from satellite imagery ... 15
7 Description of the ice processes during 2013-2014 freeze-up ... 17
8 Ice types - 2012 vs 2013 ... 25
9 Ice lodgement - 2012 vs 2013 ... 28
10 Hydraulic submergence of the Vermilion Chutes - 2012 vs 2013 ... 30
11 Observation of ice floes upstream of vermillion chutes ... 32
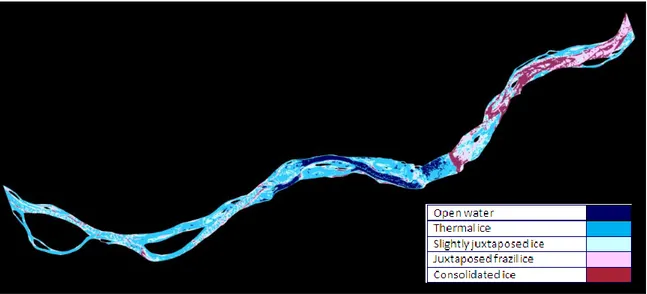
12 Conclusion ... 34
v
LIST OF TABLES
Table 1 Deliverables description... 4
Table 2 Schedule of delivery (modified according to contract extension) ... 4
Table 3 List of activities conducted during the contract ... 5
Table 4 List of RADARSAT-2 images used in the project. ... 7
Table 5 List of MODIS images used in the project ... 11
Table 6 List of Landsat-8 images used in the project ... 13
vii
LIST OF FIGURES
Figure 1: Map of study area. ... 2 Figure 2: Approximate coverage of RADARSAT-2 images in 2013 ... 6 Figure 3: Enhanced Radarsat-2 image of November 30th, 2013. RADARSAT-2 ... 8 Figure 4: Tiling of MODIS images over North America. The two colored tiles are covering the area shown on the right. ... 9 Figure 5: Orbits from the Terra sensor on November 6th, 2013. Hours are in UTC time. ... 9 Figure 6: MODIS-TERRA composite over the Peace River on November 6th, 2013. ... 10 Figure 7: Extract of MODIS Terra image on November 30th, 2013. The area upstream from the Vermillion Chutes is still free of ice (black). ... 10 Figure 8: Coverage of Landsat-8 images. From left to right, Paths #47, #46, #45 and #44. ... 12 Figure 9: Landsat quicklook of November 10th, 2013 downstream of Vermillion Chutes... 13 Figure 10: Frequency of satellite coverage (cloud free) for each section from November 2013 to February 2014. ... 14 Figure 11: Map of the frequency of satellite coverage (cloud free) for km 800 to 950, from November 2013 to February 2014... 14 Figure 12: Radar ice map from December 7th, 2013 over the Vermillion Chutes area. ... 15 Figure 13 Extract of the file detailing visual detection of ice or water on 1 km sections on MODIS images during freeze-up 2013. ... 16 Figure 14: Air temperatures at Fort Vermillion’s weather station. Each star represents a RS-2 image acquisition. ... 17 Figure 15: MODIS image and RS-2 ice map from November 6th, 2013 (km 810-920). ... 18
viii
Figure 16: MODIS and Landsat-8 images from November 10th, 2013 (km 890-940). ... 18
Figure 17: MODIS image and RS-2 ice map from November 16th, 2013 (km830-880). ... 19
Figure 18: MODIS image and RS-2 ice map from November 18th/17th, 2013 (km 860-945). ... 20
Figure 19: MODIS image from November 25th, 2013 (km 890-945). ... 21
Figure 20: Left: Landsat-8 image from November 24th, 2013 (km 550-580). Right: MODIS image of November 29th, 2013. ... 21
Figure 21: MODIS image and RS-2 ice map from November 29th/30th, 2013 (km 875-925). ... 22
Figure 22: MODIS image and RS-2 ice map from November 29th/30th, 2013 (km 675-745). ... 22
Figure 23: MODIS image and RS-2 ice map from December 6th/7th 2013 (km 892-924). ... 23
Figure 24: Landsat-8 image from December 10th, 2013 (km 445-485). ... 24
Figure 25: Landsat-8 image from December 10th, 2013 (km 890-914). ... 24
Figure 26 : Ice maps from December 27th, 2013 (A-B-C) and December 7th, 2013 (D) ... 25
Figure 27: Ice types around the Vermillion Chutes from the RS-2 image of December 7th 2013. 26 Figure 28 : RS-2 image of December 7th, 2013 (km 915-935). ... 26
Figure 29 : Comparison of dominant ice type over 1 km sections between 2012/2013 and 2013/2014. ... 27
Figure 30: Comparison of skim ice lodgement for 2012 and 2013 freeze-up ... 28
Figure 31 : Ice lodgement timing upstream of the Vermillion chutes in 2013. The MODIS image of November 17th was cloudy. ... 29
Figure 32 : RS-2 image of November 17th, km 888-903. RADARSAT-2 ... 29
Figure 33 : Sequence of RS-2 images over the Vermillion chutes area during 2012-2013 freeze-up. RADARSAT-2 ... 30
ix
Figure 34 : Sequence of RS-2 images over the Vermillion chutes area during 2013-2014 freeze-up. RADARSAT-2 ... 31 Figure 35 : Sequence of Landsat-8 images over the Vermillion chutes area during 2013-2014 freeze-up. ... 31 Figure 36: Ice floes on Landsat-8 images upstream of the Vermillion Chutes on December 19th,
January 27th and February 14th 2014. ... 32
1
1 PROJECT BACKGROUND
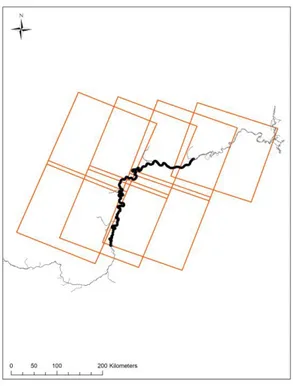
To gain some insight of the freeze-up process and document dominant ice types in the Tompkins Landing to Vermilion Chutes reach (Figure 1) satellite images have been used during the freeze-up of 2012-2013. 14 RADARSAT-2 images and 40 MODIS images have permitted to make some very interesting observations:
- The timing and the location of the lodgement of ice floes and the initiation of the Peace River ice front was determined to within a one day period.
- An important finding was that the ice front or hanging dam downstream of the Chutes does not have to submerge the Chutes before the ice cover proceeds upstream to areas of interest such as Fort Vermilion and the Town of Peace River. It appears that the ice can lodge upstream of the Chutes independently of the downstream ice front.
- Despite that the ice lodged a short distance upstream of the Chutes early in the winter cutting off the majority of the ice supply; the Chutes were eventually submerged by the accumulation of ice in the hanging dam downstream of the Chutes. It was apparent from the imagery that frazil slush was emerging from the upstream end of the open lead upstream of the Chutes, leading to the conclusion that this ice was being transported underneath the upstream ice cover. Since there is a lack of frazil generation zones for a few hundred kilometers upstream of the Chutes, the ice had to be coming from long distances.
- Detailed ice type classifications were performed of the Peace River from km 478 (upstream of Sunny Valley) to km 943 (downstream of the Vermilion Chutes).
2
-
- Figure 1: Map of study area.
2 STUDY OBJECTIVES
To confirm the observations of the 2012-2013 study about: - Dominant ice types
- Ice lodgement timing and location
- Hydraulic submergence of the Vermillion Chutes
3
3 SCOPE OF SERVICES, DELIVERABLES AND SCHEDULE
The research institute (INRS) was to provide a second year of satellite monitoring and analysis for detection of ice front initiation on the Peace River in Northern Alberta by using RADARSAT-2, MODIS and Landsat-8 data.
11 RADARSAT-2 images were acquired in November and December of 2013 to monitor the ice in the Vermilion Rapids area, completing the 14 acquisitions of 2012. The images were obtained from the Canadian Space Agency (CSA) free of charge and upon availability due to qualification under a SOAR research proposal with INRS. This research proposal has already been accepted by CSA. In addition to RADARSAT-2 data, INRS was to process and analyse up to 100 MODIS satellite images (visible light spectrum) and 39 Landsat-8 images to help correlate with the RADARSAT-2 data and provide information in January and February 2014.
4
Table 1 Deliverables description
No. Description
1. Enhanced RADARSAT-2 images (geometrically corrected, filtered, contrasted) acquired during the period of interest (11 images)
2. MODIS images acquired during the period of interest and subsetted over the study area (100 images)
3. LANDSAT-8 images acquired during the period of interest over the Peace River (39 images)
4. Ice/No ice detection on 1 km sections, from KM 475 to KM 950, from all images
5. Ice maps produced from image interpretation and classification of RADARSAT-2 and Landsat-8 images
6. Validation
7. Estimation of percentage of frazil floes on RS-2 and Landsat-8 images
8. Description of the ice processes in the Vermillion Chutes area, from all images 9. Scientific paper and Powerpoint presentation for the IGARSS 2014 Conference 10. Final Report
Table 2 Schedule of delivery (modified according to contract extension)
Deliverables 2013 2014
Nov Dec Jan Feb Mar Apr May Jun Jul Aug Sep Oct Nov
Image acquisition
Image
pre-processing #1, #2,#3
Image analysis and
ice mapping #4, #5, #6, #7 #8
Reporting and
5
4 ACTIVITIES CONDUCTED
Table 3 List of activities conducted during the contract
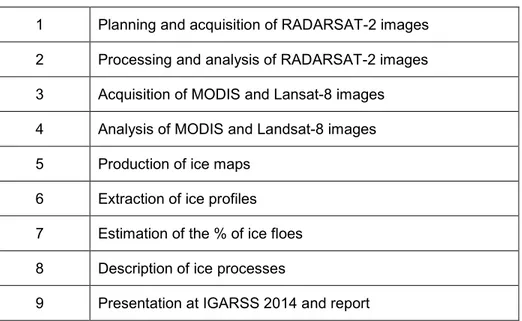
1 Planning and acquisition of RADARSAT-2 images 2 Processing and analysis of RADARSAT-2 images 3 Acquisition of MODIS and Lansat-8 images 4 Analysis of MODIS and Landsat-8 images 5 Production of ice maps
6 Extraction of ice profiles 7 Estimation of the % of ice floes 8 Description of ice processes
6
5 SATELLITE DATA
RADARSAT-2 images
In 2012, RS-2 image acquisitions started on November 11th. At that time, ice lodgement had already started in the study area. In 2013, image acquisition was therefore planned to start in October. However, due to mild weather, we postponed the first RS-2 acquisition to November 6th. For monitoring the 2013-2014 ice freeze-up, we had 11 images still available from the quota with the Canadian Space Agency. Images had to be planned as much in advance as possible to avoid conflicts with other users. The planning was made in order to cover the area of the Vermillion Chutes with quadpol data (similar to 2012) and upstream through Tompkins Landing with Standard mode data (Figure 2).
Figure 2: Approximate coverage of RADARSAT-2 images in 2013
Table 4 shows the list and characteristics of the 11 RADARSAT-2 images used during freeze-up 2013.
7
Table 4 List of RADARSAT-2 images used in the project.
Date Local Time
Coverage [km] (from-to) Mode Orbit Approx. Incidence angles [degrees] Spatial resolution 2013-11-06 06:58 641-856 S6 DES 41.7-46.2 25m 2013-11-06 18 :25 864-924 FQ20W ASC 39.4 - 40.7 10m 2013-11-16 07 :06 641-883 S4 DES 34.0 - 39.3 25m 2013-11-17 18 :04 873-934 FQ3W ASC 21.1 - 22.8 10m 2013-11-30 06 :58 642-857 S6 DES 41,7 – 46,2 25m 2013-11-30 18:25 865-924 SQ20W ASC 39.4 - 40.7 25m 2013-12-07 18 :21 877-934 FQ17W ASC 36.6 - 37.9 10m 2013-12-10 18:33 731-913 S6 ASC 41,7 - 46,2 25m 2013-12-14 6:49 590-809 S8 DES 48.5 - 52.1 25m 2013-12-14 18:17 865-925 FQ13W ASC 32.6 – 34.0 10m 2013-12-27 18:37 586-835 S6 ASC 41,7 - 46,2 25m
Note 1 Vermilion Chutes: Km 916;
Note 2 SQ= Standard quadpol VH) mode, FQ= Fine Quadpol mode (HH-HV-VV-VH), S= Standard mode (HH-HV)
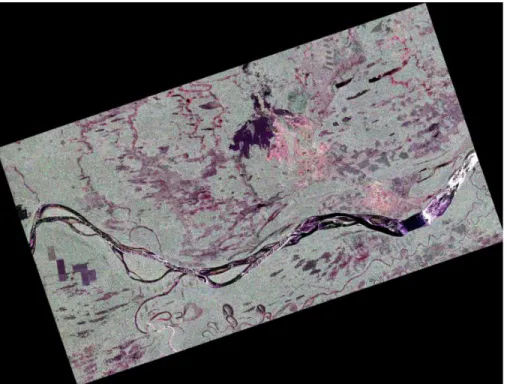
All RADARSAT-2 images were orthorectified, filtered and enhanced for permitting a “photointerpretation” by the ice engineer at BC Hydro. A compressed version of this product is provided with the report (USB stick). An example is shown in Figure 3.
8
RADARSAT-2 Data and Products © MacDonald, Dettwiler and Associates Ltd. (2012) – All Rights Reserved. RADARSAT is an official trademark of the Canadian Space Agency.
Figure 3: Enhanced Radarsat-2 image of November 30th, 2013. RADARSAT-2
MODIS images
To complete the observations from RADARSAT-2 images, optical MODIS images (250m resolution) were also acquired free of charge. MODIS images are acquired daily by Terra (around 10:00am) and Aqua satellites (around 2:00pm). In this project, we use false color subsets of bands 7 (2155 nm), 2 (876 nm) and 1 (670 nm), distributed on
http://rapidfire.sci.gsfc.nasa.gov. Two predefined tiles (r16c06 and r16c07) are extracted
to cover the Peace River (Figure 4).
All enhanced RS-2 images are provided as digital files with this report. RADARSAT-2 Data and Products © MacDonald, Dettwiler and Associates Ltd. (2012) – All Rights Reserved. RADARSAT is an official trademark of the Canadian Space Agency.
9
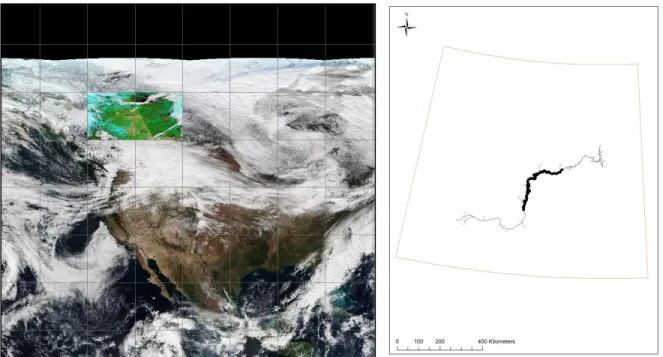
Figure 4: Tiling of MODIS images over North America. The two colored tiles are covering the area shown on the right.
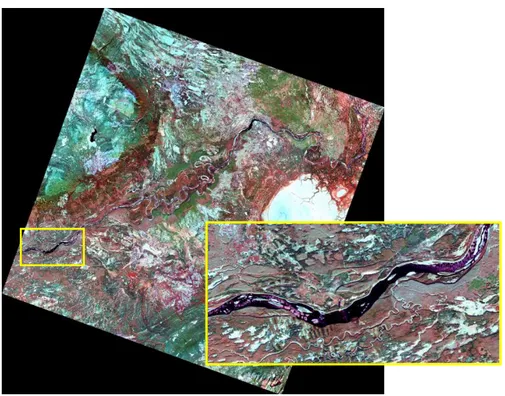
To cover both tiles, images from two parallel orbits may be used (Figure 5). For example, in the case of November 6th 2013, the western tile was cover mostly from the 20:10 orbit (11:10am local) and the eastern tile was covered entirely from the 18:35 orbit (9:35am local). On the composite image (Figure 6) an oblique delineation can be seen between the two orbits.
10
Figure 6: MODIS-TERRA composite over the Peace River on November 6th, 2013.
This information is relevant to determine the exact time at which a specific section of the river was imaged. Figure 7 shows the level of detailed which can be obtained from a 250m MODIS product.
Figure 7: Extract of MODIS Terra image on November 30th, 2013. The area upstream from the Vermillion Chutes is still free of ice (black).
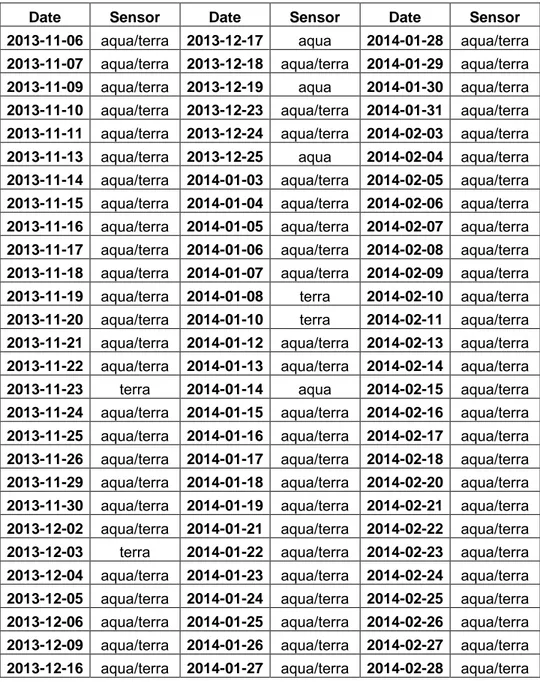
From early November 2013 to end of February 2014, 84 days were cloud free or partially cloud free over the study area. Table 5 presents the list of the corresponding images.
11
Table 5 List of MODIS images used in the project
Date Sensor Date Sensor Date Sensor
2013-11-06 aqua/terra 2013-12-17 aqua 2014-01-28 aqua/terra
2013-11-07 aqua/terra 2013-12-18 aqua/terra 2014-01-29 aqua/terra
2013-11-09 aqua/terra 2013-12-19 aqua 2014-01-30 aqua/terra
2013-11-10 aqua/terra 2013-12-23 aqua/terra 2014-01-31 aqua/terra
2013-11-11 aqua/terra 2013-12-24 aqua/terra 2014-02-03 aqua/terra
2013-11-13 aqua/terra 2013-12-25 aqua 2014-02-04 aqua/terra
2013-11-14 aqua/terra 2014-01-03 aqua/terra 2014-02-05 aqua/terra
2013-11-15 aqua/terra 2014-01-04 aqua/terra 2014-02-06 aqua/terra
2013-11-16 aqua/terra 2014-01-05 aqua/terra 2014-02-07 aqua/terra
2013-11-17 aqua/terra 2014-01-06 aqua/terra 2014-02-08 aqua/terra
2013-11-18 aqua/terra 2014-01-07 aqua/terra 2014-02-09 aqua/terra
2013-11-19 aqua/terra 2014-01-08 terra 2014-02-10 aqua/terra
2013-11-20 aqua/terra 2014-01-10 terra 2014-02-11 aqua/terra
2013-11-21 aqua/terra 2014-01-12 aqua/terra 2014-02-13 aqua/terra
2013-11-22 aqua/terra 2014-01-13 aqua/terra 2014-02-14 aqua/terra
2013-11-23 terra 2014-01-14 aqua 2014-02-15 aqua/terra
2013-11-24 aqua/terra 2014-01-15 aqua/terra 2014-02-16 aqua/terra
2013-11-25 aqua/terra 2014-01-16 aqua/terra 2014-02-17 aqua/terra
2013-11-26 aqua/terra 2014-01-17 aqua/terra 2014-02-18 aqua/terra
2013-11-29 aqua/terra 2014-01-18 aqua/terra 2014-02-20 aqua/terra
2013-11-30 aqua/terra 2014-01-19 aqua/terra 2014-02-21 aqua/terra
2013-12-02 aqua/terra 2014-01-21 aqua/terra 2014-02-22 aqua/terra
2013-12-03 terra 2014-01-22 aqua/terra 2014-02-23 aqua/terra
2013-12-04 aqua/terra 2014-01-23 aqua/terra 2014-02-24 aqua/terra
2013-12-05 aqua/terra 2014-01-24 aqua/terra 2014-02-25 aqua/terra
2013-12-06 aqua/terra 2014-01-25 aqua/terra 2014-02-26 aqua/terra
2013-12-09 aqua/terra 2014-01-26 aqua/terra 2014-02-27 aqua/terra
2013-12-16 aqua/terra 2014-01-27 aqua/terra 2014-02-28 aqua/terra
All MODIS images are provided as digital files with this report.
Landsat-8 images
In addition to RS-2 and MODIS images, Landsat-8 images were used for this project. Landsat 8 is an American Earth observation satellite launched on February 11, 2013. It is the eighth satellite in the Landsat program; the seventh to reach orbit successfully. Originally called the Landsat Data Continuity Mission (LDCM), it is a collaboration between NASA and the United States Geological Survey (USGS). Landsat 8 operates in
12
the visible, near-infrared, short wave infrared and thermal infrared spectrums. Spatial resolution in the visible to shortwave infrared is 15m. Images are freely available through the USGS earth Explorer website (http://earthexplorer.usgs.gov/). In this project, we have only used the georeferenced quicklook product. It is faster to retrieve, transfer and display in the context of near real-time monitoring, while still providing the necessary level of information.
Landsat-8 images are acquired on the same orbit every 16 days around 10:00 am local time. The study area is covered by four different overlapping orbits (seven image frames) (Figure 8). Therefore, some sections of the river may be covered more than once every 2 weeks. Figure 9 shows an example of a Landsat image quicklook.
Figure 8: Coverage of Landsat-8 images. From left to right, Paths #47, #46, #45 and #44. From November 2013 to February 2014, Landsat-8 acquisitions were found to be cloud-free or partially-cloud-free on 19 occasions (19 days / 31 possible) (Table 6). Only two days in November permitted to see some sections of the river. Also note that as seen earlier in Figure 8, more than one image frame can be processed for a single day.
13
Figure 9: Landsat quicklook of November 10th, 2013 downstream of Vermillion Chutes. Table 6 List of Landsat-8 images used in the project
Date Coverage (km) 2013-11-10 893-950 2013-11-24 475-798/804-808/915-916 2013-12-03 475-477/491-493/495-498/526-527/655-662/671-679/835-850 2013-12-10 475-913 2013-12-12 907-950 2013-12-19 502-641/646-662/672-679/718-950 2013-12-28 892-950 2014-01-02 587-605/616-690/694-736/750-788 2014-01-04 475-662/671-679/712-950 2014-01-13 892-950 2014-01-18 530-537/564-607/615-738/749-791 2014-01-20 475-516/630-662/671-679/715-754 2014-01-27 475-913 2014-01-29 891-950 2014-02-03 572-583/589-605/617-644/647-648/650-650/653-661/671-674/725-735 2014-02-05 475-661/671-680/712-807/922-950 2014-02-12 815-833 2014-02-14 891-950 2014-02-21 475-661/671-680/712-807/878-950 2014-02-28 475-950
14
All enhanced Landsat-8 quicklooks are provided as digital files with this report.
Total satellite coverage
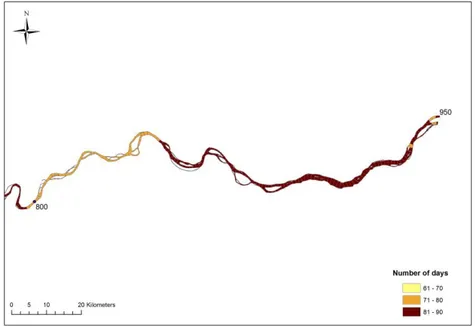
Combining the three sources of satellite data, we have calculated the frequency of coverage for each 1km section of the study area (km 475-950). Figure 10 shows that from November 1rst, 2013 to February 28th, 2014, it was possible to see each section on at least 60 of the 120 days, using MODIS, Landsat-8 and Radarsat-2. Figure 11 shows the information around the Vermillion Chutes in a map format. All maps are provided as digital files with this report.
Figure 10: Frequency of satellite coverage (cloud free) for each section from November 2013 to February 2014.
Figure 11: Map of the frequency of satellite coverage (cloud free) for km 800 to 950, from November 2013 to February 2014.
15
6 EXTRACTING ICE INFORMATION FROM SATELLITE
IMAGERY
RADARSAT-2 images
Each RADARSAT-2 image has been processed with the IceMAP-R algorithm (Ice Mapping Automated Procedure from Radar data) from INRS. Figure 12 shows an example of these ice maps.
Figure 12: Radar ice map from December 7th, 2013 over the Vermillion Chutes area. MODIS images
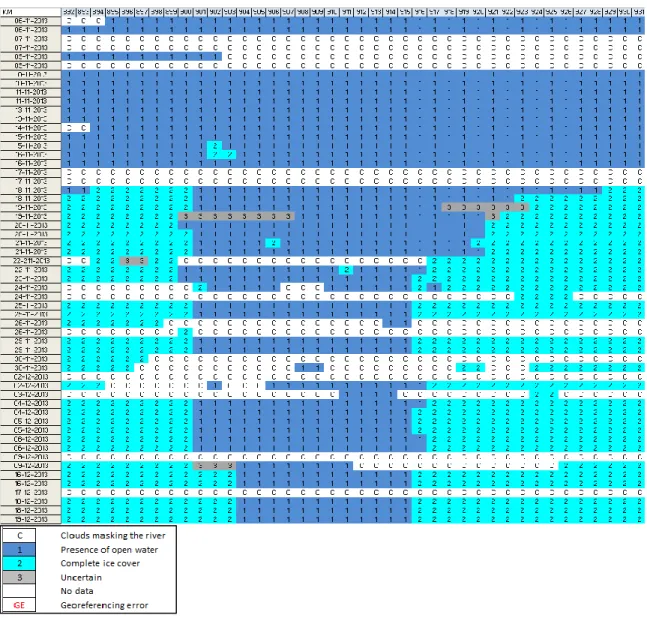
For each cloud free or partially cloud free MODIS image (Terra and Aqua), we have visually determined the presence or absence of ice or water on 1 km sections along the reaches of the study area. An extract of km 892-931, between November 6th and December 19th, 2013, is presented in Figure 13. A value of 1, means that the presence of water was visually detected in the section; a value of 2, means that only ice was detected in the section.
The complete profile for km 475-950 (November 2013 – February 2014) is provided as a digital file with this report.
16
Figure 13 Extract of the file detailing visual detection of ice or water on 1 km sections on MODIS images during freeze-up 2013.
Landsat-8 images
Like with MODIS, for each cloud free or partially cloud free Landsat-8 image, we have also visually determined the presence or absence of ice or water on 1 km sections along the reaches of the study area.
The complete profile for km 475-950 (November 2013 – February 2014) is provided as a digital file with this report.
17
7 DESCRIPTION OF THE ICE PROCESSES DURING 2013-2014
FREEZE-UP
From the Environment Canada data at the Fort Vermillion weather station, air temperatures started to be consistently below 0ºC at the end of October 2013 (Figure 14).
Figure 14: Air temperatures at Fort Vermillion’s weather station. Each star represents a RS-2 image acquisition.
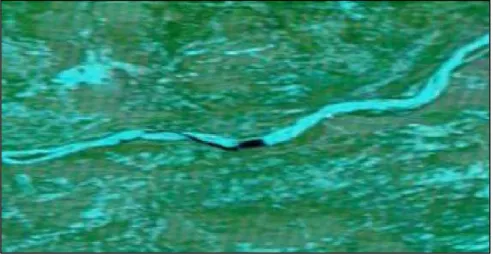
MODIS and RS-2 images from early November confirm the absence of ice over the study area (Figure 15). On the RS-2 ice maps, what is classified as ice is rather exposed ground (sand banks, shore), as well as the rough waters of the Vermillion fall and rapids. On November 10th, a MODIS and a Landsat-8 image show that floating ice floes have appeared in the area of the Vermillion Chutes (Figure 16).
Extract from the Alberta Environment river ice information report of November 26th, 2013:
November 14
Contributed observations showed that the channel was still open with some border ice and that thin, frazil pans were present at Fort Vermilion (km 832).
18
Figure 15: MODIS image and RS-2 ice map from November 6th, 2013 (km 810-920).
Figure 16: MODIS and Landsat-8 images from November 10th, 2013 (km 890-940). Floating ice pans (reddish)
19
On November 16th, the MODIS image start to show more signs of border ice around islands but it is with the RS-2 image that we detect floating ice floes (Figure 17). On November 17th and 18th, the floes are increasing in density and starting to juxtapose (Figure 18).
Extract from the Alberta Environment river ice information report of November 26th, 2013:
November 17
Tompkins Landing ferry suspended sailing operations for the winter (km 694). November 18
Peace River at Fort Vermilion (km 832) gauging station record indicates freeze-up occurred at approximately 17:30 MST.
November 20
Contributed observations reported the ice cover stopped moving at Atlas Landing near LaCrete (km 755).
November 22
Peace River at Carcajou (km 651) gauging station record indicates freeze-up occurred at approximately 04:45 MST.
20
Figure 18: MODIS image and RS-2 ice map from November 18th/17th, 2013 (km 860-945). On November 25th, a MODIS image shows that the ice cover is now stable around the open water of the Vermillion Chutes area (Figure 19). On November 24th, a Landsat-8 image shows that upstream (near Carcajou), the floating ice is starting to concentrate around km 570 (Figure 20). On November 29th, a MODIS image would also locate the ice front around the same spot (km 570).
Extract from the Alberta Environment river ice information report of November 29th, 2013:
November 29
km 577 – Ice front location at 11:45 MST.
Back in the Vermillion Chutes area, the MODIS image of November 29th show that this area is still under open water (Figure 21). The RS-2 ice map from November 30th confirms. Upstream, both images show a complete/consolidated ice cover (Figure 22).
Ice (light blue)
21
Figure 19: MODIS image from November 25th, 2013 (km 890-945).
Figure 20: Left: Landsat-8 image from November 24th, 2013 (km 550-580). Right: MODIS image of November 29th, 2013.
22
Figure 21: MODIS image and RS-2 ice map from November 29th/30th, 2013 (km 875-925).
23
On December 6th, a MODIS image shows that the Vermillion Chutes are still free of ice. A RS-2 ice map from December 7th confirms but also detects floating slush, particularly between the rapids and the fall (Figure 23).
On December 10th, a Landsat-8 image would place the ice front around km 479 (Figure 24). This image also shows that floating pans are present upstream from the Vermillion rapids (Figure 25).
Extract from the Alberta Environment river ice information report of December 10th, 2013:
December 6 – Satellite image
Ice front estimated to be at km 545 at 07:23 MST. December 8, 2013
Peace River at Sunny Valley (km 491) gauging station record indicates freeze-up occurred at approximately 19:00 MST.
December 9 – Satellite image
Ice front estimated to be at km 479 at 07:07 MST.
24
Figure 24: Landsat-8 image from December 10th, 2013 (km 445-485).
Figure 25: Landsat-8 image from December 10th, 2013 (km 890-914).
According to the ice reports, the ice front is observed south of the study area (km469) on December 13th.
25
8 ICE TYPES - 2012 VS 2013
- From the work on the 2012-2013 RADARSAT-2 images, different ice types have been identified:
- In 2012, consolidated ice was dominant from the observed ice front (at km 534) to km 635. The km 635 to 683 reach was not imaged. In 2013, it shows consolidated ice (Figure 26-A).
- From km 683 (just upstream of Tompkins Landing) to about km 790 (40 km upstream of Fort Vermilion a juxtaposed frazil ice pan ice cover was dominant. There were some minor or very short consolidated, open water and skim ice sections in this reach. Figure 26-B-C shows juxtaposed ice and thermal (skim) ice covers in 2013.
- From km 690 to the lodgement site just upstream of the Vermilion Chutes at km 903, the dominant ice type was skim ice or more precisely juxtaposed skim ice sheets. Smooth skim ice is dominant in 2013 (Figure 26-D).
26
- There was open water for 10 km upstream of the Chutes until at least the last image on Feb 23, 2013 and probably for the rest of the winter. Downstream of the Chutes (km 916) there was a consolidated ice cover for about 10 km. Similar observations are made in 2013 (Figure 27).
Figure 27: Ice types around the Vermillion Chutes from the RS-2 image of December 7th 2013. - Downstream of there to the end of the study reach at km 946 there was some
juxtaposed frazil pans as well as some skim ice reaches. This last reach imaged was too short to determine the dominant ice type downstream of the hanging dam. Same situation in 2013 (Figure 28).
RADARSAT-2 Data and Products © MacDonald, Dettwiler and Associates Ltd. (2012) – All Rights Reserved. RADARSAT is an official trademark of the Canadian Space Agency.
27
In more details, Figure 29 shows the comparison between the longitudinal profiles of the dominant ice types from both years. In 2012-2013, it was clear that consolidated ice dominated reach 1 (up to km 683), as in 2013-2014. On both years, a dominance of juxtaposed ice starts around km 680. However, only in 2013-2014 can we observe that thermal ice and skim ice are also present in this reach. We should note that what the radar ice mapping algorithm classifies as thermal ice could be undisturbed skim ice. In reach 3 (from km 810) the profiles are dominated by skim and thermal ice. However, we clearly see a smoother ice cover in 2013-2014 than in 2012-2013 with less juxtaposed ice and more thermal or smooth skim ice. Reach 4 (downstream of the Vermillion chutes, shows consolidated and juxtaposed ice on both years.
28
9 ICE LODGEMENT - 2012 VS 2013
During the 2012-2013 freeze-up, it has been observed that the ice front did not need to pause and stage up over the Chutes in order for it to continue upstream. It appeared that skim ice sheets could lodge upstream of the Chutes to initiate the ice cover. This reach seems conducive to lodgement because of the many islands and possibly shallow areas and/or a lower gradient in this reach although the bathymetry or water surface slope has never been surveyed in this area.
In the 2013-2014 freeze-up, the phenomenon has been confirmed. Figure 30 shows that for both years:
- the initial ice front is east of the chutes;
- the area between the rapids and the falls is ice free;
- the location of skim ice lodgement upstream of the chutes is the same.
RADARSAT-2 Data and Products © MacDonald, Dettwiler and Associates Ltd. (2012) – All Rights Reserved. RADARSAT is an official trademark of the Canadian Space Agency.
29
In November 2012, the lodgement upstream of the chutes occurred sometime between Nov 9 and Nov 10, according to MODIS images. In 2013, MODIS images seem to tend towards the period between November 16th and 18th (Figure 31). The RS-2 image of November 17th (18:04) clearly shows that the individual ice pans are starting to accumulate at that point.
Figure 31 : Ice lodgement timing upstream of the Vermillion chutes in 2013. The MODIS image of November 17th was cloudy.
RADARSAT-2 Data and Products © MacDonald, Dettwiler and Associates Ltd. (2012) – All Rights Reserved. RADARSAT is an official trademark of the Canadian Space Agency.
Figure 32 : RS-2 image of November 17th, km 888-903. RADARSAT-2
Nov.16, 2013
30
10 HYDRAULIC SUBMERGENCE OF THE VERMILION CHUTES -
2012 VS 2013
Figure 33 shows that in 2012, from Nov 11 to Nov 18 the ice front advanced upstream towards the Chutes and arrived at the downstream end of Vermilion Falls by Nov 18. The ice front stalled between Nov 18 and Nov 25 just downstream of the Vermilion Falls. However, the Dec 1 image showed that the ice front had submerged the Vermilion Falls, and by Dec 22 it had submerged the Vermilion Rapids.
RADARSAT-2 Data and Products © MacDonald, Dettwiler and Associates Ltd. (2012) – All Rights Reserved. RADARSAT is an official trademark of the Canadian Space Agency.
Figure 33 : Sequence of RS-2 images over the Vermillion chutes area during 2012-2013 freeze-up. RADARSAT-2
For the 2013 freeze-up, only five RS-2 images were acquired over the area (Figure 34). On November 6, there is no ice in the reach. On November 17, the entire reach is showing running ice floes. On November 30, ice has reached the falls. The hanging dam grows and on December 6, it has crossed over the falls. Landsat-8 images were used to monitor the rest of this progression. On December 28 the ice has progressed further upstream (Figure 35). On January 4 2014, it has reached the rapids. On January 13 it is almost closed. On February 28, the open water lead has already started to increase.
31
RADARSAT-2 Data and Products © MacDonald, Dettwiler and Associates Ltd. (2012) – All Rights Reserved. RADARSAT is an official trademark of the Canadian Space Agency.
Figure 34 : Sequence of RS-2 images over the Vermillion chutes area during 2013-2014 freeze-up. RADARSAT-2
Figure 35 : Sequence of Landsat-8 images over the Vermillion chutes area during 2013-2014 freeze-up.
Dec. 28, 2013
Jan. 4, 2014
32
11 OBSERVATION OF ICE FLOES UPSTREAM OF VERMILLION
CHUTES
The series of Landsat-8 images over the Vermillion Chutes have confirmed that ice floes were present in the open water lead during the study period. Figure 16, Figure 25 and Figure 35 show constant ice floes from November 10th to February 28th. Additional images confirm the phenomenon on December 19th, January 14th and February 14th (Figure 36).
Figure 36: Ice floes on Landsat-8 images upstream of the Vermillion Chutes on December 19th, January 27th and February 14th 2014.
33
The ice floe concentration has been calculated for all Landsat-8 images. The open water lead and the ice floes have been digitized manually for each image (Figure 37). Table 7 show the results. However, it should be noted that on the December images, the digitized water extent include the area between the rapids and falls, not yet frozen. Hence a lower floe concentration. An automatic method for estimating the ice floe concentration has been developed parallel to this project. It is being improved.
Figure 37 : Digitization of water and floes.
Table 7 : Ice floe concentration from Landsat-8 images
Date Open water lead (m²) Floes (m²) Concentration
November 10, 2013 65830031 13364168 20% December 10, 2013 5915322 2230039 38% December 19, 2013 8177262 3029051 37% December 28, 2013 7747434 2980141 38% January 4, 2014 4085018 2829014 69% January 13, 2014 3948912 2633624 67% January 27, 2014 4498977 3688883 82% February 14, 2014 4309022 3475153 81% February 28, 2014 3988985 2475508 62%
34
12 CONCLUSION
The study of the 2013-2014 break-up on the downstream part of the Peace River has been conducted using three sources of satellite imagery. RADARSAT-2 images have proven very useful to identify the main ice types, particularly at a finer spatial resolution (Quadpol fine,10m). The Standard mode (25m) provide coarser information but with the advantage of a larger extent (100 km). The radar images have also been a key input for the analysis of the ice processes (lodgement, submergence). The main problem with RADARSAT-2 data is that they need to be planned in advance. But once this is done, images are acquired in any weather conditions. Optical imagery has been a precious complement to this analysis. MODIS, through its daily acquisitions, is most useful for timing events such has ice lodgement. Its low resolution (250m) however, restricts information in the larger sections of the river. Finally; Landsat-8 provided a regular and detailed view of the ice cover over the entire season and it was extremely useful for the analysis of the ice processes and for calculating the ice floe concentration. However, as soon as snow covers the ice, it is of no help in terms of ice types. Both MODIS and Landsat-8 are optical satellites and clouds can be a problem at times, particularly in November and early December. Overall, each 1 km section of the study area has been imaged at least 50% of the time, at various resolutions and from various satellites.
The analysis of these images has permitted to achieve the objectives of the project, which were to complete and confirm the observations of 2012-2013:
- From both years, four main reaches in terms of dominant ice types, can be observed over the study area (up to km 683: consolidated ice; up to km 810: juxtaposed ice; up to km 910: skim ice; km 916 and downstream: hanging dam and juxtaposed or consolidated frazil ice). The main difference observed between the two ice seasons is that in 2013-2014, the ice cover between km 683-910 is generally smoother than in 2012-2013.
- The ice lodgement occurred at the same location as the previous year (km 901), but eight days later.
- The hydraulic submergence of the Vermillion Chutes occurred again and following a similar scenario.
35
- The presence of ice floes in the open water lead upstream of the Vermillion rapids was confirmed and proved to be more frequent than expected. Floe concentrations were in the order of 60 to 80%.
As a complement to this contract, BC Hydro is also supporting the IceFRONT project, funded by the Canadian Space Agency and Dromadaire Geo-Innovations, with the collaboration of INRS and DLR (German Space Agency). The main objective of this project is to automate some of the tasks that were conducted by INRS in the present contract and hence, to develop a proper service using multi-platform satellite imagery, including TerraSAR-X radar data from the German Space Agency. The project runs from September 2014 to September 2015.
ANNEX 1
Preliminary results from the analysis of the radar data were presented at the IGARSS conference in Quebec City, in July 2014:
Gauthier, Y., Jasek M., Poulin, J. Padel, A., and M. Bernier, 2014. Understanding Ice Processes In a Dynamic River Section Using Multipolarization Radarsat-2 Data. IGARSS 2014, 14-18 July, 2014 – Quebec City.
A digital copy of the presentation is provided with this report.