HAL Id: hal-02935109
https://hal-mines-albi.archives-ouvertes.fr/hal-02935109
Submitted on 29 Sep 2020
HAL is a multi-disciplinary open access
archive for the deposit and dissemination of
sci-entific research documents, whether they are
pub-lished or not. The documents may come from
teaching and research institutions in France or
abroad, or from public or private research centers.
L’archive ouverte pluridisciplinaire HAL, est
destinée au dépôt et à la diffusion de documents
scientifiques de niveau recherche, publiés ou non,
émanant des établissements d’enseignement et de
recherche français ou étrangers, des laboratoires
publics ou privés.
Measurement of Elastic and Rotation Fields during
Irreversible Deformation using Heaviside-Digital Image
Correlation
J.-C. Stinville, M.A. Charpagne, F. Bourdin, P.G. Callahan, Z. Chen, M.P.
Echlin, Damien Texier, J. Cormier, P. Villechaise, T.M. Pollock, et al.
To cite this version:
J.-C. Stinville, M.A. Charpagne, F. Bourdin, P.G. Callahan, Z. Chen, et al.. Measurement of
Elas-tic and Rotation Fields during Irreversible Deformation using Heaviside-Digital Image Correlation.
Materials Characterization, Elsevier, 2020, 169, pp.1-16/110600. �10.1016/j.matchar.2020.110600�.
�hal-02935109�
Measurement of elastic and rotation fields during irreversible deformation
using Heaviside-digital image correlation
J.C. Stinville
a,⁎, M.A. Charpagne
a, F. Bourdin
c,1, P.G. Callahan
b, Z. Chen
a, M.P. Echlin
a,
D. Texier
d, J. Cormier
c, P. Villechaise
c, T.M. Pollock
a, V. Valle
c,⁎aUniversity of California Santa Barbara, Santa Barbara, USA bUS Naval Research Lab, Washington, DC, USA
cInstitut PPRIME, Université de Poitiers, CNRS, ISAE-ENSMA, UPR 3346, 86961 Chasseneuil Cedex, France
dClement Ader Institute (ICA), Université de Toulouse, CNRS, IMT Mines Albi, INSA, ISAE-SUPAERO, UPS, Campus Jarlard, F-81013 Albi, France
Keywords:
High resolution digital image correlation Heaviside-DIC
Polycrystalline nickel-based superalloys Scanning electron microscopy digital image correlation
Strain localization Discontinuities measurements Elastic and plastic strain Micro-volumes Elastic heterogeneity Rotation field
A B S T R A C T
The recent development of the high resolution and discontinuity-tolerant digital image correlation technique enables the extraction of discontinuities within a displacement field. The technique provides quantitative ana-lysis of discontinuities arising from slip, shear bands, cracks, and grain boundary sliding in a variety of material systems, including polycrystalline metallic materials. The discontinuity-tolerant digital image correlation method can be implemented to retrieve not only quantitative discontinuity analysis but also the local strain and rotation fields that operate near these discontinuities. The present implementation includes high-resolution digital image correlation (HR-DIC) measurements collected in a scanning electron microscope for analysis of both the plastic and elastic fields that develop during deformation of polycrystalline metallic materials. The combination of the discontinuity-tolerant DIC technique with the computation of internal gradients enables extraction of non-localized strain and rotation fields during plastic deformation of a nickel-based superalloy. Therefore the lattice rotation/expansion and plastic localization that occur during deformation can be de-termined in a single experiment. This method is validated using synthetic images with preset deformation, and experimental measurements using the electron back scatter diffraction (EBSD) technique.
1. Introduction
The quantitative assessment of strain fields is essential to under-stand the deformation response of materials and to accurately relate the local mechanical behavior to the global loading conditions. Strain fields computed from displacement fields can be directly obtained experi-mentally using various advanced tools such as the grid method [1], mark tracking techniques [2], interferometry [3], moire techniques [4] and digital image correlation (DIC) [5]. However, these techniques provide continuous displacement fields that are not adapted to describe kinematical discontinuities that develop during irreversible deforma-tion of materials, which include cracks, shear bands, slip bands, per-sistent slip bands, grain boundary sliding, delamination, and interface decohesion [6]. Recently, it was demonstrated that conventional DIC can be adapted to capture kinematical discontinuities inside a dis-placement field by coupling it with the finite element method (FEM) [7–9]. However, this approach requires knowledge of the exact location
of the discontinuities within the displacement field prior to calculation, which prevents systematic measurement. Other attempts have adopted a local approach to solving this problem using post analysis of the displacement field [10,11]. More recently, a new local DIC approach, called Heaviside-DIC, has been developed. This approach considers kinematical discontinuities inside each subset during the correlation step of analysis, and has been applied and validated for 2D and 3D displacement fields [12–14]. The conventional DIC method only pro-vides displacement results that are filtered and non-representative near discontinuities; this is due to the low-pass filtering effect of the classical kinematic representation. However, the Heaviside-DIC approach elim-inates this shortcoming and extracts accurate displacement fields near discontinuities [12–14]. Its viability has been demonstrated for de-formation of materials that involve discontinuities such as cracks [14], interfacial sliding [12], and slip bands [6].
Moreover, strain fields derived from computed displacement fields that contain discontinuous displacements are also not representative
⁎Corresponding authors.
E-mail addresses:[email protected](J.C. Stinville),[email protected](V. Valle).
1Now at AirBus,Toulouse, France.
using the conventional strain formulation. This is clear as the strain field derived from conventional DIC during plastic deformation of metallic materials that exhibit slip localization, is strongly correlated to the DIC parameters (step, subset and strain window size) [6,15,16]. This prevents quantitative measurement of plastic localization. In the framework of the Heaviside-DIC method, the contribution of the dis-continuities to the displacement field can be extracted and the strain calculation is then applied only on the remaining displacement field that describes the physical elastic and rotation fields. This methodology is demonstrated in the present paper using the Heaviside-DIC method. While the Heaviside-DIC method can be used to investigate various kinds of discontinuities over a large range of materials (rock, mud, metals, polymers [6,12,14,17]), this paper focuses on displacement fields produced by plastic deformation of polycrystalline metallic ma-terials in the form of slip in the regions between discontinuities in the scenario where deformation occurs via a combination of continuous and discontinuous mechanisms. Recently, the combination of scanning electron microscopy (SEM) and DIC has emerged as a robust method for experimental quantification of slip localization and accumulation at the microstructural scale [15,18–29]. This high resolution approach to DIC gives insights to the phenomena involved in plastic deformation down to the nanometer scale in materials with complex microstructure. [15,22,30].
Typical strain fields obtained from high resolution digital image correlation (HR-DIC) are presented inFig. 1for a nickel-based super-alloy deformed at room temperature at various macroscopic strains using the conventional DIC and strain formulation [18]. Conventional DIC methods produce subset size dependent strain values, and prevent the separation of the plastic, elastic, and rotation fields which exist during plastic deformation. The plastic displacement field is often produced by discrete slip events that are induced by dislocation nu-cleation and motion at the lattice scale [31–33]. However, elastic de-formation and rotation displacements also occur, and are superimposed on the plastic localization events at the scale of the microstructure. The elastic deformation and rotational motion are physically occurring from lattice rotation due to the presence of stored dislocations [34] or/and the consequence of slip localization [25] and lattice expansion due to internal stresses [34]. Plastic slip events often produce highly intense
bands of strain such as those inFig. 1, when measured using conven-tional DIC. The sharp displacements produced at the surface result from the motion of multiple dislocations along an individual or a few closely spaced slip planes. These intense concentrated bands prevent the ob-servation of the strain field produced by elastic or non-localized de-formation nearby the slip bands. For example, the strain field obtained at 0.31% total deformation during incipient plasticity in a nickel-based superalloy is presented inFig. 1(b and c), in the loaded and unloaded states. In the unloaded condition residual strain is observed as con-centrated strain bands (black arrow) that correspond to incipient slip events. Under load, the strain field shows high intensity concentrated strain bands due to plastic localization and the elastic strain hetero-geneity associated with microstructure and the inherent elastic aniso-tropy of the material. The separation of the plastic and elastic strain components is not directly possible using conventional DIC. At in-creasing levels of plastic deformation, the elastic and plastic compo-nents are even more challenging to separate, as is clear fromFig. 1(d), where the intensity of concentrated strain bands reaches values that are an order of magnitude larger than the local elastic deformations.
The measurement of the elastic deformation and rotational motion during macroscopic plastic deformation is of importance in under-standing the effect of microstructure on damage initiation during monotonic or cyclic loading. For example, the interaction of slip events with microstructural features such as grain boundaries, twin boundaries and phase interfaces have been identified as major factors of im-portance for crack initiation [32,35–42]. Currently, the primary mea-surement techniques for the local elastic and rotation fields are syn-chrotron-based X-ray techniques [43–45] and the high resolution electron backscatter diffraction technique (HR-EBSD) [34,46,47]. These techniques have provided great insight into the effect of slip localiza-tion on local elastic strains [43,46,47]. However, these measurements can require unique equipment, significant time, are complex, and are limited to studying physically small regions of material. Furthermore, they must be combined with other techniques to capture the plasticity associated with slip events. The use of HR-DIC has recently been de-monstrated to capture both the elastic field [15] and rotation field [25,48] produced during deformation at the sample surface. Di Gioac-chino et al. [25,48] also demonstrated that HR-DIC can measure the
Fig. 1. An example of a high resolution DIC
measurement from SEM images, taken from [18], exhibiting high strain gradients and slip localization in bands that are strongely influenced by the microstructure. (a) Mi-crostructure from EBSD of the investigated nickel-based superalloy. (b-c) Strain field after a total deformation of 0.31% under load, and after unloading of the specimen (c). The strain field in (b) displays the su-perimposition of strain induced by elastic deformation and incipient plastic events without distinction. (d) Strain field in the plastic regime at 1% macroscopic de-formation. The intensity of strain induced by slip events is significant with regard to the macroscopic deformation and prevents independent analysis of the elastic field and plastic fields (red arrow). (For interpreta-tion of the color code in the figure legend, the reader is referred to the web version of this article.)
rotation field during plastic deformation when combined with prior knowledge of the activated slip plane. In all these studies, rotation and strain measurements were validated far from discontinuities and by using a displacement difference process. The Heaviside-DIC technique used in the present paper is able to systematically extract elastic and rotation fields during plastic deformation (strains, rotations, dis-continuities) in an automated fashion without prior knowledge. The in-plane elastic and rotation fields obtained from Heaviside-DIC are vali-dated against synthetic images, with known displacement fields, and on real experimental images through comparison to EBSD measurements. 2. Experimental Procedure
2.1. Heaviside Based Digital Image Correlation
Heaviside based Digital Image Correlation (H-DIC) was recently developed to solve the problem of discontinuities being present inside subsets [6,12]. The Heaviside-DIC method has been used until now to extract quantitative measures of the magnitude of discontinuous dis-placements, systematically over large areas, during material deforma-tion. This method was developed in 2015 [12] and validated using synthetic and experimental datasets on a variety of materials and loading conditions [6,12,14,17,49]. The Heaviside-DIC method is a local approach that offers additional analysis within subsets. Dis-continuities at the scale of the subset are described by Heaviside functions that allow one part of the subset to shift with respect to the others by a magnitude equal to the physical discontinuities. The ori-ginal Heaviside-DIC code itself remains unchanged for the present in-vestigation, however the processing of the displacement results (first gradient) at the scale of the subset is implemented as described in the followingSection 3. This provides separation of the discontinuous and continuous components of the displacement field, which is not directly possible using conventional DIC. The detection of the discontinuities by the Heaviside-DIC method comes with the cost of long computational times, which is summarized in ref. [6]. Fortunately, since each subset calculation is independent, massive code parallelization utilizing gra-phics processing units (GPUs) has been used for the fast computation of very large datasets. The results obtained from the Heaviside-DIC method are compared to the ones obtained using a conventional DIC code. The conventional DIC code used in the present study utilizes the classical optimization of the subset shape function by rigid body and first gradient displacements.
During mechanical loading, metals such as the investigated nickel-based superalloy develop irreversible plasticity that usually manifests in the formation of slip bands. Consequently, slip traces at the free surface of specimens are observed (Fig. 2(c)), each associated with a local surface step as shown schematically inFig. 2(b). This step is produced by dislocations emerging at the surface during plastic deformation by gliding along a crystallographic plane [31]. In-plane displacements occur locally in the material between both sides of the slip trace and can be described by a vector named in-plane slip as depicted in green in Fig. 2(b). The in-plane slip vector represents the physical in-plane dis-placement produced by a slip event.
The correlation of deformed and undeformed images by the Heaviside-DIC method provides the displacement field referenced to the slip trace (U ). Therefore, the full in-plane description of the slip dis-placements (in-plane slip vector) is obtained from the Heaviside-DIC method at every point in the HR-DIC map. The amplitude (norm) in nanometers of the slip vector for each measured point is given in Fig. 2(d) for a nickel-based superalloy after plastic deformation at 1.83%. The intensity of the slip is obtained for each single slip trace with high spatial (less than 33 nm) and amplitude resolution (less than 10 nm). It must be also mentioned that the direction of the in-plane slip vector provides direct identification of distinct slip systems (slip plane and slip direction) [6].
2.2. Synthetic Images
To evaluate the measurement accuracy, synthetic images that mimic a real speckle pattern, described later in 2.3.2, as well as a re-presentative deformation field for a plastically loaded metallic material were created. Individual synthetic speckles were created using a half of cosine function that was replicated randomly to create the entire image. The generated image resolution is 3200 × 3200 pixels. Then, known movements and deformations were applied to the initial synthetic image to create a new image by integration of 10 × 10 pixels to retrieve the initial dimension. This process is used to limit the effect of the in-terpolation employed in the deformation process and to access to ac-curate sub-pixel movements.
Comparisons of the gray-level histograms and auto-correlation fac-tors were performed inFig. 3(c and d), in order to validate the speckle characteristics used to create the synthetic images. The gray-levels in Fig. 3 are not homogeneously spread and the speckle grain size is roughly 3 pixels which is a sufficient value for correlation [50].
Sliding and rotation displacements were applied to the synthetic image to mimic the mechanical behavior of a real material, as produced by two rotated parts (Fig. 4(a and b)). These movements are synchro-nized and correspond to an applied rotation amplitude of up to 4°, the limit of the small perturbation hypothesis, and to applied sliding am-plitudes of up to 8 pixels. To evaluate the accuracy of the rotation measurements using H-DIC, a series of 20 deformed images were cre-ated with rotations and sliding increments applied at multiples of 0.2° and 0.4 pixel.
2.3. Plastic Deformation of a Polycrystalline Metal 2.3.1. Material
An aged version of the polycrystalline nickel-based superalloy Inconel 718 was investigated. Thermomechanical treatments produced Inconel 718 material with a high γ″-phase content and rather low δ-phase with average grain size of 62 μm. A solution annealing heat treatment was performed (30 min at 1050 °C followed by a water quench), followed by a precipitation hardening treatment (8 h at 720 °C, followed by 8 h at 620 °C). The nominal composition of the Inconel 718 [51] used is Ni 0.56%Al 17.31%Fe 0.14%Co -17.97%Cr - 5.4%Nb - Ta-1.00%Ti - 0.023%C - 0.0062%N (wt%). 2.3.2. Mechanical Testing, Sample Preparation and Microscopy
Tensile tests were performed at room temperature using a custom in-situ ± 5000 N stage within FEI Helios and FEI Versa3D microscopes (both with field-emission guns) on flat dogbone-shaped specimens with a gauge section of 1 × 3 mm2. Electron Backscatter Diffraction (EBSD)
measurements were performed with an EDAX OIM-Hikari XM4 EBSD detector using a step size of 0.2 μm. Diffraction patterns were acquired using an accelerating voltage of 20 kV, a 2 × 2 binning and a beam current of 0.2. EBSD maps were acquired prior and after deformation. Tensile tests were interrupted at macroscopic plastic strain levels of 0.17%, 0.32%, 0.61% and 1.26% and DIC measurements performed. Macroscopic strain was measured in-situ using fiducial markers located at both ends of the gauge length. The procedure consists of recording the location (stage position) of two targeted nanoparticles from the speckle at both ends of the gauge length before and after deformation. The high degree of spatial control of the microscope stage and large size of the gauge length provide an accuracy below 0.01% on macroscopic strain measurements. The axial loading direction is horizontally or-iented in all strain maps. A gold nanoparticle deposited speckle pattern with average particle size of 60 nm was used for DIC measurements following the procedure developed by Kammers et al. [20].
Samples were polished with SiC papers up to 1200 grit, followed by polishing with a 6 μm diamond suspension and then chemo-mechanical polishing with 0.05 μm colloidal silica for 12 h. This procedure reveals the microstructure, including the grain and twin boundary locations,
allowing for direct spatial registration between the SEM images, the DIC strain maps and the EBSD maps. The data registration is done using control points between the 3 data types. About 70 triplets of control points were picked over the area of interest. The procedure is detailed elsewhere [52].
2.3.3. Scanning Electron Microscopy Imaging Conditions and High Resolution DIC
SEM images sets were acquired before loading and under load fol-lowing the guidelines of Kammers and Daly [20,27] and Stinville et al. [15]. A National Instruments™ scan controller and acquisition system (DAQ) were used to control beam scanning in the FEI microscope. This custom beam scanner removes the SEM beam defects associated with some microscope scan generators [15,29].
Tiles of 10 × 10 images before and after deformation with an image overlap of 15% are used. DIC calculations are performed on these series of images and results are merged using a pixel resolution merging
procedure. The experimental procedure can be found elsewhere [53]. Regions of 1 × 1 mm2were investigated for the Inconel 718 nickel-based superalloy. Subset size of 31 × 31 pixels (1044 nm × 1044 nm) with a step size of 3 pixels (101 nm) were used for DIC measurements. Digital image correlation was performed using the Heaviside-DIC method [6,12]. The sample preparation, imaging conditions and Hea-viside-DIC parameters allow for a discontinuity detection resolution between 0.2 and 0.3 pixels (7 nm and 10 nm respectively) [6,12].
3. Rotation and Continuous Fields Computation Method
Rotation and strain tensor values can be accessed by two ap-proaches. The conventional approach usually employed in literature, is done by post processing the measured displacements field (U) using spatial derivatives. This approach is usually based on finite difference computations, or in a few cases, on a finite element method (FEM) [50]. When discontinuous displacements occur in the displacement field U,
Fig. 2. (a) Discontinuity description inside of a single subset by the Heaviside-DIC method. Subsets that have discontinuities are detected and described by their
location inside the subset (r∗, θ∗) and the jump/step of the discontinuityU (dxand dyalong the horizontal and vertical directions). (b) Slip traces at the free surfaces
of specimen are observed, each associated with a local surface step. The in-plane slip vector represents the physical in-plane displacement of the material on the “left” side of the slip trace in comparison to the material on the “right” side of the slip trace. The in-plane slip vector can be obtained systematically by solving the problem of kinematical discontinuities at each subset using the Heaviside-DIC method. The angle γ∗describes the direction of the in-plane slip vector (c) SEM image of a 718 nickel-based superalloy specimen deformed at 1.26% plastic deformation. The associated EBSD measurements of the microstructure are given in the insert. (d) The amplitude of displacement induced by slip events is given in nanometers for the region considered in (c).
the classical approach results in non-representative measurements [6,15]. Therefore, the approach used here is to extract the first gradient parameter U
X defined in the kinematical representation from the DIC calculation. The method is named the internal DIC parameters method throughout the paper. The first gradient parameter obtained from DIC describes the rotation and strain tensors at the scale of the subset. Also we separate the strain tensor E and the infinitesimal rotation tensor R,
from this local gradient tensor U
X. This classical decomposition can be written as: = + E U X UX 1 2 T (1) Fig. 3. (a) A part of the experimental SEM images acquired for high resolution DIC. The red box displays typical subset sizes used for high resolution DIC. (b) A part of
the synthetic image mimicking the SEM image properties. (c) Histogram comparison between experimental and simulated images. (d) Covariogram comparison between experimental and simulated images. (For interpretation of the color code in the figure legend, the reader is referred to the web version of this article.)
Fig. 4. (a) The region of interest in the image before imposed displacements. (b) Region of interest in one of the images after imposed displacements. The red frames
represents zones where different kinematical movement are applied. (c) Imposed rotation and sliding displacement at discontinuity (between red frames) for the 20 generated images. (For interpretation of the color code in this figure legend the references to colour in this figure legend, the reader is referred to the web version of this article.)
=
( )
R U X U X 1 2 0 11 0 T (2) with α the angle of rotation with respect to the small deformation hy-pothesis.This approach uses the calculation performed during DIC correla-tion at the subset scale to directly extract the strain and rotacorrela-tion field. Therefore, the rotation and elastic fields are obtained using investiga-tion windows that are constrained to the size of the subset and grid associated with the step size. In the few prior investigations that used the proposed approach (internal DIC parameters method) [54], the evaluations of the errors of each components of the gradient tensor are reported to be on the order of the conventional post-processing ap-proach for the same sampled grid/region. However, such a method is acknowledged to provide slightly larger errors than conventional method. Therefore, the error associated with the approach is in-vestigated below.
3.1. Validation Using Synthetic Images
As described in the methods section, known sliding movements were applied to synthetic speckle images to mimic the mechanical be-havior of a material. The known displacements were produced by two rotated parts within the initial image as described in 2.2 and inFig. 4. The applied displacement theoretically produces, in comparison to the undeformed image, a gradient of displacements within the two sides of the image, with a sharp interface/discontinuity between them along the vertical center line of the image. The rotation field is therefore constant across the entire image and is equal to the applied rotations. In addi-tion, the strain field is equal to zero across both sides of the image.
The results obtained from the analysis of the synthetic images is shown inFig. 5for an applied rotation of 2° and 4 pixels of sliding. The conventional DIC method and Heaviside-DIC were both employed with a subset size of 40 × 40 pixels. The horizontal and vertical components of the displacement obtained are presented inFig. 5(a,b and d,e) using the conventional DIC method and Heaviside-DIC respectively. The
discontinuity is not well resolved using conventional DIC, as shown by the appearance of displacement fluctuation along the location of the vertical discontinuity. The associated strain fields obtained using con-ventional DIC and post processing of the obtained displacement field (U) based on the finite difference method is displayed inFig. 5(c and f), where strain fluctuations are observed at the discontinuity. Heaviside-DIC accurately determines the sharp discontinuity within the strain field. The calculated amplitude of the discontinuity ||U|| is presented in
Fig. 5(g) and correspond to an average sliding along the discontinuity of 4 ± 0.05 pixels, precisely the displacement applied. The Heaviside-DIC provides a quantitatively accurate measurement of the amplitude of discontinuities.
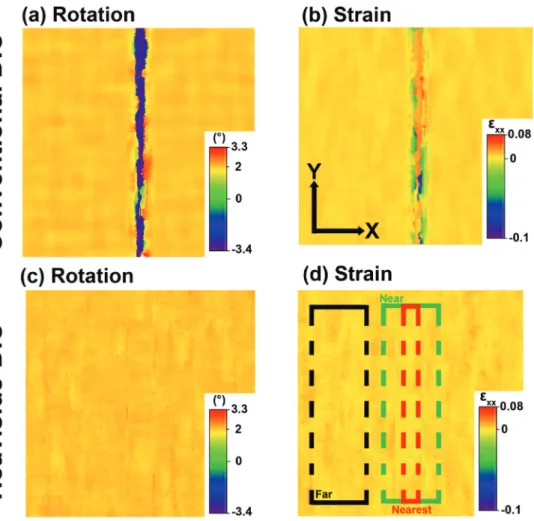
The rotation fields calculated using the finite difference computa-tion from the internal DIC calculacomputa-tions, as described inSection 3, are shown in Fig. 6(a and c) using the conventional DIC method and Heaviside-DIC, respectively. The associated strain maps along the hor-izontal direction are shown inFig. 6(b and d) using conventional DIC method and Heaviside-DIC, respectively. The combination of the Hea-viside-DIC method and the internal DIC parameters method analysis, described inSection 3, provides accurate measurement of the rotation and the strain fields, evidenced by a constant rotation and elastic field across the entire image. The average strain and rotation are equal to 0% ± 0.01% and 2° ± 0.01°, returning the same constant rotation and strain fields applied to the images. The rotation and elastic fields obtained from the conventional DIC method have large fluctuations in magnitude in the vicinity of the discontinuity. The distribution of the obtained rotation across the region highlighted by dashed boxes in
Fig. 6(d) is presented inFig. 7using the conventional DIC method and Heaviside-DIC. The region highlighted with a dashed black box is lo-cated far from the discontinuity, where no discontinuities are present inside the subsets. The regions highlighted by a dashed green and red boxes are located “near” and the “nearest” to the discontinuity, with the discontinuity contained within all the subsets. Heaviside-DIC provides for all of these regions rotation values that are centered around the applied rotation of 2° with a standard deviation of about 0.01°. The
Fig. 5. Measured data from conventional DIC (a to c) and Heaviside-DIC (d to g) for image number 10, where a rotation of 2° and sliding of 4 pixels is imposed (see Fig. 4). A subset size equal to 40 × 40 pixels is used for the calculation. (a,d) Horizontal displacement components. (b,e) Vertical displacement components. (c,f) Strain along the horizontal direction labeled x based on finite difference method. (g) amplitude of the discontinuity obtained by the Heaviside-DIC method.
conventional DIC method returns two intense peaks centered around 2° and −3° with both standard deviation slightly higher than 0.01°. The case study labeled “1” inFig. 8gives an explanation for the origin of the artificial peak centered around −3°. During the conventional DIC cal-culation, subsets that intercept the discontinuity in the middle (or close to the middle) have better correlation for rotations that occur in the opposite direction from the applied rotation, as displayed inFig. 8(g). This is explained due to a better solution to the cross-correlation coefficient by averaging the regions on both side of the discontinuity. As a consequence, an artifact peak is obtained at a negative rotation value within the rotation field. Heaviside-DIC captures the dis-continuity inside the subset during the DIC calculation as displayed schematically in case labeled “1” in Fig. 8(d), therefore the rotation field is retrieved without artifact values.
To better qualify the analysis of the rotation, the rotation standard deviation and the rotation error were calculated for each applied ro-tation amplitude on the synthetic images (Fig. 4(c)) and for the three different regions depicted in Fig. 6(d) using conventional DIC and HeavisiDIC with internal DIC parameters method analysis as de-scribed inSection 3. The average error is shown inFig. 9(a). While no significant difference is observed between conventional DIC and Hea-viside-DIC methods for the region far from the discontinuities, sig-nificant error is observed using conventional DIC for the regions in the vicinity of the discontinuity. The same conclusion can be made by ob-serving the evolution of the rotation standard deviation shown in
Fig. 9(b).
Interestingly, on the error and standard deviation evolution in
Fig. 9, two distinct regimes using conventional DIC method dependent
Fig. 6. Measured data from conventional
DIC (a,b) and Heaviside-DIC (c,d) for image number 10, where a rotation of 2° and sliding of 4 pixels is imposed (seeFig. 4). A subset size equal to 40 × 40 pixels is used for calculation. (a,c) rotation fields using internal DIC parameters method analysis detailed inSection 3and from conventional DIC and Heaviside-DIC, respectively. (b,d) Strain along the horizontal direction la-beled x. Black, green and red dashed boxes in (d) represent the “far”, “near” and “nearest” evaluation zones from the im-posed discontinuity. (For interpretation of the color code in the figure legend, the reader is referred to the web version of this article.)
Fig. 7. Distribution of the rotation retrieved from conventional DIC and Heaviside-DIC using internal DIC parameters method analysis for the three evaluation
on the applied amplitude of rotation can be noted. In the first regime, when the applied rotations are smaller than 1.6° the errors increase linearly in the vicinity of the discontinuity when using conventional DIC method. In the second regime, when the applied rotations are larger than 1.6°, the errors from conventional DIC decrease slowly but stay significant in comparison to those obtained from Heaviside-DIC.
These two regimes are directly a consequence of the correlation processes from the conventional DIC method, as shown by the sche-matic case inFig. 8. In the first regime, the sliding displacement at the discontinuity is relatively small as displayed in the schematic case la-beled “1” inFig. 8(a, d, g). In this subset, the two parts separated by the discontinuity, lead the DIC correlation process in different ways and the better computed solution is a rotation in the opposite direction of the applied rotation. With increasing applied sliding displacement at the discontinuity, the obtained solution displays increasing rotation in the opposite direction of the applied rotation. Therefore the error increases with increasing applied sliding displacement. This phenomenon is ac-tive in the rotation fields presented inFig. 9(c), where significant re-gions with negative rotations are observed at small applied rotation. In the second regime, when the relative movements on either side of the discontinuity are relatively high, as shown schematically in the case labeled “3”, the DIC correlation process is less and less able to take into account of the contribution of the two sides. The influence of one of these sides on one another is smaller and smaller, and the DIC process tends to give solutions that display more accurate values of the rotation. However, the DIC correlation process does not take into account the entire part of the initial subset. As a consequence, two solutions can be obtained as displayed in Fig. 8(i) and therefore the position of the discontinuity can not be well retrieved as shown inFig. 9(c) for a large
applied rotation. This phenomenon is classically observed using con-ventional DIC in presence of discontinuities. To illustrate this, the cross-correlation coefficient using the conventional DIC method is presented in Fig. 10 for a simulated increase in sliding displacement along a vertical discontinuity up to 14 pixels (without applied rotation). The reference subset is selected in the middle of the initial image where the discontinuity is applied on the deformed images. The cross-correlation coefficients from DIC calculation are extracted between the reference subset and the subsets along a horizontal profile that intercepts the discontinuity in the deformed image. The values of the cross-correlation coefficient are reported inFig. 10(b) for increasing sliding displace-ment. Values near zero for the cross-correlation coefficient indicate that the process of correlation operates on all pixels of the subset. Such values are obtained for applied sliding below 6 pixels. The location of the discontinuity is well retrieved. However, the displacement/strain values obtained is observed to be zero (not presented), indicating that the conventional DIC is not able to capture such small discontinuous sliding displacements. At high applied sliding amplitudes (higher than 6 pixels), two artificial positions of the discontinuities are obtained in-dicated by identical values of the cross-correlation coefficients. It is observed that values of the cross-correlation coefficients are not equal to zero. The correlation operates only on half of the part of the subset and gives two solutions. This is due to the two possible solutions ob-tained during DIC correlation process, as schematically shown in
Fig. 8(i). For each solution, the sliding movement is actually well evaluated (not presented); however only one solution is chosen by the correlation process and in random manner (depending on the starting point of the optimization process). In this case, only the location of the sliding is not well retrieved. The present processing also explains the
Fig. 8. Case studies to show schematically the solution given by conventional DIC method and Heaviside-DIC with applied displacements at a discontinuity and the
position of the subset. The investigated subsets are displayed by black boxes on the initial images. The best solutions from DIC correlation of the initial subset are given on the deformed images from conventional DIC method and Heaviside-DIC. Case 1 presents a displacement that has a relative low sliding across the dis-continuity located in the middle of the image and a similar rotation on both sides of the disdis-continuity. For the case 1 the investigated subset is centered on the middle of the discontinuity. Case 2 presents a displacement identical to the one in case 1. For the case 2 the investigated subset is placed on the edge offset from the discontinuity. Case 3 presents a displacement that displays a high sliding across a discontinuity located in the middle of the image. For the case 3 the investigated subset is again placed in the middle of the discontinuity.
strain fluctuation obtained along the discontinuity in Fig. 5(c) using conventional DIC. This artifact is generally reduced in the literature by applying a filtering procedure that consists of data averaging. It must be mentioned that the amplitude of the applied sliding for which con-ventional DIC gives two solutions is equal to the size of the speckle
particles and are not correlated to the size of the subset. The H-DIC process is particularly efficient for the retrival of the location of the discontinuities and imposed rotations and strain fields, nearby dis-continuities or far from them (Far, Near, and Nearest). However, it can be noted inFig. 9that the error level (green circles) for the region
Fig. 9. Rotation average bias (a) and rotation standard deviation (b) for an imposed angle varying from 0° to 4°. For each test, the results from three zones are
compared. Results are obtained using a subset size of 40 × 40 pixels. (c) Rotation fields using internal DIC parameters method from conventional DIC (top) and Heaviside-DIC (bottom) for images where rotations of 1.2°, 2.2° and 3° are imposed.
Fig. 10. (b) Cross-correlation coefficient
ob-tained from conventional DIC method for in-creasing sliding on synthetic images as illu-strated in (a). The reference subset is located in the initial image in the middle of the image, where the discontinuity will develop. The cross-correlation coefficient from DIC calculation is extracted along a horizontal profile that inter-cepts the discontinuity. (b) Values of the cross-correlation coefficient along the investigated profile for each investigated applied sliding. The physical discontinuity is located at the position 0.
labeled “near” inFig. 6, is a bit higher (about 4.5%) than for the regions labeled “far” and “nearest”. This is explained by the fact that a DIC correlation is performed at a distance smaller than half subset size as schematically shown by case labeled “2” inFig. 8(e); the kinematical field represents a discontinuity using only a few points on one side of the subset. The majority of the subset is contained on one side of the discontinuity, thus the process of minimization is more unstable. However, the observed errors are in an acceptable range, which are two orders of magnitude lower than errors issued from conventional DIC. The standard deviation error and the average error are lower than 0.00157° and 0.048° respectively using Heaviside-DIC. A comparison with the literature [54] shows that these errors are in the same range as those obtained from the conventional DIC method without the presence of discontinuities.
3.2. Validation Using Experimental Images During Deformation of a Polycrystalline Metal
To further validate the approach outlined inSection 3, analysis on an experimental material is presented. Comparisons of the rotation fields obtained with the conventional DIC method, the Heaviside-DIC technique, and those extracted from EBSD measurements are made using a specimen tested mechanically in the SEM. An Inconel 718 nickel-based superalloy specimen was deformed in-situ at macroscopic plastic strain levels of 0.32% and 1.26%. HR-DIC measurements were performed after unloading the specimen. The strain fieldεxxalong the
loading direction obtained using the conventional DIC method is pre-sented inFig. 11(a) and displays bands of concentrated strain that are
evidence of slip localization during plastic deformation. A subset size of 31 × 31 pixels (1044 nm × 1044 nm) with a step size of 3 pixels (101 nm) was used for DIC measurements. The plastic field is presented inFig. 11(c) using Heaviside-DIC with identical DIC parameters. The map shows the amplitude of the in-plane slip vector that represents the physical in-plane displacement induced by slip localization. The local approach of the Heaviside-DIC method, that offers an additional treatment of the subsets by accounting for the presence of dis-continuities, provides an improvement in spatial resolution in com-parison to conventional DIC method. Quantitative measurements of the strain localization were also performed. The in-plane rotation fields obtained from the approach described inSection 3are presented in
Fig. 11(b and d) using conventional DIC method and Heaviside-DIC, respectively. The artificial effect of discontinuous displacements on the rotation field, as discussed inSection 3.1, occurs due to slip localization and is pronounced when using the conventional method, preventing the measurement of the physical rotation field.
In order to validate the rotation field obtained by Heaviside-DIC, EBSD measurements were performed before and after deformation. The inverse pole figure map of a region of interest before deformation is presented inFig. 12(a). The in-plane slip map after deformation to 1.26% plastic deformation is displayed inFig. 12(b). The in-plane ro-tation field at the surface of the specimen is displayed inFig. 12(c) using the grain reference orientation deviation (GROD) representation from EBSD measurements. The GROD map displayed in Fig. 12(c) shows, for each grain, the misorientation between each point in the grain and the average orientation of the grain (both after deformation). For direct comparison with HR-DIC measurements, the GROD map
Fig. 11. (a) The strain field obtained from the conventional DIC method after 1.26% plastic deformation for a region of interest in the Inconel 718 nickel-based
superalloy specimen. (b) Associated rotation field for conventional DIC method using the first gradient parameter of each subset. (c) Plastic field obtained from Heaviside-DIC for the same region of interest in (a). The in-plane slip represents the physical in-plane displacement induced by slip localization. (d) Associated rotation field for Heaviside-DIC using the first gradient parameter of each subset. The subset is enriched by implementing discontinuities. A region of small-scale large rotations is indicated by red arrows in (d) from the intersection of a high intensity slip band with a grain boundary. (For interpretation of the color code in the figure legend, the reader is referred to the web version of this article.)
displays the in-plane component of the misorientation, which differs from conventional GROD maps where the full 3D misorientation is computed. The average rotation for each grain for the region of interest in Fig. 12(a) was computed from the rotation field obtained in
Fig. 11(d) from Heaviside-DIC measurements. The average rotation is used as the reference for each grain. The rotation at each pixel in a grain between the value of the rotation field (Fig. 11(d)) and the average rotation of the grain is presented inFig. 12(d). This map is defined as a grain reference rotation deviation (GRRD) map throughout the paper.
Very good agreement is obtained between EBSD and Heaviside-DIC measurements with the same magnitude of gradients in the rotation field induced during plastic deformation of the superalloy sample. The
GRRD and GROD along the profile depicted inFig. 12(a) is presented in
Fig. 12(e). An average difference of 0.21° is observed between the GRRD and GROD for identical points along the profile inFig. 12(e). A similar average value of 0.39° is observed between the GRRD and GROD for identical points in the maps depicted inFig. 12(c and d). It is im-portant to remember that the formulation of the rotation inSection 3
using the present method are correct for the condition of small de-formation hypothesis. This prevents the current method for being ac-curate for measurement of rotations of large amplitude.
Fig. 12. (a) Inverse pole figure map of a
region of interest in the Inconel 718 nickel-based superalloy specimen. EBSD measure-ments were performed before deformation. (b) In-plane slip map for specimen de-formed to 1.26% plastic deformation for the region in (a). The in-plane slip represents the physical in-plane displacement induced by slip localization. (c) The in-plane grain reference orientation deviation (GROD) obtained by EBSD measurements after 1.26% plastic deformation for the region in (a). (d) The in-plane grain reference rota-tion deviation (GRRD) obtained by Heaviside-DIC measurements after 1.26% plastic deformation for the region in (a). (e) GROD and GRRD values along the profile depicted in (a). A region of small-scale large rotations is indicated by red arrows in (c) and (d) from the intersection of a high in-tensity slip band with a grain boundary. (For interpretation of the color code in the figure legend, the reader is referred to the web version of this article.)
4. Application to a Nickel-based Superalloy: Micro-volumes
Separating the elastic and plastic strain components is of great im-portance when investigating the plastic deformation of polycrystalline metals. The localization of plasticity generated by slip events, which is at the scale of the microstructure, the local stresses and lattice rotations, and expansion fields are usually not taken into account during nu-merical simulations of the deformation of metals. These localization phenomena are difficult to capture and simulate due to the inherently discontinuous displacements they generate. For instance, the ability to measure the elastic displacement and rotation during macroscopic plastic deformation has been shown to be of great importance in un-derstanding the effects of microstructure on damage initiation during both monotonic and cyclic loading. For example, slip can occur as a consequence of the local stress and strain fields where slip bands in-tersect grain boundaries. It has been observed that these highly loca-lized stress and strain fields are extremely important in the transmission of plasticity between grains in metals [46] and in the fatigue crack initiation process [47]. These local fields require high resolution ob-servations to be determined, so they are difficult to measure on large fields of view that capture the variability of the microstructures in many metals. An example is given below to show that the enhancements to the H-DIC method presented here can provide measurements of both
the plastic localization events and the associated lattice rotation and expansion fields during deformation of metals over large fields of view. The rotation field is provided inFig. 13(b) for the region of interest inFig. 13(a) that has been plastically deformed to 0.32% by monotonic loading of Inconel 718. The comparison between the GROD map from EBSD measurements and the GRRD map from Heaviside-DIC and HR-DIC measurements is provided inFig. 13(c and d) for a reduced region of interest. The associated plastic field is presented inFig. 13(e) using the amplitude of the in-plane slip vector. As previously reported in literature [55], two sets of rotation gradient are observed at the surface of the specimen due to plastic deformation: (i) grain-scale rotation that are associated with the heterogeneity of the grain structure as depicted by green arrows inFig. 13; (ii) small-scale large rotations from the intersection of high intensity slip bands with the grain boundaries when direct slip transmission does not occur (arrows inFig. 11,Fig. 12and
Fig. 13). These highly intense rotation gradients that appear in the neighboring grains are reported as micro-volumes [55] and occurs from either the pile-up of dislocations [46] or/and the shearing of the grain boundary [55]. The Heaviside-DIC method combined with HR-DIC provides a quantitative measurement of both the plastic (shearing dis-placement induced by slip) and rotation (lattice rotation) fields. A de-tailed analysis of a micro-volume is given inFig. 14. The evidence of the micro-volume is shown by the red arrow in Fig. 14(d). Significant
Fig. 13. (a) Inverse pole figure map of a region of interest of the Inconel 718 nickel-based superalloy specimen. (b) In-plane rotation field after deformation at 0.32%
plastic deformation for the region in (a) obtained by Heaviside-DIC. (c) In-plane grain reference orientation deviation obtained by EBSD measurements after 1.26% plastic deformation for the region indicated by dashed box in (a). (d) In-plane grain reference rotation deviation obtained by Heaviside-DIC measurements after 1.83% plastic deformation for the region indicated by dashed box in (a). (e) The associated in-plane slip represents the physical in-plane displacement induced by slip localization. A region of small-scale large rotations is indicated by red arrow in (e) from the intersection of a high intensity slip band with a grain boundary. Green arrows in (b) and (c) indicate grain-scale rotation that are associated with the heterogeneity of the grain structure. (For interpretation of the color code in the figure legend, the reader is referred to the web version of this article.)
lattice rotations are observed from the impingement of a high intensity slip band (red arrow inFig. 14(b)) with a grain boundary. The evolution of the in-plane slip amplitude along the slip band of interest is provided for incremental plastic deformation inFig. 14(f). The amplitude of the in-plane slip is increasing from one side of the slip band to the other side where the micro-volume is observed. The amplitude of the in-plane rotation across the micro-volume is represented inFig. 14(g) for in-cremental plastic deformation. The amplitude of the in-plane rotation within the micro-volume is observed to increase with an increase in the in-plane slip amplitude of the associated slip band. FromFig. 14(c), the in-plane slip angle γ∗as defined inFig. 2(b) for the slip band of interest approaches 180° indicating pure in-plane shearing (in-plane displace-ment occurs only along the slip trace i.e. no transverse displacedisplace-ment). The white arrow in Fig. 14(c) is a representation of the average direc-tion of the displacement induced along the slip band of interest. This near-pure in-plane shearing is observed to be at the origin of the micro-volume. Further statistical investigation will be provided in a following paper.
While conventional EBSD measurements do not usually provide
information on the elastic field, HR-DIC combined with the Heaviside-DIC method computes the plastic strain field, the rotation and non-lo-calized strain fields. For example, the componentsεyyandεxyof the
non-localized strain field for two regions of interest are presented in
Fig. 15. The elastic compression of the lattices within particular grains in the microstructure is observed, such as the light pink grain (see ar-rows) inFig. 15(a,b). A high level of non-localized straining resulting in large lattice rotations (higher than 5°) is also observed within a micro-volume as shown inFig. 15(d) by the red arrow. As observed on the lattice rotation field, intense strain gradients originate either from the grain structure or/and the impingement of intense slip bands.
These non-localized strain components are computed from the first gradient of the deformation of the subset as described inSection 3. The non-localized strain describes both the physical elastic field and the expansion due to non-localized plasticity such as isolated dislocations or/and slip events that are below the detection threshold of the HR-DIC technique (below an in-plane slip displacement of approximately 10 nm).
It is interesting to investigate the average values of the strain from
Fig. 14. (a) Inverse pole figure map of a region of interest of the Inconel 718 nickel-based superalloy specimen. (b) In-plane slip map (amplitude) after deformation at
1.26% plastic deformation for the region in (a) obtained by Heaviside-DIC. (c) In-plane slip map (γ∗angle) for the reduced region depicted by dashed box in (b). (d-e) In-plane grain reference orientation and rotation deviation for the region of interest in (a). (f) In -plane slip amplitude along the profile labeled “profile 1” in (a) that follows the most intense slip band of the region of interest. (g) In -plane slip angle along the profile labeled “profile 2” in (a). A region of small-scale large rotations is indicated by red arrow in (d) from the intersection of a high intensity slip band (red arrow in (b) and (c)) with a grain boundary. (For interpretation of the color code in the figure legend, the reader is referred to the web version of this article.)
the localized (slip events) and non-localized fields. The total strains obtained from the DIC measurements and validated by macroscopic measurements are given in Table 1 for the four applied load steps during in-situ deformation of Inconel 718. As a reminder, the DIC
measurements were performed under-load. Knowing the elastic mod-ulus of the alloy (obtained from the elastic regime), the macroscopic residual plastic strains were calculated and are given inTable 1. The non-localized strains from the Heavside-DIC measurements using the internal DIC parameters method are also reported inTable 1for the four applied load steps. The average localized strains (total strain minus non-localized strain) that correspond to the strain induced by slip events are reported inTable 1. The difference in percentage between the macroscopic residual plastic strain and localized strain is given in
Table 1for the four applied load steps. While this difference is almost nonexistent during the first loading step, this difference increases with increasing applied load in the plastic regime. For the first step the non-localized strain is the direct measurement of the elastic strain field that occurs during deformation. However, with increasing applied stress in the plastic regime, the non-localized strain accounts for accumulation of elastic deformation (reversible) at the scale of the microstructure and non-localized plastic deformation. This non-localized plastic deforma-tion is on the order of 10% of the total plastic strain, as deformadeforma-tion goes well beyond yielding and may come from either small amplitude slip events that are not detected by the HR-DIC technique or/and non-localized plasticity produced by isolated dislocations. Interestingly, for the step labeled 1 inTable 1, the HR-DIC technique displays similar localized strains and plastic strains, indicating that the experimental
Fig. 15. (a,c) Inverse pole figure maps of two regions of interest in the Inconel 718 nickel-based superalloy specimen. White arrows indicate a region of lattice
compression along the vertical direction (b,d) The componentsεyyandεxyof the elastic field after 1.26% plastic deformation for the two regions of interest. These
components are measurements of the in-plane lattice expansion at the surface of the material during plastic deformation. Red arrow indicates a region of small-scale large lattice distortion from the intersection of a high intensity slip band with a grain boundary.
Table 1
The investigated Inconel 718 nickel-based superalloy specimen was deformed in-situ at four load steps.
Step Total strain Non-localized strain Localized strain Macroscopic residual plastic strain Difference 1 0.686% 0.514% 0.172% 0.174% 1.2% 2 0.860% 0.560% 0.300% 0.321% 6.5% 3 1.160% 0.602% 0.558% 0.610% 8.5% 4 1.830% 0.720% 1.110% 1.260% 11.9%
HR-DIC measurements were performed under load at total strain of 0.69%, 0.86%, 1.16% and 1.83%. The total strain is obtained from the average of the
εxxstrains obtained from DIC calculation on a region of 1 mm × 1 mm. The
non-localized strain represent the averageεxxstrains obtained from Heaviside-DIC
using the internal DIC parameters method described inSection 3. This strain describes the strain that are not the contribution of discontinuities. The Loca-lized strain is calculated as the total strain minus the non-locaLoca-lized strain and corresponds to the deformation induced by discontinuities.
technique is capturing all the slip events. This indicates that in the plastic regime a significant amount of the macroscopic residual plastic strain is present due to non-localized plasticity. Further investigation will be provided in a following paper with comparison to HR-EBSD measurements [47,56].
5. Conclusions
The Heaviside-DIC technique is used to retrieve elastic and rotation fields from displacement gradients that contain discontinuities. The problem of kinematic discontinuities is solved at each subset by ac-counting of discontinuities. Therefore, the rotation and elastic fields around discontinuities can now be calculated. These fields are obtained at the scale of the subset from the first gradient in the DIC calculation. This method has been validated using synthetic images with known displacements and in-situ HR-DIC measurements during monotonic deformation of a polycrystalline metal. The rotation fields measured by Heaviside-DIC during in-situ testing are compared and validated with EBSD measurements. The small lattice rotation and expansion gradients that evolve during deformation of the alloy is obtained by the combi-nation of HR-DIC measurements and Heaviside-DIC. The technique demonstrates that in a precipitate-containing nickel-based alloy, the magnitude of the plastic deformation occurs via localized shearing in slip bands.
Data Availability
The raw/processed data required to reproduce these findings cannot be shared at this time as the data also forms part of an ongoing study. Declaration of Competing Interest
The authors declare that they have no known competing financial interests or personal relationships that could have appeared to influ-ence the work reported in this paper.
Acknowledgements
The authors gratefully acknowledge the support of GE Global Research and OPALE ANR-SAFRAN Research Chair (Grant # ANR-14-CHIN-0002) involving the SAFRAN Companies, Mines ParisTech (CEMEF) and Institut Pprime (UPR CNRS 3346). The authors gratefully acknowledge S. Daly for technical discussion. The authors appreciate useful discussions with J. Laflen, A. Loghin, and J. Marte. R. Geurts (FEI/TFS) is also acknowledged for useful discussions and contributions for Autoscript microscope scripting. PGC was funded by the U.S. Naval Research Laboratory under the auspices of the Office of Naval Research. The support of ONR Grant # N00014-16-1-2982 is gratefully ac-knowledged.
References
[1] H.T. Goldrein, S.J.P. Palmer, J.M. Huntley, Automated fine grid technique for measurement of large-strain deformation maps, Optics Lasers Eng. 230 (5) (1995) 305–318,https://doi.org/10.1016/0143-8166(95)00036-NISSN 0143-8166. (URL. Interferogram Analysis).
[2] N. Bretagne, V. Valle, J.C. Dupré, Development of the marks tracking technique for strain field and volume variation measurements, NDT & E Int. 380 (4) (June 2005) 290–298,https://doi.org/10.1016/j.ndteint.2004.09.003(URL).
[3] R.D. Pfaff, P.D. Washabaugh, W.G. Knauss, An interpretation of twyman-green in-terferograms from static and dynamic fracture experiments, Int. J. Solids Struct. 320 (6) (1995) 939–955,https://doi.org/10.1016/0020-7683(94)00170-2ISSN 0020-7683. (URL. Time Dependent Problems in Mechanics).
[4] D. Post, Analysis of moiré fringe multiplication phenomena, Appl. Opt. 60 (11) (Nov 1967) 1938–1942,https://doi.org/10.1364/AO.6.001938(URL).
[5] M.A. Sutton, C. Mingqi, W.H. Peters, Y.J. Chao, S.R. McNeill, Application of an optimized digital correlation method to planar deformation analysis, Image Vision Comput. 40 (3) (August 1986) 143–150,https://doi.org/10.1016/0262-8856(86) 90057-0(URL).
[6] F. Bourdin, J.C. Stinville, M.P. Echlin, P.G. Callahan, W.C. Lenthe, C.J. Torbet, D. Texier, F. Bridier, J. Cormier, P. Villechaise, T.M. Pollock, V. Valle, Measurements of plastic localization by heaviside-digital image correlation, Acta Mater. 157 (2018) 307–325,https://doi.org/10.1016/j.actamat.2018.07.013ISSN 1359-6454. (URL).
[7] J. Réthoré, F. Hild, S. Roux, Shear-band capturing using a multiscale extended di-gital image correlation technique, Comput. Methods Appl. Mech. Eng. 1960 (49–52) (2007) 5016–5030,https://doi.org/10.1016/j.cma.2007.06.019ISSN 00457825. [8] J. Réthoré, F. Hild, S. Roux, Extended digital image correlation with crack shape optimization, Int. J. Numer. Methods Eng. 730 (2) (2008) 248–272,https://doi. org/10.1002/nme.2070ISSN 00295981.
[9] D. Deb, S. Bhattacharjee, Extended digital image correlation method for analysis of discrete discontinuity, Optics Lasers Eng. 74 (2015) 59–66,https://doi.org/10. 1016/j.optlaseng.2015.05.006ISSN 01438166. (URL).
[10] J. Poissant, F. Barthelat, A novel “subset splitting” procedure for digital image correlation on discontinuous displacement fields, Exp. Mech. 500 (3) (Mar 2010) 353–364,https://doi.org/10.1007/s11340-009-9220-2ISSN 1741-2765. (URL). [11] H. Jin, H.A. Bruck, Pointwise digital image correlation using genetic algorithms,
Exp. Tech. 290 (1) (2005) 36–39,https://doi.org/10.1111/j.1747-1567.2005. tb00202.x(URL).
[12] V. Valle, S. Hedan, P. Cosenza, A.L. Fauchille, M. Berdjane, DIC development for the study of materials including multiple crossing cracks, Exp. Mech. 550 (2) (2015) 379–391,https://doi.org/10.1007/s11340-014-9948-1ISSN 17412765. [13] V. Valle, S. Hedan, Crack analysis in mudbricks under compression using specific
development of stereo-digital image correlation, Exp. Mech. (2017),https://doi. org/10.1007/s11340-017-0363-2(URL).
[14] V. Valle, P. Bokam, A. Germaneau, S. Hedan, New development of digital volume correlation for the study of fractured materials, Exp. Mech. 590 (1) (July 2018) 1–15,https://doi.org/10.1007/s11340-018-0415-2(URL).
[15] J.C. Stinville, M.P. Echlin, D. Texier, F. Bridier, P. Bocher, T.M. Pollock, Sub-grain scale digital image correlation by electron microscopy for polycrystalline materials during elastic and plastic deformation, Exp. Mech. (2015) 1–20,https://doi.org/10. 1007/s11340-015-0083-4ISSN 0014-4851. (URL).
[16] L. Jennifer, W. Carter, Michael D. Uchic, Michael J. Mills, Impact of speckle pattern parameters on DIC strain resolution calculated from in-situ SEM experiments, Fracture, Fatigue, Failure, and Damage Evolution, 5 Springer International Publishing, July 2014, pp. 119–126, , https://doi.org/10.1007/978-3-319-06977-7_16(URL).
[17] V. Valle, L. Laou, I. Léandry, S. Yotte, S. Rossignol, S. Hedan, Crack analysis in mudbricks under compression using specific development of stereo-digital image correlation, Exp. Mech. 580 (3) (December 2017) 475–486,https://doi.org/10. 1007/s11340-017-0363-2(URL).
[18] J.C. Stinville, W.C. Lenthe, M.P. Echlin, P.G. Callahan, D. Texier, T.M. Pollock, Microstructural Statistics for Fatigue Crack Initiation in Polycrystalline Nickel-base Superalloys, International Journal of Fracture, Sep 2017,https://doi.org/10.1007/ s10704-017-0241-zISSN 1573-2673. (URL).
[19] J. Jiang, T. Zhang, F.P.E. Dunne, T.B. Britton, Deformation compatibility in a single crystalline Ni superalloy, Proc. R. Soc. A 472 (2016).
[20] A.D. Kammers, S. Daly, Self-assembled nanoparticle surface patterning for im-proved digital image correlation in a scanning electron microscope, Exp. Mech. 530 (8) (2013) 1333–1341,https://doi.org/10.1007/s11340-013-9734-5ISSN 0014-4851. (URL).
[21] J.C. Stinville, N. Vanderesse, F. Bridier, P. Bocher, T.M. Pollock, High resolution mapping of strain localization near twin boundaries in a nickel-based superalloy, Acta Mater. 98 (2015) 29–42,https://doi.org/10.1016/j.actamat.2015.07.016 ISSN 1359-6454. (URL).
[22] R. Jiang, F. Pierron, S. Octaviani, P.A.S. Reed, Characterisation of strain localisation processes during fatigue crack initiation and early crack propagation by sem-dic in an advanced disc alloy, Mater. Sci. Eng. A 699 (2017) 128–144,https://doi.org/10. 1016/j.msea.2017.05.091ISSN 0921-5093. (URL).
[23] T.E.J. Edwards, F. Di Gioacchino, H.P. Springbett, R.A. Oliver, W.J. Clegg, Stable speckle patterns for nano-scale strain mapping up to 700circC, Exp. Mech. 570 (9)
(Nov 2017) 1469–1482,https://doi.org/10.1007/s11340-017-0317-8ISSN 1741-2765. (URL).
[24] L.W. Jennifer, R.W. Carter, M.D. Uchic, M.J. Mills, In-situ mechanical testing for characterizing strain localization during deformation at elevated temperatures, Exp. Mech. 520 (4) (2012) 405–416,https://doi.org/10.1007/s11340-011-9499-7ISSN 00144851.
[25] F. Di Gioacchino, J.Q. da Fonseca, An experimental study of the polycrystalline plasticity of austenitic stainless steel, Int. J. Plastic. 74 (2015) 92–109,https://doi. org/10.1016/j.ijplas.2015.05.012ISSN 0749-6419. (URL).
[26] Z. Chen, S.H. Daly, Active slip system identification in polycrystalline metals by digital image correlation (dic), Exp. Mech. 570 (1) (Jan 2017) 115–127,https:// doi.org/10.1007/s11340-016-0217-3ISSN 1741-2765. (URL).
[27] A.D. Kammers, S. Daly, Digital image correlation under scanning electron micro-scopy: Methodology and validation, Exp. Mech. 530 (9) (2013) 1743–1761,https:// doi.org/10.1007/s11340-013-9782-xISSN 0014-4851. (URL).
[28] S. Maraghechi, J.P.M. Hoefnagels, R.H.J. Peerlings, O. Rokoš, M.G.D. Geers, Correction of scanning electron microscope imaging artifacts in a novel digital image correlation framework, Exp. Mech. (Mar 2019),https://doi.org/10.1007/ s11340-018-00469-wISSN 1741-2765. (URL).
[29] W.C. Lenthe, J.C. Stinville, M.P. Echlin, Z. Chen, S. Daly, T.M. Pollock, Advanced detector signal acquisition and electron beam scanning for high resolution sem imaging, Ultramicroscopy 195 (2018) 93–100,https://doi.org/10.1016/j.ultramic. 2018.08.025ISSN 0304-3991. (URL).
modelling and HR-DIC measurement of slip activation and strain localization in single and oligo-crystal Ni alloys under fatigue, Int. J. Plastic. 880 (Supplement C) (2017) 70–88,https://doi.org/10.1016/j.ijplas.2016.10.001ISSN 0749-6419. (URL).
[31] H. Mughrabi, Cyclic slip irreversibilities and the evolution of fatigue damage, Metall. Mater. Transac. A 400 (6) (2009) 1257–1279,https://doi.org/10.1007/ s11661-009-9839-8ISSN 1543-1940. (URL).
[32] A. Pineau, S.D. Antolovich, High temperature fatigue of nickel-base superalloys – A review with special emphasis on deformation modes and oxidation, Eng. Fail. Anal. 160 (8) (2009) 2668–2697,https://doi.org/10.1016/j.engfailanal.2009.01.010 ISSN 13506307. (URL).
[33] H.S. Ho, M. Risbet, X. Feaugas, On the unified view of the contribution of plastic strain to cyclic crack initiation: impact of the progressive transformation of shear bands to persistent slip bands, Acta Mater. 85 (2015) 155–167,https://doi.org/10. 1016/j.actamat.2014.11.020ISSN 1359-6454. (URL).
[34] T.B. Britton, J.L.R. Hickey, Understanding deformation with high angular resolu-tion electron backscatter diffracresolu-tion (HR-EBSD), IOP Conf. Ser. 304 (January 2018) 012003,https://doi.org/10.1088/1757-899x/304/1/012003(URL).
[35] J. Man, T. Vystavĕl, A. Weidner, I. Kubĕna, M. Petrenec, T. Kruml, J. Polák, Study of cyclic strain localization and fatigue crack initiation using fib technique, Int. J. Fatigue 39 (2012) 44–53,https://doi.org/10.1016/j.ijfatigue.2011.05.002ISSN 0142-1123. (URL. Physical and phenomenological approaches to fatigue damage). [36] P. Mu, V. Aubin, I. Alvarez-Armas, A. Armas, Influence of the crystalline
orienta-tions on microcrack initiation in low-cycle fatigue, Mater. Sci. Eng. A 573 (2013) 45–53,https://doi.org/10.1016/j.msea.2013.02.046ISSN 0921-5093. (URL). [37] Y.M. Hu, Z.G. Wang, Grain boundary effects on the fatigue deformation and
cracking behavior of copper bicrystals, Int. J. Fatigue 200 (6) (1998) 463–469, https://doi.org/10.1016/S0142-1123(98)00014-0ISSN 0142-1123. (URL). [38] J.C. Stinville, W.C. Lenthe, J. Miao, T.M. Pollock, A combined grain scale
elas-tic–plastic criterion for identification of fatigue crack initiation sites in a twin containing polycrystalline nickel-base superalloy, Acta Mater. 103 (2016) 461–473, https://doi.org/10.1016/j.actamat.2015.09.050ISSN 1359-6454. (URL). [39] J. Miao, T.M. Pollock, J.W. Jones, Fatigue crack initiation in nickel-based
super-alloy René 88 DT at 593°C, in: P. Caron, T.P. Gabb, M.G. Fahrmann, E.S. Huron, S.A. Woodard, R.C. Reed, K.A. Green (Eds.), Superalloys, TMS, Warrendale, PA, 2008, pp. 589–597.
[40] J.C. Stinville, E. Martin, M. Karadge, S. Ismonov, M. Soare, T. Hanlon, S. Sundaram, M.P. Echlin, P.G. Callahan, W.C. Lenthe, V.M. Miller, J. Miao, A.E. Wessman, R. Finlay, A. Loghin, J. Marte, T.M. Pollock, Fatigue deformation in a polycrystal-line nickel base superalloy at intermediate and high temperature: Competing failure modes, Acta Mater. 152 (2018) 16–33,https://doi.org/10.1016/j.actamat.2018.03. 035ISSN 1359-6454. (URL).
[41] P. Villechaise, L. Sabatier, J.C. Girard, On slip band features and crack initiation in fatigued 316L austenitic stainless steel: Part 1: analysis by electron back-scattered diffraction and atomic force microscopy, Mater. Sci. Eng. A 3230 (1–2) (2002) 377–385,https://doi.org/10.1016/S0921-5093(01)01381-8ISSN 09215093. [42] J.H. Liu, N. Vanderesse, J.-C. Stinville, T.M. Pollock, P. Bocher, D. Texier, In-plane
and out-of-plane deformation at the sub-grain scale in polycrystalline materials assessed by confocal microscopy, Acta Mater. 169 (2019) 260–274,https://doi.org/ 10.1016/j.actamat.2019.03.001ISSN 1359-6454. (URL).
[43] M.P. Miller, P.R. Dawson, Understanding local deformation in metallic polycrystals
using high energy X-rays and finite elements, Curr. Opin. Solid State Mater. Sci. 180 (5) (2014) 286–299,https://doi.org/10.1016/j.cossms.2014.09.001ISSN 1359-0286. (URL).
[44] W. Ludwig, A. King, M. Herbig, P. Reischig, J. Marrow, L. Babout, E.M. Lauridsen, H. Proudhon, J.Y. Buffière, Characterization of polycrystalline materials using synchrotron X-ray imaging and diffraction techniques, JOM 620 (12) (Dec 2010) 22–28,https://doi.org/10.1007/s11837-010-0176-6ISSN 1543-1851. (URL). [45] D.C. Pagan, P.A. Shade, N.R. Barton, J.S. Park, P. Kenesei, D.B. Menasche,
J.V. Bernier, Modeling slip system strength evolution in ti-7al informed by in-situ grain stress measurements, Acta Mater. 128 (2017) 406–417,https://doi.org/10. 1016/j.actamat.2017.02.042ISSN 1359-6454. (URL).
[46] Y. Guo, T.B. Britton, A.J. Wilkinson, Slip band–grain boundary interactions in commercial-purity titanium, Acta Mater. 76 (2014) 1–12,https://doi.org/10.1016/ j.actamat.2014.05.015ISSN 1359-6454. (URL).
[47] P. Villechaise, J. Cormier, T. Billot, J. Mendez, Mechanical behaviour and damage processes of Udimet 720Li: influence of localized plasticity at grain boundaries, 12th International Symposium on Superalloys, Superalloys2012, 2012, pp. 15–24. [48] F. Di Gioacchino, W.J. Clegg, Mapping deformation in small-scale testing, Acta
Mater. 78 (2014) 103–113,https://doi.org/10.1016/j.actamat.2014.06.033ISSN 1359-6454. (URL).
[49] J.C. Stinville, P.G. Callahan, M.A. Charpagne, M.P. Echlin, V. Valle, T.M. Pollock, Direct measurements of slip irreversibility in a nickel-based superalloy using high resolution digital image correlation, Acta Mater. 186 (2020) 172–189,https://doi. org/10.1016/j.actamat.2019.12.009ISSN 1359-6454. (URL).
[50] M.A. Sutton, J.R. Sharpe, N. William, Digital image correlation for shape and de-formation measurements, Springer Handbook of Experimental Solid Mechanics, Springer US, 2008, pp. 565–600 ISBN 978-0-387-26883-5. (URL).
[51] D. Texier, A.C. Gómez, S. Pierret, J.M. Franchet, T.M. Pollock, P. Villechaise, J. Cormier, Microstructural features controlling the variability in low-cycle fatigue properties of alloy inconel 718da at intermediate temperature, Metall. Mater. Trans. A 470 (3) (January 2016) 1096–1109, https://doi.org/10.1007/s11661-015-3291-8(URL).
[52] M.A. Charpagne, F. Strub, T.M. Pollock, Accurate reconstruction of ebsd datasets by a multimodal data approach using an evolutionary algorithm, Mater. Character. 150 (2019) 184–198,https://doi.org/10.1016/j.matchar.2019.01.033ISSN 1044-5803. (URL).
[53] Z. Chen, W.C. Lenthe, J.C. Stinville, M.P. Echlin, T.M. Pollock, S. Daly, High-re-solution deformation mapping across large fields of view using scanning electron microscopy and digital image correlation, Exp. Mech. 58 (2018) 1407–1421, https://doi.org/10.1007/s11340-018-0419-y.
[54] P.C. Hung, A.S. Voloshin, In-plane strain measurement by digital image correlation, J. Brazil. Soc. Mech. Sci. Eng. 250 (3) (September 2003),https://doi.org/10.1590/ s1678-58782003000300001(URL).
[55] B. Larrouy, P. Villechaise, J. Cormier, O. Berteaux, Grain boundary–slip bands in-teractions: impact on the fatigue crack initiation in a polycrystalline forged ni-based superalloy, Acta Mater. 99 (2015) 325–336,https://doi.org/10.1016/j.actamat. 2015.08.009ISSN 1359-6454. (URL).
[56] A.J. Wilkinson, T.B. Britton, Strains, planes, and ebsd in materials science, Mater. Today 150 (9) (2012) 366–376,https://doi.org/10.1016/S1369-7021(12)70163-3 ISSN 1369-7021. (URL).
![Fig. 1. An example of a high resolution DIC measurement from SEM images, taken from [18], exhibiting high strain gradients and slip localization in bands that are strongely influenced by the microstructure](https://thumb-eu.123doks.com/thumbv2/123doknet/12253309.320231/3.892.59.614.701.1100/resolution-measurement-exhibiting-gradients-localization-strongely-influenced-microstructure.webp)