A constitutive model for North Sea Chalk. Application to reservoir
compaction and to waterflooding.
R.Charlier, F.Collin, C.Schroeder & P.Illing
Département GéomaC, University of Liège, BelgiumP.Delage, Y.J.Cui & V.De Gennaro
CERMES, Ecole Nationale des Ponts et Chaussées, France
1 INTRODUCTION
The compaction of chalky reservoirs during oil ex-traction and other important problems like the "cas-ing collapse" or the "chalk production" are related to the mechanical properties of chalk. Controlling compaction is very important because reservoir de-formations imply seabed subsidence that endangers the offshore stations.
The first explanation of subsidence related the compaction to the pore pressure decrease in the re-servoir. The solution was the injection of gas and water into the oilfield in order to repressurise the reservoir. But the waterflooding induced additional subsidence. Though many studies have been already performed on chalks, the basis mechanism of the water sensitivity was not defined. Obviously, no sat-isfactory constitutive law can be written without this deep insight of the phenomenon. This is the scope of the ongoing EC Research Program Pasachalk. The origin of the research is in the comparison of ex-perimental results obtained on Lixhe chalk and on Jossigny silt which showed that the influence of wa-ter on pure high porosity chalk is similar to that on partially saturated soils (Delage & al. 1996). An-other extensive experimental analysis of the influ-ence of the saturating fluid on Lixhe chalk behaviour concluded that the water-weakening effect might be suction related. Hence the idea appeared to apply the knowledge, the approach, and the tools of the par-tially saturated soil mechanics to the understanding, description, and modelling of chalk behaviour dur-ing changes in saturation fluids, such as when water-flooding.
This paper presents the developed constitutive model, which is a cap type plasticity model coupled with the Barcelona one (Alonso & al. 1990) for tak-ing the suction effect into account.
The model parameters are calibrated based on the experimental results. The validation of the model is performed on a waterflooding experiment. We show that the model is able to reproduce qualitatively and quantitatively the observed basic phenomena.
2 CONSTITUTIVE MODELS
Experiments performed on chalk samples have shown two plastic mechanisms: the pore collapse for high mean stresses (contractant behaviour) and the frictional failure for low mean stresses. The pore collapse could be caused by the breakdown of phys-ico-chemical bonds between the grains inducing some grain-to-grain slip (Monjoie & al. 1990). The frictional failure corresponds to a plastic distortion inducing an increase of porosity.
The two evidenced plastic mechanisms are mod-eled by two yield surfaces combined within a cap model: the modified Cam-Clay model is used for pore collapse whereas an internal friction model for friction failure. Experimental results show that the chalk strength under extension can be overestimated using an internal friction model, a third yield surface is then adopted to limit traction stresses.
Obviously, the so defined yield curve is not con-tinuously derivable at the intersections, leading to numerical difficulties. However, recent publications ABSTRACT: Subsidence of chalk oil reservoirs in North Sea is related to the chalk compaction induced by fluid depletion and by the water – chalk interaction. A constitutive model is developed in order to take into account these two effects. It is based on frictional – cap elastoplasticity and on the Barcelona unsaturated soil model. Oil – water – chalk interaction is modeled through the suction variable. The two saturating fluids flow is also developed. After implementation into a finite element code, these tools allow to simulate a waterflood-ing experiment on a chalk sample. The model appears to reproduce qualitatively and quantitatively the ex-perimental results.
provided an elegant way to solve this problem (Simo & Hugues, 1998).
As far as the suction effect is concerned, the model adopts the approach developed in the Barce-lona Basic Model (Alonso & al. 1990) where the suction is considered as an independent variable. Suction modifies yield surfaces and produces re-versible and irrere-versible deformations.
Moreover, two fluids flow model is also pre-sented, in order to be able to analyse fully coupled problems. The multi-phase flow model is based on works in relation with the problem of nuclear waste disposal (Collin & al. 2001).
2.1 Mechanical model
The mechanical model is expressed in terms of the following stress invariants and the suction:
ii Iσ =σ (1) ij ij ij ij ij I IIσ σ σ σ σ σ δ 3 ˆ , ˆ ˆ 2 1 ˆ = = − (2) ki k j ij IIIσ σˆ σˆ σˆ 3 1 ˆ = (3) ⎟⎟ ⎠ ⎞ ⎜⎜ ⎝ ⎛ − = − 3 ˆ ˆ 1 2 3 3 sin 3 1 σ σ β II III (4) w o p p s= − (5)
Where β is the Lode angle, s is the suction, po and pw
are the oil and water pressures. 2.1.1 General formulation
The general elastoplastic relations are formulated in rate form. The strain rate is composed of a mechani-cal part (superscript m) and of suction one (super-script s). Each contribution is partitioned in an elas-tic (superscript e) and a plaselas-tic component (superscript p): p s ij p m ij e s ij e m ij ij , , , , ε ε ε ε
ε& = & + & + & + & (6)
The mechanical elastic part is related to the Jau-mann objective stress rate through Hooke’s law:
e , m ij e klij kl C ~ ε σ = & (7)
Where Ce is the compliance elastic tensor.
For the plastic parts, a general framework of non-associated plasticity is adopted in order to limit dila-tancy. In that case, the plastic flow rate is derived from a plastic potential gα:
ij p p , m ij g ∂σ ∂ λ ε & α & = , (8)
where λp is a scalar multiplier and gα is the plastic potential related to the plastic mechanism α.
Elastic and plastic deformations related to suction changes are defined following expressions given in Barcelona Basic Model. Irreversible deformations are induced when the suction becomes higher than a suction level s0.
(
) (
s p)
h s s e e ij ij at s e , s ij & & & = + + = κ δ ε 1 (9)(
) (
)
h s p s s e p ij ij at s s p s ij & & & = λ +−κ + δ = ε 1 , (10) Where e is the void ratio, pat is the atmosphericpres-sure, κs and λs are elastic and plastic coefficients.
The equations (6) and (7) can be rewritten as:
⎟ ⎟ ⎠ ⎞ ⎜ ⎜ ⎝ ⎛ − ∂ ∂ − − =C h s g h s ~ p ij ij p e ij ij e klij
kl ε& & λ& σ &
σ α
(11) Considering a general hardening/softening plastic
law depending on the internal variable ζ, the consis-tency condition related to the yield function fα can be formulated as: 0 = + + = ζ ∂ζ ∂ ∂ ∂σα α α ~ s
f& ∂ σ ∂ & fα & s f f ij ij (12) Substituting (11) in (12), the expression of
multi-plier λp can be found and the stress rate can be com-puted: s M ) C C ( ~ kl ij p klij e klij kl = − ε& − & σ (13)
The first term of the right part is the classical ex-pression of an elastoplastic formulation. The second term is related to the suction.
2.1.2 CamClay model
The Cam-Clay yield surface is defined by the fol-lowing expression:
(
3)
0 3 0 C 2 2 1 ⎟⎟ − = ⎠ ⎞ ⎜⎜ ⎝ ⎛ + + ≡ I p tan c I m II f σˆ σ φ σ (14)Where c is the cohesion, φC is the friction angle in compression path, p0 is the preconsolidation pres-sure, which defines the size of the yield surface, and
m is a coefficient introduced to take into account the
effect of the third stress invariant. The coefficient m is defined by:
(
)
nsin b a
m= 1+ 3β (15)
where the parameters a, b and n must verify some convexity conditions (Van Eekelen 1980).
The plastic flow is supposed to be associated and the internal variable is the pre-consolidation pres-sure p0, which is related to the volumetric plastic de-formations dεvp following the kinematic equation:
p v d p e dp ε κ λ 0 0 1 − + = , (16)
where λ is the compression coefficient and κ is the elastic coefficient.
Using this relation, either hardening or softening could appear according to the sign of the volumetric plastic deformations. However, in the cap model, the softening zone will not be considered.
2.1.3 Internal friction model
A more sophisticated model can be built from the Drucker-Prager’s cone by introducing a dependence on the Lode’s angle β, in order to match more closely the Mohr-Coulomb criterion. It consists of a smoothed Mohr-Coulomb plasticity surface. The formulation based on the idea of Van Eekelen (1980) is used. It can be written in a very similar way to the Drucker-Prager’s criterion:
0 3 C = ⎟⎟ ⎠ ⎞ ⎜⎜ ⎝ ⎛ + − ≡ φ σ σ tan c I m II f2 ˆ (17)
A non-associated plasticity is considered here us-ing a plastic potential definition similar to Eq. 17 where the dilatancy angle ψ is used instead of the frictional angle.
The internal variables of the model are the fric-tional angles φC (for compression paths), φE (for ex-tension paths) and the cohesion c. The following hardening relations are defined using the plastic equivalent deformations:
(
)
(
)
(
)
p eq c p eq f p eq p p eq E Ef E E p eq p p eq C Cf C C B c c c c B B ε ε ε ε φ φ φ φ ε ε φ φ φ φ + − + = + − + = + − + = 0 0 0 0 0 0 (18)where subscripts 0 and f mean the initial and the fi-nal value respectively; Bp and Bc are parameters
de-fining the plastic deformation for which half of the internal variable hardening is achieved.
The equivalent plastic strain represents the cumu-lated equivalent or deviatoric plastic strains du-ring time t:
∫
= t p eq p eq dt 0 ε ε & , (19)2.1.4 Suction effect on yield surface
Several phenomena are usually evidenced for un-saturated soils:
1. The preconsolidation pressure p0 and the
mate-rial stiffness increase with suction. This is described by the LC concept of the Barcelona model:
κ λ κ λ − − ⎟⎟ ⎠ ⎞ ⎜⎜ ⎝ ⎛ = (s) ) ( c * c p p p ) s ( p 0 0 0 (20) with
[
( −r)exp(− 's)+r]
=λ β λ(s) (0) 1 (21)where p0* is the preconsolidation pressure for s = 0,
pc is a reference pressure, λ(0) is the compression
coefficient at zero suction, λ(s) is the compression coefficient at suction s, r is a parameter representing
the maximum stiffness of the chalk, and β′ is a pa-rameter controlling the stiffness increase with suc-tion increase.
2. Cohesion increases with suction, this is model-led using Eq. 22. The influence of suction on friction angle depends on the material studied. Experiment on chalk shows that friction angle is independent of the saturating fluid.
s k c
c(s)= (0)+ (22)
where k is a material constant, c(0) is the cohesion at
saturated state.
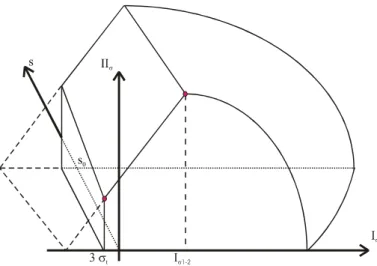
3. Suction changes may create irreversible strains. In the Barcelona model, this is modelled thanks a yield surface, the SI “Suction Increase” curve. When suction becomes higher than a suction level s0, plastic strains are created. This yield
crite-rion is introduced in our constitutive law: 0
0 4 ≡s−s =
f (23)
Figure 1 presents all the yield surfaces in the stress space.
s0
2.2 Numerical law integration
The existence of four yield surfaces in the model leads to complex law integration. One has not only to determine which plastic mechanism is active, but also to manage the case where two surfaces are ac-tive. This case occurs at the intersection of two sur-faces: the apex regime is a combination of two mechanisms.
Integration over time of the general rate constitu-tive elastoplastic relation (13) leads to the incre-mental form:
(
Cijkle Cijklp)
kl Mkl sij = − ∆ − ∆
∆σ ε (24)
The method used here is commonly based on the operator-split methodology (Simo & Taylor 1985), which consists in computing an elastic predic-tor/plastic corrector. The elastic predictor computed, one can determine the active plastic regime. This is important when the stress state is close to an apex. It must be mentioned that the notion of proximity is relative and arbitrary.
Hughes & Simo (1998) proposed a technique for integrating the law in an apex regime in accordance with which the following consistency conditions must be verified: ⎩ ⎨ ⎧ = = = = 0 and 0 0 and 0 2 1 2 1 f f f f & & (25)
f1 and f2 being the yield functions related to the
plas-tic mechanisms 1 and 2, respectively.
The plastic strain is the sum of the plastic strains due to the mechanisms 1 and 2:
ij , p ij , p , p ij , p ij p ij g g σ λ σ λ ε ε ε ∂ ∂ + ∂ ∂ = + = 1 2 & 1 1 & 2 2 & & & (26)
Where g1 and g2 are the plastic potentials associated
respectively to the plastic mechanisms 1 and 2. Considering that yield surfaces (fα, α = 1, 2) are
only function of the stress state (σij), suction s and
hardening variables (ζα), the Taylor's series for
con-sistency conditions (25) are given as:
(
)
(
)
α α α α α α α α α α ζ ∂ζ ∂ ∂ ∂ σ ∂σ ∂ ζ σ ζ ζ σ σ ∆ + ∆ + ∆ + = ∆ + ∆ + ∆ + f s s f f s f s s f p ij ij ij p ij ij , , , , (27) With(
,1 p,2)
kl p kl e ijkl p ij C ε ε σ =− ∆ + ∆ (28) α α α α ε ε ζ ζ p, , p d d ∆ = ∆ (29)The plastic strains can be expressed in a general form as:
α
α λ
εp, = &pVal
∆ (30)
Where Valα is a function of the plastic potential de-rivatives.
Using equations (26), (28) and (29), equation (27) can be re-written:
(
)
α α α α α α α α α α α λ ε ζ ζ ∂ ∂ ∂σ ∂ λ ∂σ ∂ ζ σ , , 2 1 , , , p p n kl n n p e ijkl ij ij d d f Val s s f g C f s f f ∆ ∂ + ∆ ∂ + ⎟⎟ ⎠ ⎞ ⎜⎜ ⎝ ⎛ ∆ − =∑
= (31)Knowing that in the plastic regime f = 0, the pre-vious relation gives an incremental consistency equation for each mechanisms.
The system of equations provides the value of the two plastic multiplicators, and . When both values are positive, the two mechanisms are ac-tivated simultaneously, however, if one multiplicator is negative, the corresponding mechanism must not be activated, and the computation is reiterated only with the other yield surface.
1 , p λ ∆ ∆λp,2 2.3 Diffusion model
Unsaturated flow formulation used here is based on works in relation with the problem of nuclear waste disposal (Collin & al. 2001). For each fluid (Water and oil), balance equations and state equations are written. In partial saturation conditions, the perme-ability and the storage law have to be modified: a generalised Darcy's law defines the fluid motion (Bear 1972). Numerous couplings existing between mechanics and flows are considered.
2.3.1 Water
The generalised Darcy's law for multiphase porous medium gives liquid water velocity:
[
( ) ( )]
int , y grad g p grad k k f w w w w r w =− µ + ρ (32)Where fw is water macroscopic velocity; ρw is water
density; pw is the liquid water pressure; y is the
ver-tical upward directed co-ordinate; g is the gravity acceleration; µw is the dynamic viscosity of the
liq-uid water; kint is the intrinsic permeability of the
me-dium and kr,w is the water relative permeability
which varies with respect to the saturation degree. The balance equation includes the variation of water storage and the divergence of water flows:
(
.)
0 * + = w w w div f f t ρ ∂ ∂ (33)where t is the time and fw* is the water storage:
w r w
w nS
with n the porosity and Sr,w the water saturation
de-gree.
The water density is depending on water pressure according to: ⎟⎟ ⎠ ⎞ ⎜⎜ ⎝ ⎛ − + = w , w w , w w p p χ ρ ρ 0 0 1 (35)
where ρw,0 is the water density at reference pressure
pw,0, ρw is the density at pressure pw and χw is the
water compressibility. 2.3.2 Oil
Considering the generalised Darcy's law for multiphase porous medium, oil velocity is given by:
[
( ) . . ( ) . int , y grad g p grad k k f o o o sat o r o =− µ + ρ]
(36)Where fo is oil macroscopic velocity; ρo is oil
den-sity; po is the oil pressure; µo is the dynamic
viscos-ity of oil and kr,o is the oil relative permeability
which depends on the oil saturation degree Sr,o = 1 -
Sr,w
The oil balance equation is given by the relation:
(
.)
0 *+ = o o o div f f t ρ ∂ ∂ (37) And the oil storage is defined by:o r o
o nS
f* =ρ . . , (38)
The oil density is depending on oil pressure accord-ing to a relationship similar to equation (35).
3 WATER-FLOODING TEST MODELING
The water-flooding test performed on Lixhe chalk initially saturated by SoltrolTM (Schroeder & al. 1998) allows validating the developed model.
3.1 Description
The sample with an initial porosity n = 40.55 % and permeability kint = 1mDarcy has dimensions of
25 mm of diameter and 50 mm of height. Four strain gauges are glued on the sample (located respectively from the injection side at a distance of 4, 12, 22 and 30 mm), which aims to monitoring the evolution of the axial deformation with the waterfront. In addi-tion, an axial LVDT records the global axial defor-mation.
The initial stress state is isotropic at a level of 18 MPa, just below the expected pore collapse for 'oil-like' plug. The injection water pressure is equal to 0.9 MPa. Just before the injection front, a small swelling is measured by the strain gauges but a bru-tal and quasi-instantaneous compaction appears at
the waterfront. The final amplitude of the compac-tion is around 2%-3%.
3.2 Parameters of the model
Experiment results of triaxial tests on saturated sam-ples allow us to define the yield surface of oil-like and water-like plugs. The transition between these two cases is characterized by results of suction con-trolled oedometer tests. The parameters of the me-chanical model are presented in Table 1.
Table 1. Parameters of the Cap model
Parameter Value Unit
Non linear Elasticity
κ 0.0085 - ν 0.2 - Frictional mechanism φwater 25 ° φoil 25 ° cwater 1.5 MPa coil 2.0 MPa k 0.167 - CamClay + suction LC po,water 12 MPa po, oil 18 MPa Hardening rule λ(0) 0.18 - r 0.95 - β' 8.0 MPa-1 pc 3. 10-3 MPa
The porosimetric curve of Lixhe chalk allows to determine the retention curve (see Delage & al. 1995 for the method). The following expression is pro-posed: 2 3 1 2 3 CSR CSR CSR s arctan CSR Sr,w ⎟+ ⎠ ⎞ ⎜ ⎝ ⎛− + = π (39)
Where CSR1, CSR2, and CSR3 are soil constants with values CSR1 = 100 kPa; CSR2 = -325 kPa and CSR3 = 1.
It should be mentioned that this curve is defined for drying paths. However, waterflooding involves rather wetting paths. Moreover, during a water-flooding test, water drives out the oil present in the pores but a residual quantity of oil (about 30%) re-mains in the sample. This corresponds to the well-known hysteretic phenomenon. To match this ex-perimental result, some numerical modifications are necessary, giving rise to another retention curve de-fined by the following parameters:
CSR1 = 1.0 105 Pa; CSR2 = -9.50 104 Pa and CSR3 = 0.75 for wetting path.
Generally in unsaturated soils, the relative per-meability is supposed to be a function of the satura-tion degree. The following expressions are used in order to fit experimental relative permeability curves:
(
)
2(
5 3)
1 1 e e/ oil , rel S . S k = − − (40)(
)
(
)
6 6 res field , r res w , r water , rel S S S S k − − = (41) where res field r res rw e S S S S S − − = , (42) is the effective saturation, Sres is the residualsatura-tion and Sr,field is the field saturation.
The experimental curve fitting gives Sres = 0.01; Sr,field = 1.
3.3 Numerical Simulations
The modelling of the waterflooding test needs the definition of the initial and boundary conditions. Initial conditions: the oil pressure is fixed at 100 kPa but the water pressure is unknown. As the sample is quite oil saturated, the initial suction may be estimated using the retention curve. If an initial suction of 3 MPa is chosen, it corresponds to a water pressure equal to –2.9 MPa and water saturation equal to 1.23%.The initial total stress state is iso-tropic at a level of 18 MPa.
Boundary conditions: at the bottom of the sam-ple, the water pressure is brought to 0.9 MPa. The oil can go out the sample at the upper part where oil pressure is fixed at 100 kPa. The boundary condition for the water at top of the plug is difficult to define: if the boundary is considered as impervious, no wa-ter goes out of the sample even if the wawa-ter front reaches the top; if the water pressure is fixed at the top, the pressure will remain at the initial value. A specific boundary element was developed for this problem: the boundary is impermeable when the pressure is lower than a given value. In our case, the value corresponds to the atmospheric pressure.
The comparison of the numerical results with the experimental data is shown in Figure 2. The injected water volume evolution is similar. After 3500 sec, the waterfront reaches the top; no more oil is driven out of the sample and water is produced at the top. The computed axial strains at the four gauges pre-sent a small swelling followed by a brutal collapse of around 2.5% (Figure 3). 0 1 2 3 4 5 6 7 0 500 1000 1500 2000 2500 3000 3500 4000 Time [sec] Volume [cm³] Injected water Expelled Soltrol Expelled water LGIH-Injected Water
Figure 2: Fluid exchange during water flooding
-10 -5 0 5 10 15 20 25 0 500 1000 1500 2000 2500 3000 3500 Time [sec] Ax ia l d e fo rma tio n [°/°°] G1 - ExpGauge 1 G2 - Exp Gauge 2 G3 - Exp Gauge 3 G4 - Exp Gauge 4
Figure 3: Axial strains at the four gauges
The experiment value of strain stops at 1%, which corresponds to the gauge failure.
The good consistence obtained between the nu-merical simulation and the experimental responses shows the validity of the developed model for de-scribing the chalk behaviour during water injection.
ACKNOWLEDGMENTS
The authors are grateful to the FNRS, the European Union and to the Communauté Française de Bel-gique for their financial support to this research pro-ject.
REFERENCES
Alonso, E.E. Gens, A. & Josa, A. 1990. A constitutive model
for partially saturated soils. Géotechnique 40(3): 405-430.
Bear, J. 1972. Dynamics of fluids in porous media. American
Elsevier Environmental science series 1972.
Collin, F. Li, X.L. Radu, J.P. & Charlier, C. 2001.
Thermo-hydro-mechanical couplings in clay barriers. Engineering Geology. Accepted 2001.
Delage, P. Audiguier, M. Cui, Y.J. & Deveughele, M. 1995.
Water retention proprieties and microstructure of various
geomaterials. Proceedings of the 11th ECSMFE,
Copen-hague, Vol. 3, pp. 43-48.
Delage, P. Schroeder, C. & Cui, Y.J. 1996. Subsidence and
capillary effects in chalk. Proc. Eurock 96, Turin 1996:
1291 – 1298.
Monjoie, A. Schroeder, C. Prignon, P. Yernaux, C. da Silva, F. & Debande, G. 1990. Establishment of constitutive laws of
chalk and long term tests. Proc. 3rd Sea Chalk Symposium, Copenhagen June 1990.
Schroeder, C. Bois, A.P. Maury, V. & Hallé, G. 1998.
Wa-ter/chalk (or collapsible soil) interaction: Part II. Results of tests performed in laboratory on Lixhe chalk to calibrate water/chalk models. SPE/ISRM Eurock'98 Trondheim (SPE 47587) 1998.
Simo, J.C. & Taylor, R.L. 1985. Consistent tangent operators
for rate-independent elastoplasticity. Computer Method in Applied Mechanics and Engineering 48:101-118.
Simo, J.C. & Hughes, T.J.R. 1998. Computational Inelasticity.
Interdisciplinary applied mathematics, 7:198-218.
Van Eekelen, H.A.M. 1980. Isotropic yield surfaces in three
dimensions for use in soil mechanics. International Journal for Numerical and Analytical Methods in Geomechanics