OATAO is an open access repository that collects the work of Toulouse
researchers and makes it freely available over the web where possible
Any correspondence concerning this service should be sent
to the repository administrator:
[email protected]
This is an author’s version published in:
http://oatao.univ-toulouse.fr/22933
To cite this version:
Pujol, Luca
and Evrard, David
and Gros, Pierre
and Freyssinier, Mathilde
and Ruffien-Cizsak, Audrey and Groenen Serrano, Karine
The boron-doped
diamond for an all-in-one system of mineralization and detection of lead in
waters. (2019) ChemElectroChem, 6 (4). 1225-1228. ISSN 2196-0216
Boron-Doped Diamond as an All-In-One System for the
Mineralization and Detection of Lead in Waters
Luca Pujol,
[a, b]David Evrard,
[a]Pierre Gros,
[a]Mathilde Freyssinier,
[b]Audrey Ruffien-Cizsak,
[b]and Karine Groenen Serrano*
[a]Boron-doped diamond (BDD) electrodes were used in a single-compartment electrochemical cell to monitor the degradation of organic matter (OM) and the detection of lead in water. Using sulfuric acid as the electrolyte, the mineralization step was almost complete after 20 min under galvanostatic electrol-ysis conditions, irrespective of the OM [i.e. phenol or humic acid (HA)]. Nevertheless, H2SO4 was not suitable for samples
containing Pb(II), as it induces PbSO4precipitation. On the other
hand, the use of HNO3 resulted in a decrease in the HA
degradation yield to 30%, but remained at 90% for phenol without any interference with respect to lead detection. Under these latter experimental conditions, the assay of Pb(II) was performed by using differential pulse anodic stripping voltam-metry. The BDD electrode exhibited a linear response in the range 1–10 ppm with a normalized sensitivity of 2.66 nCppm@1min@1. Accurate results were obtained in
solu-tions containing 20 ppm phenol, as compared to reference technique analysis.
Owing to their widespread occurrence in natural media and especially water,[1] trace metals represent a growing
environ-mental and health threat.[2]Among them, lead (Pb) is one of the
most toxic, since it can cause adverse health effects such as renal failure, cardiovascular or neurologic diseases or even death.[3] Its high toxicity combined to bioaccumulation
phe-nomena all along the trophic chain make it deleterious even at very low concentration.[4]Pb is released in the environment by
many industrial processes, including mining operations and ore processing, metallurgy and electroplating, chemical industries, dyes and pigments or petroleum refining.[5]Consequently, it is
considered as one of the most abundant and toxic trace metal pollutants.[6]Thus, there is an urgent need for the development
of sensors dedicated to Pb(II) determination. Electrochemistry is particularly well-suited to face this critical challenge since it allows sensitive, reliable and cheap sensors to be built.[7]
However, water generally contains natural organic matter (OM), mainly as its humic or fulvic acid forms,[8] or other
organics originating from anthropogenic activities (pesticides, pharmaceuticals, and so on).[9] These latter OM can severely
hamper the electrochemical detection of trace metals by acting as a complexing agent.[10] Figure 1 shows for instance the
differential pulse anodic stripping voltammograms (DPASVs) recorded for two different Pb(II) concentrations in the absence and presence of OM. Phenol and humic acid (HA) were chosen to stand for anthropogenic and natural OM, respectively. Whatever the Pb(II) concentration and the kind of OM considered, the Pb(0) reoxidation signal recorded around @0.43 V showed an almost 50% decrease when OM was present in the solution. This result clearly shows that OM makes a great part of the metallic cations unavailable for electro-chemical preconcentration and subsequent stripping detection. Thus, OM removal has to be considered a mandatory step prior to Pb(II) electrochemical determination. This removal process can be easily achieved by electrochemical means.[11]
In this context, boron doped diamond (BDD) appears to be a material of interest since it can advantageously fix both issues: on the one hand, BDD has been successfully used to detect trace metals such as Pb(II)[7]and, on the another hand, it has
demonstrated very good performances in OM degradation by producing strong oxidizing agents such as hydroxyl radicals (!
OH) from water discharge reactions.[12]Thus, we have recently
designed a 5-mL mineralization cell including two BDD electro-des of 2.25 cm2active surface area as anode and cathode.[13]It is
worth noting that this latter cell does not include any separator. Indeed, a membrane separator was first added to the cell in order to prevent metal cations reduction at the cathode. However, in our case preliminary tests conducted in 0.5 M HNO3
(not shown) highlighted that the use of a Nafion® separator induced a metal loss around 15–25% depending on the initial Pb(II) concentration, due to adsorption phenomena on the membrane surface. On the contrary, mineralization performed in the absence of separator lead to metal loss lower than 2%. This result is very surprising considering that Pb(II) is expected to both oxidize and reduce following Reactions (1) and (2):[14]
Pb2þþ 2 H
2O ! PbO2þ 4 Hþþ 2 e@ ð1Þ
Pb2þþ 2 e@! Pb ð2Þ
This apparent lack of reactivity of Pb(II) can be accounted for considering the very high current used for the electrolyses, ca. 0.5 A (j=0.22 Acm@2), compared to that of Pb(II) oxidation
[a] L. Pujol, D. Evrard, P. Gros, Prof. K. Groenen Serrano Laboratoire de Génie Chimique
Université de Toulouse, CNRS, INP, UPS Toulouse, France
E-mail: [email protected] [b] L. Pujol, M. Freyssinier, A. Ruffien-Cizsak
ARCYS
14 place Marcel Dassault, Blagnac, France
An invited contribution to a Special Collection dedicated to Trends in Synthetic Diamond for Electrochemical Applications
or reduction (ratio of 3000): in such harsh conditions, very important amounts of dioxygen and hydrogen are produced at the anode and cathode, respectively, resulting in a bubble “curtain” close to the electrode surfaces. These curtains prevent Pb(II) access to the electrode surface, and subsequent electron transfer process.
The efficiency of OM degradation using different electro-lytes was then checked. Figure 2 depicts the evolution of the temporal total organic carbon (TOC) removal during the electrolysis. In 0.5 M HNO3, TOC removal reached 90% after
20 min starting from 20 ppm phenol, showing that this latter compound was satisfactorily mineralized under the experimen-tal conditions used (Figure 2). This results contrasts with the report by Cañizares et al.,[15]who have evidenced the formation
of polymers during the electro-oxidation of nitrogenated aromatics using a BDD anode. In our case the very high current used allows phenol to be mineralized directly without the
formation of any intermediary species.[16] On the contrary,
starting from 20 ppm HA, TOC removal only reached 30% at the end of the electrolysis, indicating that HA was only partially mineralized. This very low TOC removal may be due to the fact that HA degradation secondary products hardly reacts with the
!OH radicals, thus leading to incomplete OM mineralization.[17]
It is worth noting that others studies have reported that the electrochemical degradation of HA was achieved on dimension-ally stable anode (DSA) using sodium chloride as electrolyte,[18]
but in this case the role of undesired chlorinated species formed during the process was not discussed.
In order to improve the mineralization process, another set of experiments was conducted using H2SO4electrolyte. In such
a medium, both phenol and HA exhibited TOC removals higher than 90%, indicating that the OM degradation was almost complete. This result is due to the fact that sulfuric acid has to be considered an “active electrolyte”.[19] Indeed, it has been
proved that on BDD, sulfate anions can generate very strong oxidizing agents such as sulfate radicals SO4! @.[20]These latter
radicals are more likely to participate in electron transfer reactions and promotes the decarboxylation of carboxylic acids,[21]contrary to !OH which rather participates in hydrogen
abstraction or addition reactions but has very low rate constant with ammonia,[22]fulvic acid and humic acid.[21a]Zhou et al. have
compared the rate constants of reactions between chemicals and !OH or SO
4!@ and have showed that most of the rate
constants of!OH were higher than those of SO 4!@.[23]
However, it is noteworthy that H2SO4 is actually not a
suitable medium for OM mineralization if subsequent Pb(II) trace determination is envisaged, due to the solubility constant value of 1.6×10@8for PbSO
4: although Pb(II) is present at very
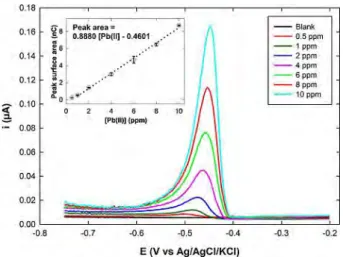
low amounts (between 0.5 and 10 ppm, see Figure 3), the very high SO42@concentration (0.5 M) implies the formation of solid
Pb(II) sulfate. Thus, with the aim of Pb(II) determination after OM mineralization, this latter process was performed in HNO3.
Figure 1. DPASVs recorded on a BDD electrode in 0.01 M HNO3containing 500 ppb (blue lines) or 1000 ppb (red lines) Pb(II) in the absence (solid lines) or presence (dashed lines) of 3 ppm A) HA or B) phenol.
Figure 2. Variation of TOC during electrolysis of solutions containing organic matter (HA: triangles, phenol: circles), using 0.5 molL@1H
2SO4(black symbols) or HNO3(white symbols), [TOC]0= 20 ppm, i=0.5 A (j=0.22 Acm@2).
In order to test the capability of BDD with respect to Pb(II) trace determination, successive amounts of Pb(II) were added to a 0.01 M HNO3solution and the corresponding DPASVs were
recorded (Figure 3). Under the experimental conditions used (See Experimental Section for DPASV parameters), the BDD electrode exhibited a linear response in the range 1–10 ppm Pb (II), with a correlation coefficient of 0.996 (Figure 3, inset). From the slope of the calibration curve, the normalized sensitivity with respect to preconcentration duration was calculated 2.66 nCppm@1min@1. For each Pb(II) concentration, DPASVs
were recorded at least twice, highlighting a good repeatability of the measurements. The limit of detection (LOD) and limit of quantification (LOQ) were estimated 0.55 ppm and 0.6 ppm, respectively, using Equations (3) and (4):
LOD¼B þ 3s ð3Þ
LOQ¼B þ 10s ð4Þ
where B and σ are the average value and the standard deviation of the baseline, respectively. For this purpose, 10 successive baselines were recorded.
Finally tests combining both a mineralization and a detection step were conducted. Two 0.01 M HNO3 solutions
containing 20 ppm phenol were spiked with 5 and 8 ppm Pb(II), respectively. Both solutions were mineralized for 20 min prior to record DPASVs. The as-obtained Pb(II) concentrations were compared to reference technique analysis, namely inductively coupled plasma – atomic emission spectroscopy (ICP-AES). The results are summarized in Table 1.
For both concentrations, the values found after electro-chemical mineralization were very close to that obtained by ICP-AES, thus demonstrating the reliability of the proposed system which combines OM electrochemical degradation and trace metal electrochemical detection.
In conclusion, this preliminary work demonstrated the interest of BDD as electrode material for an all-in-one system of mineralization and detection of lead in waters. Nitric acid was proven as an electrolyte of choice, which ensured the almost complete degradation of phenol under galvanostatic electrol-ysis conditions. Under these conditions, the detection of lead was then possible without any interference. The analytical performances were found to be in accordance with reference techniques and suitable for the analysis of industrial wastes. Studies are currently in progress to widen this proof-of-concept to other kinds of organic matter and trace metals.
Experimental Section
Nitric acid and sulfuric acid were of analytical grade (VWR). A standard solution of Lead of 1000 mgL@1 in 2 molL@1 nitric acid
Specpure was used (Alfa Aesar). Phenol and humic acid sodium salt purchased from Sigma-Aldrich were of analytical and technical grade, respectively. All chemicals were used as received.
Mineralization
Electrolyses were performed in a home-made, 5-mL single-compart-ment cell under galvanostatic conditions at 0.5 A for varying durations. Both anode and cathode were BDD plates of 2.25 cm2
geometrical surface area, the inter-electrode gap was 24 mm. TOC analysis was carried out by using a Shimadzu TOC-VSCN total organic carbon analyzer. Pb(II) concentration was measured using inductively coupled plasma – atomic emission spectroscopy (ICP-AES, HORIBA Ultima 2).
Electrochemical Detection
All the electroanalytical experiments were performed at room temperature using a Metrohm μ-Autolab III potentiostat interfaced to a personal computer and controlled with NOVA 1.11 software package. All solutions were prior mineralized without any deaera-tion. A classical three-electrode glass cell was used with a Metrohm platinum rod and a Radiometer Ag/AgCl/KCl(saturated) electrode connected to the cell by a capillary as counter and reference electrode, respectively. All the potentials are given with respect to this reference. Working electrode was a BDD electrode of 0.196 cm2
geometrical surface area.
DPASV experiments were performed in a 0.01 M HNO3 solution
using the following conditions: cleaning potential=1.2 V, cleaning time=150 s; preconcentration cathodic [email protected] V, precon-centration time=20 s; pulse amplitude=25 mV, step amplitude= 5 mV, pulse time=25 ms, scan rate of 25 mVs@1; anodic stripping
from @0.8 to @0.2 V. During the preconcentration step, the solution was stirred. All the measurements were repeated at least twice.
Conflict of Interest
The authors declare no conflict of interest.
Figure 3. DPASVs recorded in 0.01 M HNO3containing Pb(II) ranging from 0.5 to 10 ppm (BDD surface area= 0.196 cm2). Inset: corresponding calibra-tion curve. All measurements were repeated at least twice.
Table 1. Pb(II) concentrations obtained by ICP-AES and DPASV after OM mineralization.
Solutions [ppm] DPASV [ppm] ICP-AES [ppm]
5 5.27 4.9
Keywords: boron-doped diamond anode · electrochemical
detection · electrochemical mineralization · lead detection · trace metals
[1] E. Callender, Treatise on Geochemistry 2004, 9, 67–105.
[2] Q. Mahmood, A. Rashid, S. S. Ahmad, M. R. Azim, M. Bilal, Environ. Pollut. 2012, 21, 35–69.
[3] W. Maret, Met. Ions Life Sci. 2017, 17, 1–20.
[4] D. K. DeForest, K. V. Brix, W. J. Adams, Aquat. Toxicol. 2007, 84, 236–246. [5] P. C. Nagajyoti, K. D. Lee, T. V. M. Sreekanth, Environ. Chem. Lett. 2010, 8,
199–216.
[6] J. O. Nriagu, J. M. Pacyna, Nature 1988, 333, 134–139.
[7] L. Pujol, D. Evrard, K. Groenen-Serrano, M. Freyssinier, A. Ruffien-Cizsak, P. Gros, Front. Chem. 2014, 2, 19.
[8] C. Steelink, J. Chem. Educ. 1977, 54, 599–603.
[9] J. C. G. Sousa, A. R. Ribeiro, M. O. Barbosa, M. F. R. Pereira, A. M. T. Silva, J. Hazard. Mater. 2018, 344, 146–162.
[10] J. H. Reuter, E. M. Perdue, Geochim. Cosmochim. Acta 1977, 41, 325–334. [11] I. Sires, E. Brillas, Environ. Int. 2012, 40, 212–229.
[12] C. A. Martínez-Huitle, M. A. Rodrigo, I. Sirés, O. Scialdone, Chem. Rev. 2015, 115, 13362–13407.
[13] L. Pujol, A. Ruffien-Ciszak, M. Freyssinier, K. Serrano-Groenen, P. Gros, D. Evrard, Process of determination of metal compounds in solution. Fr. Demande (2017), FR 3038386 A1 20170106.
[14] A. J. Saterlay, C. Agra-Gutiérrez, M. P. Taylor, F. Marken, R. G. Compton, Electroanalysis 1999, 11, 1083–1088.
[15] P. Cañizares, J. Lobato, R. Paz, M. A. Rodrigo, C. Sáez, Water Res. 2005, 39, 2687–2703.
[16] E. Weiss, K. Groenen-Serrano, A. Savall, J. Appl. Electrochem. 2008, 38, 329–337.
[17] B. P. Chaplin, Environ. Sci. Process. Impact 2014, 16, 1182–1203. [18] L. Pinhedo, R. Pelegrini, R. Bertazzoli, A. J. Motheo, Appl. Catal. B-Environ.
2005, 57, 75–81.
[19] Y. Lan, C. Coetsier, C. Causserand, K. Groenen-Serrano, Electrochim. Acta 2017, 231, 309–318.
[20] K. Serrano, P. A. Michaud, C. Comninellis, A. Savall, Electrochim. Acta 2002, 48, 431–436.
[21] a) H. Lutze, Sulfate radical based oxidation in water treatment, Universität Duisburg-Essen, 2013; b) P. Neta, V. Madhavan, H. Zemel, R. W. Fessenden, J. Am. Chem. Soc. 1977, 99, 163–164; c) M. M. Ahmed, S. Barbati, P. Doumenq, S. Chiron, Chem. Eng. J. 2012, 197, 440–447. [22] Y. Deng, C. M. Ezyske, Water Res. 2011, 45, 6189–6194.
[23] D. Zhou, H. Zhang, L. Chen, J. Chem. Technol. Biotechnol. 2015, 90, 775– 779.