OATAO is an open access repository that collects the work of Toulouse
researchers and makes it freely available over the web where possible
Any correspondence concerning this service should be sent
to the repository administrator:
tech-oatao@listes-diff.inp-toulouse.fr
This is an author’s version published in:
http://oatao.univ-toulouse.fr/27279
To cite this version:
Min, Yuanyuan
and Leng, Faqiang
and Machado, Bruno F. and Lecante,
Pierre and Roblin, Pierre
and Martinez, Hervé and Theussl, Thomas and
Casu, Alberto and Falqui, Andrea and Barcenilla, María and Coco, Silverio and
Martínez, Beatriz María Illescas and Martin, Nazario and Axet Marti, Maria
Rosa
and Serp, Philippe
2D and 3D Ruthenium Nanoparticle Covalent
Assemblies for Phenyl Acetylene Hydrogenation. (2020) European Journal of
Inorganic Chemistry, 2020 (43). 4069-4082. ISSN 1434-1948
Official URL: https://doi.org/10.1002/ejic.202000698
2D and 3D Ruthenium Nanoparticle Covalent Assemblies for
Phenyl Acetylene Hydrogenation
Yuanyuan Min,
[a]Faqiang Leng,
[a]Bruno F. Machado,
[b]Pierre Lecante,
[c]Pierre. Roblin,
[d]Hervé Martinez,
[e]Thomas Theussl,
[f ]Alberto Casu,
[g]Andrea Falqui,
[g]María Barcenilla,
[h]Silverio Coco,
[h]Beatriz María Illescas Martínez,
[i,j]Nazario Martin,
[i,j]M. Rosa Axet,*
[a]and
Philippe Serp*
[a]Abstract: The bottom-up covalent assembly of metallic
nanopar-ticles (NP) represents one of the innovative tools in nanotechnol-ogy to build functional heterostructures, with the resulting assemblies showing superior collective properties over the indi-vidual NP for a broad range of applications. The ability to control the dimensionality of the assembly is one of the major challen-ges in designing and understanding these advanced materials. Here, two new organic linkers were used as building blocks in order to guide the organization of Ru NP into two- or three-dimensional covalent assemblies. The use of a hexa-adduct
func-1. Introduction
Catalysts are essential in the majority of industrial chemical transformation processes, and the optimization of catalyst per-formances is a sine qua non condition for a sustainable
indus-[a] Dr. Y. Min, Dr. F. Leng, Dr. M. Rosa Axet, Prof. Dr. P. Serp CNRS, LCC (Laboratoire de Chimie de Coordination), INPT, 205 route de Narbonne, 31077 Toulouse Cedex 4, France E-mail: rosa.axet@lcc-toulouse.fr, philippe.serp@ensiacet.fr https://www.lcc-toulouse.fr/article447.html?lang=fr Twitter: Laboratoire de chimie de coordination @LCC_CNRS
[b] Dr. B. F. Machado
LSRE-LCM, Chemical Engineering Department, Faculty of Engineering, University of Porto, Rua Dr. Roberto Frias s/n, 4200-465 Porto, Portugal
[c] Dr. P. Lecante
Centre d'élaboration des matériaux et d'études structurales UPR CNRS 8011, 29 Rue Jeanne-Marvig, BP 4347, 31055 Toulouse, France
[d] Dr. P. Roblin
Laboratoire de Génie Chimique and Fédération de Recherche FERMAT, 4 allée Emile Monso, 31030 Toulouse, France
[e] Prof. Dr. H. Martinez
Université de Pau et des Pays de l'Adour, 64053 Pau, France
[f] Dr. T. Theussl
King Abdullah University of Science and Technology (KAUST), Visualization Core Lab, 23955-6900 Thuwal, Saudi Arabia
[g] Dr. A. Casu, Dr. A. Falqui
King Abdullah University of Science and Technology (KAUST), Biological and Environmental Sciences and Engineering (BESE) Division, NABLA Lab, 23955-6900 Thuwal, Saudi Arabia
[h] Dr. M. Barcenilla, Prof. Dr. S. Coco
IU CINQUIMA/Química Inorgánica, Facultad de Ciencias, Universidad de Valladolid, 47071 Valladolid, Spain
[i] Prof. Dr. B. M. I. Martínez, Prof. Dr. N. Martin
Departamento Química Orgánica, Facultad C. C. Químicas, Universidad Complutense de Madrid, Av. Complutense s/n, 28040 Madrid, Spain
[j] Prof. Dr. B. M. I. Martínez, Prof. Dr. N. Martin
IMDEA-Nanociencia, C/Faraday 9, Ciudad Universitaria de Cantoblanco, 28049 Madrid, Spain Supporting information and ORCID(s) from the author(s) for this article are available on the WWW under https://doi.org/10.1002/ejic.202000698.
Part of the Supported Catalysts Special Collection.
tionalized C60leads to the formation of 3D networks of 2.2 nm
Ru NP presenting an interparticle distance of 3.0 nm, and the use of a planar carboxylic acid triphenylene derivative allows the synthesis of 2D networks of 1.9 nm Ru NP with an interparticle distance of 3.1 nm. The Ru NP networks were found to be active catalysts for the selective hydrogenation of phenylacetylene, reaching good selectivity toward styrene. Overall, we demon-strated that catalyst performances are significantly affected by the dimensionality (2D vs. 3D) of the heterostructures, which can be rationalize based on confinement effects.
trial development. In nature, the chemical transformation proc-esses often occur in molecularly crowded and/or confined envi-ronment with well-designed limited spaces such as nanometric-sized enzymes.[1]With the development of nanosciences and
nanotechnology, various nanoreactors, both organic or inor-ganic,[2]have been designed for catalytic applications;[3]
provid-ing constrained spaces isolated from the surroundprovid-ing environ-ment. In heterogeneous catalysis, confinement effects (CE) can greatly influence catalytic performances.[4]The CE can be either
physical or chemical, and are induced by the reduction of the dimensions of the spaces in which a chemical reaction takes places. The physical effects can lead to shape-selectivity,[5]
im-pact the nanofluidics and mass transport,[6]phase separation,
Scheme 1. Representation of different nanoreactors with a confined metallic nanoparticle and a reactant molecule (here phenyl acetylene): a) a metallic cluster confined in a zeolite cage; b) metallic clusters confined in a carbon nanotube; c) metallic clusters covered by a graphene overlayer; and d) cova-lent network of metallic clusters where the black lines represent the organic linkers.
phase equilibria[7]and transformation,[8]or to significant
pres-sure enhancement.[9]The chemical effects are related to
modifi-cations of the electronic interactions between the catalytic phase and the surrounding material, which alter the adsorption energetics, influencing the formation and breaking of chemical bonds. All these effects can directly contribute to enhancement of activity/selectivity and catalyst stabilization. CE have been studied in 0D nanoreactors such as zeolites[10](Scheme 1a) or
MOF,[11] 1D nanoreactors such as carbon nanotubes
(Scheme 1b)[12] or covalent organic frameworks,[13]and more
recently, under the layers of 2D materials such as graphene (Scheme 1c).[14]In all these systems the active phase, often a
transition metal nanoparticle (NP), is confined in a cavity com-posed of a second material. Another type of material that could offer interesting perspectives to study CE consists in covalent assemblies of metallic NP (Scheme 1d).[15]In these structures,
the organic linker (or ligand) plays a fundamental role on con-structing the NP network and defining NP chemical environ-ment.[16]In that case, the reactant environment is significantly
different since it is composed of an important number of cata-lytically active NP covalently linked by an organic molecule. The interparticle coupling effect has been demonstrated to signifi-cantly influence the optical properties of NP,[17]and is also able
to affect their catalytic properties.[18]
Although the covalent assembly of well-defined metal NP could permit to direct substrates, or to create confined spaces in order to produce better catalysts by means of CE, most of the studies dealing with this type of material concentrated on applications for biomedicine electronics or optics,[19]and they
are up to now only a limited number of studies dedicated to
Scheme 2. Carboxylic acid linkers for Ru NP: TPhC, TPhTC and HF.
their use in catalysis.[15a,15b,20] Some studies have already
evi-denced that NP covalent assembly show better catalytic per-formances, and in some cases higher stability than isolated NP.[20,21] Another interesting aspect of these assemblies is the
possibility of controlling the interparticle distance via the molecular chemical nature and chain length of the ligand,[15a,22]
and possibly the CE. We have recently demonstrated in the case of 3D Ru NP networks linked with polymantane ligands that it was possible to: i) obtain NP with similar size (1.6–1.8 nm) for a given metal loading whatever the nature of the ligand (diacid or diamine); ii) control the electronic effects by means of the chemical nature of the ligand (acid vs. amine); and iii) control the interparticle distance via the size of the ligand.[15a]We also
demonstrated that catalyst activity and selectivity in phenyl-acetylene hydrogenation are both significantly affected by Ru NP interparticle distance and therefore by CE.
In continuation of our ongoing research in the development of Ru NP covalent assemblies for catalysis,[15a,15b] the present
work aims at producing 2D and 3D Ru NP networks via a ra-tional choice of new organic linkers, and to study their catalytic performances for phenylacetylene hydrogenation. Elucidation of confinement of Ru NP and architecture of the network (2D vs. 3D) on catalyst activity/selectivity is also one of the objec-tives of the present study.
2. Results and Discussion
In previous works by some of us, 3D Ru NP covalent assemblies with homogeneous interparticle distances have been produced
using spacer molecules such as a multi-adduct fullerene
(C66(COOH)12)[15b]or di-topic polymantane derivatives.[15a]The distance between the NP is controlled in accordance to the different size of the ligands. Herein, the hexa-adduct functional-ized C60(HF) ligand (Scheme 2) has been synthesized and
em-ployed as tethering ligand for Ru NP in order to investigate the effect of the size of the ligand in opposition to the previously investigated multi-topic C66(COOH)12.[15b]Indeed, the interme-diary long chains present in HF should contribute to increase the interparticle distance. Further, we hypothesized that the use of planar ligands could produce 2D assemblies. Hereof, carb-oxylic acid triphenylene derivatives depicted in Scheme 2 have been used as NP stabilizers. Both compounds, 2(6-(4-(carb- oxy)phenoxy)hexyloxy)-3,6,7,10,11-pentakis(hexyloxy)triphenyl-ene (TPhC) and 2,6,10-tris(6-(4-(carboxy)phenoxy)hexyloxy)-3,7,11-trihexyloxytriphenylene (TPhTC) display the planar tri-phenylene backbone, and one or three alkyl chains containing each one the carboxylic acid moiety. The molecules possessing substituted triphenylene backbone constitute a classical series of discotic liquid crystal molecules.[23]However, the mono
carb-oxylic acid TPhC melts directly to an isotropic liquid and it is not mesomorphic (Figure S1 of SI). In contrast, the tricarboxylic acid derivative TPhTC shows an enantiotropic nematic meso-phase (N) (from 55 to 113 °C) followed, on cooling, by a glass transition, which is maintained in the second heating (Figure S1 of SI). The nematic mesophase (N) was identified in optical microscopy by its typical Schlieren texture (Figure S2 of SI). We did not use TPhTC in the mesomorphic state, but the different thermal behavior of TPhC and TPhTC reveals their different self-assembly capacity. The extended aromatic sp2basal plane and
the six substituents with three carboxylic ending groups at the periphery position of the polyaromatic core could lead to ex-tended and stable self-assemblies.[24] It has already been
re-ported that thanks to the aromatic sp2basal plane, similar
tri-phenylene hexa-substituted derivatives afforded 2D metal-organic frameworks, which provided significant activity for O2
electroreduction.[25]Triphenylene liquid crystals have been also
studied as materials for surface modification,[26]as stabilizers of
nanoparticles[27]and even as template of inorganic
mesostruc-tures.[28]To the best of our knowledge, this is the first time that
the ligands depicted in Scheme 2 are used for surface stabiliza-tion in NP synthesis.
2.1 Synthesis and Characterization of 2D Ru NP Assemblies
Ru NP were synthesized in THF by decomposition of [Ru-(η4-C
8H12)(η6-C8H10)] under 3 bar of H2at room temperature in
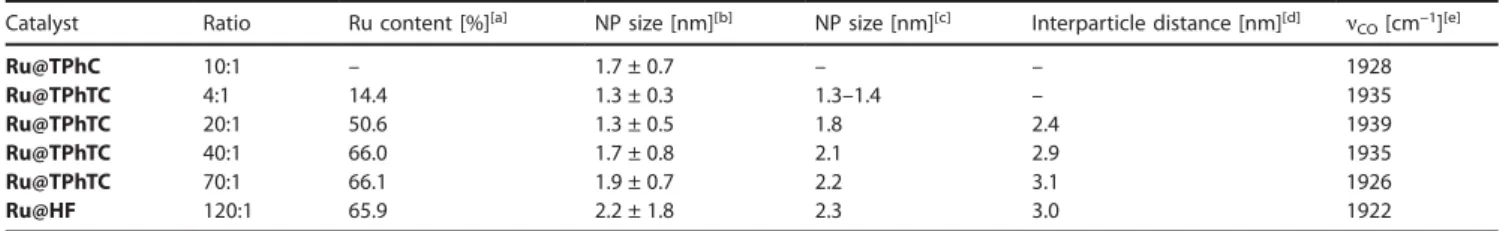
Table 1. Mean size distributions, interparticle distances, ruthenium content, CO infrared frequency band of the Ru NP and Ru NP networks. Catalyst Ratio Ru content [%][a] NP size [nm][b] NP size [nm][c] Interparticle distance [nm][d] ν
CO[cm–1][e] Ru@TPhC 10:1 – 1.7 ± 0.7 – – 1928 Ru@TPhTC 4:1 14.4 1.3 ± 0.3 1.3–1.4 – 1935 Ru@TPhTC 20:1 50.6 1.3 ± 0.5 1.8 2.4 1939 Ru@TPhTC 40:1 66.0 1.7 ± 0.8 2.1 2.9 1935 Ru@TPhTC 70:1 66.1 1.9 ± 0.7 2.2 3.1 1926 Ru@HF 120:1 65.9 2.2 ± 1.8 2.3 3.0 1922
[a] By ICP. [b] By TEM. [c] By WAXS. [d] From SAXS. [e] By ATR-IR.
the presence of TPhC or TPhTC by using the reaction condi-tions detailed in the experimental section. TEM images of the as-synthesized Ru NP are presented in Figure 1. The use of the monodentate ligand TPhC leads to the formation of isolated NP with mean size of 1.7 ± 0.7 nm (Figure 1a and Figure S3a). Differently, the use of the multi-topic compound TPhTC, what-ever the Ru/TPhTC ratio used, leads to the production of assem-blies of Ru NP presenting mean diameter below 2 nm (Fig-ure 1b–e). The size of these NP slightly increased with the Ru content. These data are summarized in Table 1 and size histo-grams are given in Figure S3 of the SI.
Figure 1. a) Ru@TPhC with a Ru/L ratio of 10:1; and Ru@TPhTC with Ru/L ratio of b) 4:1; c) 20:1; d) 40:1; e) 70:1 and f) Ru@AdDC with Ru/L ratio of 10:1.[15a](Scale bar = 50 nm).
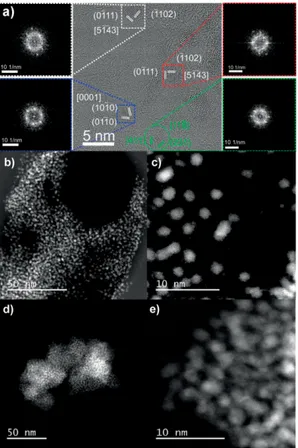
HRTEM and HAADF-STEM analyses were also performed on several samples (Figure 2) with different Ru/L ratio. Structural analysis performed on the HRTEM images of the rare NP found not aggregated, indicated that interplanar distances and angu-lar relationships measured by 2D Fast Fourier Transform (2D-FFT) analysis are consistent with single Ru crystalline domains mostly showing the Ru hexagonal structure and quite seldom the Mn-β cubic one.[29]The evidence of this is provided by the
HRTEM images displayed in Figure 2a, and it becomes apparent when observing the 2D-FFT patterns calculated on the Regions Of Interest (ROI) corresponding to distinct crystalline domains. One single crystal domain per particle can be clearly observed. In the case of Ru NP, at times the close proximity of single crystalline seeds could appear as a sort of an elongated particle composed by different crystalline domains (see the right-hand side of Figure 2a). However, both the presence of small disconti-nuities in these groups of close NP, and the different arrange-ments observed for the atomic columns in different parts of them, together with the different lattice spacing and zone axes detected, concur to indicate that the structures apparently
ap-pearing as an elongated seed are just constituted by different NP in close vicinity. Some further consideration is deserved by the detection of a sole particle displaying Mn-β cubic structure (Figure 2a). It is known that the HRTEM could provide with local structural analysis of the particles it images, but, in case of con-comitant presence of different crystal phases, such technique is not capable to quantitatively determine which among the phase is majority. This is due not only to the fact that HRTEM generally investigates the crystal structure of a very limited number of particles, but also that some phases may be less detectable than others. Indeed, this is the case of Ru NP with Mn-β cubic structure, of which the contrast is lower than the one of the NP showing their expected hexagonal structure. Such an effect combines with the NP very low size (about 1.5 nm), which further contributes to make their structure less clear. Thus, the HRTEM imaging is just indicating that the Ru NP contained in the sample with Ru/L ratio of 6:1 show both the hexagonal and the Mn-β cubic crystal structure.
Figure 2. a) and b) HRTEM images of Ru@TPhTC with a Ru/L ratio of 6:1 - structural analysis was performed on the single crystalline seeds: the lattice spacings and zone axes are indicated in the HRTEM panels along with the ROIs used to calculate the 2D-FFT patterns (reported in both right and left panels). The Ru NP showing both the expected hexagonal and cubic Mn-β structure are enclosed by square- and round-shaped frames, respectively. b)-e) HAADF-STEM images of: b) and c) Ru@TPhTC with a Ru/L ratio of 20:1; and d) and e) Ru@TPhTC with a Ru/L ratio of 40:1.
At a Ru/L ratio of 20:1, small quantities of clusters and even Ru isolated atoms are shown around the NP in assemblies (Fig-ure 2b and c). The Ru NP assemblies produced with a Ru/L ratio of 40:1 only display NP with Ru hcp crystalline structure
excluding Ru single atoms (Figure 2d and e), in agreement with the WAXS analyses (Figure S4 of the SI). The WAXS analyses revealed well-crystallized Ru NP in the hcp structure for samples with a Ru/ligand ratio > 4. With the exception of Ru@TPhTC with a Ru/L ratio of 4:1, which shows a very distorted structure, all samples are consistent with metallic Ru NP in the hcp struc-ture (Figure S4, top). This is confirmed in the RDF (Figure S4, bottom) where similar patterns are observed. From the coher-ence length, the size of the crystallites can be estimated to 2.2 nm for Ru@TPhTC - 70:1, 2.1 nm for Ru@TPhTC - 40:1, 1.9 nm for Ru@TPhTC 20:1 and only 1.3 nm for Ru@TPhTC -4:1. The Ru@TPhTC - 4:1 sample lacks characteristics from the
hcp structure and can be described as crystallized in the
meta-stable β-Mn structure,[29]as often observed for these very small
sizes.[30]This is likely the effect of the high ligand/metal ratio
that contributes to quench Ru NP growth right after the nuclea-tion step.
Additionally, it is worth noting that the low contrast ob-served on the TEM micrographs would suggest that the assem-blies obtained are relatively thin in comparison to the ones obtained with non-planar ligands such as polymantanes (both adamantane and diamantane) dicarboxylic (Figure S3g and h).[15a] This result suggests that the synthesis of 2D covalent
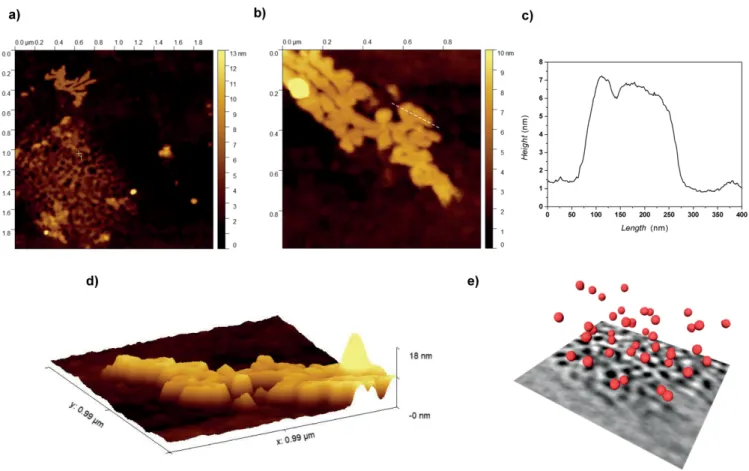
assembly of Ru NP is possible via the use of ligands containing the planar triphenylene backbone. In order to corroborate the two-dimensional nature of these assemblies, further characteri-zations have been performed on these materials, including electron tomography and atomic force microscopy (AFM). AFM is commonly used to determine the thickness of 2D materi-als.[31]As shown in Figure 3a, the material Ru@TPhTC
synthe-sized using a Ru/L ratio of 40:1 spreads evenly on the surface of the wafer. Due to the difference in height and substrate of the area covered by the material, the morphology and height information of the sample can be clearly observed. The objects have a measured thickness ranging from 3 to 12 nm (Figure 3b, c and Figure S5 of the SI). Considering that the size of the Ru NP is around 2 nm and taking into account the size of the ligand estimated from small angle X-ray scattering (SAXS) analy-ses (approximately 1 nm, see below), the thickness of the as-sembly corresponds to one to four layers of metal NP. Besides, the lateral size of the objects ranges from 0.1 to 1 μm, present-ing a high aspect ratio, thereby confirmpresent-ing their 2D layered structure.
The 3D reconstruction obtained via electron tomography (see Figure 3e) confirms that the sample Ru@TPhTC – 40:1 is constituted by small NP with spherical shape. Besides, the 3D reconstruction of a large NP assembly (see Figure S6) allowed to study the interparticle distance for different positions and heights in the same quite large assembly of them. With this aim, the NP mutual distances in the assembly have been sampled in three diverse positions on the x-y plane, and at three diverse height from the bottom, which is basically represented by the TEM carbon grid where the particles were deposited. The three histograms reported in Figure S6 clearly show that the interpar-ticle distance in different parts (i.e., volumes corresponding to the three colored boxes) of the large NP assembly is about the same, and equal to a mean value of 2.4 ± 1.2 nm.
Figure 3. a) and b) AFM height images of Ru@TPhTC using 40:1 Ru/L ratio with c) height profile along the white dotted line; d) 3D rendering of the assembly; and e) 3D reconstruction of Ru@TPhTC – 40:1 via electron tomography, where just some particles are imaged to provide a direct evidence of their spherical shape.
SAXS analyses were also performed to reveal the arrange-ment of Ru NP inside the assembly and the appearance of the assembly of NP. A Kratky plot (q2I(q) vs. q) was employed to highlight the different broad peaks of the X-ray scattering curves (Figure 4). The SAXS data can be described as the scat-tering from a multiscale organization of Ru NP assembly with a sum of three contributions:
I(q)global = I(q)surface + I(q)corr + I(q)sphere * S(q)
To describe the region at low angles, we use a first term
I(q)surface that follows a power law function. The value of the exponent reflects the roughness of the surface of the NP assembly. All SAXS curves present at intermediate angles (0.01– 0.03Å–1) a broad peak reflecting the presence of a correlation
distance and can be described by the second term I(q)corrbased on adjustable Lorentzian function. The high angles contain structural information on elementary Ru NP such as NP mean diameter and mean interparticle distance, and can be modelled with an equation of sphere I(q)spheremultiplied by a structural factor S(q). All data were fitted with the model described above and the adjustable parameters are summarized in Table S1. The first parameter corresponding to exponent of power law func-tion (P) is close to 4 for Ru@TPhTC 20:1 (4) and Ru@TPhTC 70:1 (3.8) samples, corresponding to a well-define and smooth interface. For Ru@TPhTC 40:1, this value decreases at 3.2 corre-sponding to a rougher surface such as for the surface of fractal objects.[32] The correlation length observed at intermediates
angles (ξ = 5–11 nm) could correspond to the thickness of the
Figure 4. SAXS patterns of Ru NP assemblies produced with the TPhTC ligand (red curve, Ru@TPhTC - 20:1, yellow curve, Ru@TPhTC - 40:1, and green curve, Ru@TPhTC - 70:1). The experimental SAXS curves are plotted in log I(q)q2fct log q representation in black line and the fitting curves
corre-sponding to the calculated SAXS curves from the model are plotted in dashed line.
layers. The measured values are consistent with those obtained by AFM. The radius of the elementary Ru NP (R) increases slightly with the proportion of ligand, giving a sphere radius comprised between 0.75 and 1.2 nm consistent with EM
obser-vations (0.65–0.95 nm). The peaks at high angle (> 0.1Å–1)
rep-resent the average distance between NP detected at 0.18, 0.20 and 0.22 Å–1for Ru@TPhTC samples 70:1, 40:1 and 20:1.
The correlation distances were calculated displaying the aver-age of interparticle distances (Reff) at 3.1, 2.9 and 2.4 nm, for
samples 70:1, 40:1 and 20:1, respectively. As the length of the ligand is the same for all Ru NP series this variation on the distance is caused by the different Ru NP mean size diameter (1.9 ± 0.7, 1.7 ± 0.8, and 1.3 ± 0.5 nm, for Ru@TPhTC - 70:1, 40:1 and 20:1, respectively), which fits well with a distance of about 1 nm for all cases due to the presence of the ligand (Table 1). The mean interparticle distance determined by ET for
Ru@TPhTC samples 40:1 (2.4 ± 1.2 nm) is in reasonable
agree-ment with the SAXS analysis (2.9 nm).
Finally, the thermal stability of the Ru@TPhTC - 40:1 was evaluated by TPD/MS (Figure S7). Decarboxylation occurs at 190 °C, as ascertained by the detection of CO2. As the
tempera-ture increases, decarbonylation (CO desorption) and decarbox-ylation (CO2desorption) is detected at around 300–400 °C. As
comparison, the TPhTC ligand decomposed in the temperature range of 420–440 °C, which indicates the decomposition is facil-itated by Ru NP.
2.2 Synthesis and Characterization of 3D Ru NP Assemblies
Likewise, Ru NP assembled with the HF ligand were synthesized straightforwardly from [Ru(η4-C
8H12)(η6-C8H10)] under 3 bar of
H2at room temperature using a Ru/ligand ratio of 120:1, which
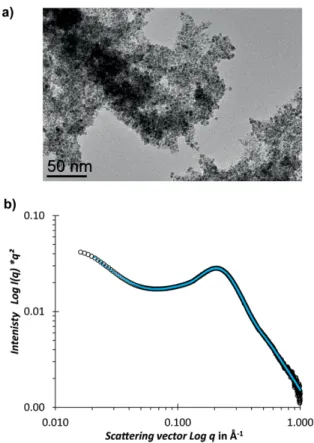
Figure 5. a) TEM image and b) SAXS pattern of Ru@HF produced using a Ru/ligand ratio of 120:1.
corresponds to a Ru/functional group ratio of 10:1. The HF li-gand was prepared for the first time in this work, and its synthe-sis consynthe-sists in a two-step procedure. First, a malonate derivative containing two alkyne groups reacts through a Bingel-Hirsch reaction with the fullerene C60, followed by an alkyne-azide
1,3-dipolar cycloaddition to give HF compound in low yield (see details in experimental section). The formation of a 3D assembly of Ru NP was first confirmed by TEM analyses (Figure 5a); the size of the NP is 2.2 ± 1.8 nm. WAXS analyses confirmed that the Ru NP are well-crystallised in the hcp structure with a mean particle size of 2.3 nm (Figure S8). SAXS analyses of the Ru@HF sample (Figure 5b) revealed an interparticle distance of 3.0 nm. In that case, the peak is very broad, which was attributted to the broad Ru particle size distribution (Figure S3f ). Compar-ing to the Ru NP assemblies described in a previous work by using the hexa-substituted fullerene C60, Ru@C66(COOH)12 linker,[15b]the interparticle size is larger with HF, since the
inter-particle distance for Ru@C66(COOH)12 was 2.8 nm, with a Ru NP size of 1.5 ± 0.8 nm. Thus and as expected, the presence of the intermediary long chains present in HF allows increasing the interparticle distance.
2.3 Surface Coordination Chemistry
The coordination of the stabilizing ligand onto the Ru NP sur-face has been investigated by means of spectroscopic tech-niques, including IR, solid state NMR using magic angle spin-ning (MAS NMR), and X-ray photoelectron spectroscopy (XPS). It has been previously demonstrated by some of us[15a,15b,33]
and others,[34]that carboxylic acid groups coordinate to the Ru
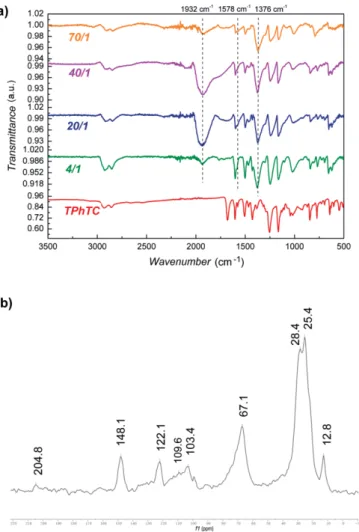
NP surface after losing their proton, giving rise to carboxylate species together with surface hydrides. The carboxylate surface species can be easily detected using IR spectroscopy; thus, the IR spectra of the Ru@TPhTC samples produced at different Ru/ligand ratio have been recorded and analyzed (Figure 6a). The characteristic peak due to the C=O stretching of the carb-oxylic acid groups of the ligand at 1680 cm–1(Figure 6a,
bot-tom), vanishes in Ru@TPhTC samples, generating a new set of peaks appearing at around 1578 and 1376 cm–1, assigned,
respectively, to the antisymmetric (νas(COO–)) and symmetric
(νs(COO–)) stretching vibrations of the carboxylate group. The
difference between νas(COO–) and νs(COO–) (Δν) in the IR
spec-tra is generally used to determine the coordination mode of
the carboxylate group.[35] For Ru@TPhTC samples, a Δν of
about 202 cm–1was measured, which is attributed to a bridging
bidentate mode; in line with our previous results.[15a] Other
characteristic peaks of the ligand, such as the intense peaks at 1251 and 1164 cm–1corresponding to the ether bonds, or the
peaks assigned to the triphenylene aromatic backbone, which appear in the range of 1500–1600 cm–1, are observed in all
spectra, pointing out that the ligand is stable under the syn-thetic conditions. An intense band at 1932 cm–1was also
ob-served in all Ru samples, which indicates adsorbed CO on the Ru NP surface; probably resulting from the decarbonylation of the carboxylic acid and decomposition of the solvent of the reaction, THF, as experimentally and theoretically demonstrated elsewhere.[15a]In the case of the sample Ru@TPhTC with Ru/L
ratio of 70:1, the intensity of this band is weak, presumably because of a prolonged outgassing of this sample before analy-sis, which favors CO desorption.[15a]
Figure 6. a) ATR-IR spectra of TPhTC and Ru@TPhTC with Ru/L ratio from 4:1 to 70:1 (from bottom to top); and b)1H-13C CP MAS SS-NMR spectrum of Ru@TPhTC with a Ru/L ratio of 40:1.
MAS NMR with and without 1H-13C cross polarization (CP)
were recorded for Ru@TPhTC - 40:1 sample, and the1H-13C CP
MAS SS-NMR spectrum is depicted in Figure 6b (13C NMR of the
free ligand is shown on Figure S9). Peaks at 12.8, 25.4, 28.4 ppm are attributed to the carbons of the alkyl chain, which link the triphenylene core to the carboxylic acid moieties. The broad peak centered at 67.1 ppm corresponds to the saturated carbons of the ether bonds besides the aromatic ring. The aro-matic carbons appear in the range of 103.4 to 148.1 ppm. Al-though hydrogenation of triphenylene with Ru NP have been reported at 30–80 °C and 20 bar H2,[36]we did not find traces of
hydrogenation of the triphenylene core under our conditions. XPS of Ru@TPhTC - 40:1 (Figure S10, Table S2) reveals the presence of metallic Ru through the presence of two doublet peaks of Ru 3d at 279.9 and 284.1 eV, and Ru 3p at 461.5 and 483.7 eV.[37]The C 1s peak was deconvoluted into three
contri-butions at 285.0 (C-C and C-H bonds), 286.4 (C-O bonds from ether bonds), and 288.1 eV (O=C-O bonds). Two peaks at 530.8 and 532.3 eV of O 1s are in agreement with a carbonyl group and a weak peak at 529.5 eV with a Ru–O bond, suggesting
that the Ru is coordinated to the ligand through oxygen atoms as observed before for Ru-carboxylate nanostructures.[15b]
Concerning Ru@HF, infrared analysis show that, upon coordi-nation of the HF ligand on the Ru NP surface, two new bands appear at 1580 and 1395 cm–1, (Figure S11a) together with the
disappearance of the signals at 1720 cm–1 (C=O stretching),
when compared to the free HF ligand, corresponding to carb-oxylate species coordinating to the Ru surface through a
bridg-ing bidentate mode (Δν = 185 cm–1). Adsorbed CO species
were also detected with a band at 1922 cm–1. The other bands
due to the ligand remained unchanged, which was attributed to the stability of the ligand under synthetic conditions. The triazole unit is identified by a band at 1551 cm–1 due to the
N=N bond,[38] and 1440 cm–1 due to N-C stretching.[39] The
band at 1731 cm–1is due to the six carboxylate groups of the
malonate cycloadduct. The13C SS-NMR spectrum (Figure S11b)
shows the presence of the ligand in the heterostructure. Char-acteristic peaks of the 1,2,3- triazole unit (120.1 and 63.4 ppm), the fullerene cage (141.4 and 66.2 ppm), quaternary carbon of the cyclopropane (50.0 ppm) and the carbon atoms of the alkyl chains (25.2 ppm) were detected in the spectrum.
These characterizations point for a similar stabilization of the Ru NP in the 2D and 3D assemblies, which involves the coordi-nation of the TPhTC and HF ligands through the carboxylate bridging bidentate mode.
2.4 Hydrogenation of Phenylacetylene
Semi hydrogenation of phenylacetylene is an useful process to purify styrene produced for polymerization.[40]From an
environ-mental point of view and cost, it has been shown that ruth-enium is a greener heterogeneous catalyst compared to other noble metals.[41]Surprisingly, even if colloidal Ru NP are usually
highly efficient (selective) hydrogenation catalysts,[42] reports
on the application of Ru NP for this specific catalytic reduction are relatively scarce.[16a,43]We recently evidenced that for 3D Ru
NP assemblies produced from polymantane ligands, the Ru NP interparticle distance (steric effect) and electronic effects con-trol the catalyst activity and selectivity.[15a]Increase of activity
was evidenced for electron rich Ru NP and/or for short interpar-ticle distances. Oppositely, an increase of selectivity towards styrene was observed on electro-deficient Ru NP and/or for long interparticle distances.
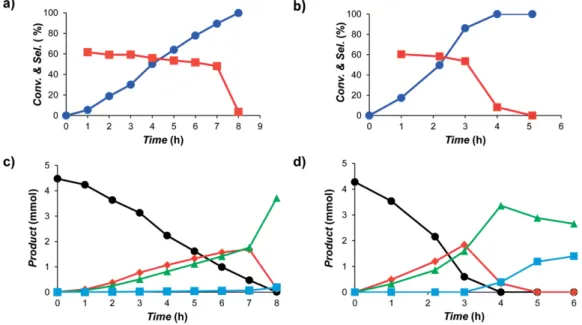
In this context, the 2D and 3D assemblies here prepared were used as catalysts in the semi-hydrogenation of phenyl-acetylene to styrene under mild conditions, i.e. room tempera-ture and a constant H2pressure of 5 bar. The results are listed
in Table 2. Time-conversion/selectivity curves are presented on Figure 7.
We analyzed the results obtained here in terms of steric and electronic effects, which are correlated to interparticle distance and νCOof the CO adsorbed onto the Ru NP surface,
respec-tively. The νCOfrequency, which is a probe for the electronic
effect of the ligands onto the Ru NP surface,[42]is different for
the two samples, being (in cm–1): 1922 (Ru@HF) and 1935
(Ru@TPhTC); indicating a higher electronic density on the Ru NP in the Ru@HF sample. When the electron density at the NP
Table 2. Hydrogenation of phenylacetylene using Ru catalyst.[a]
Entry Catalyst Time [h] Conv. [%] S20 %[%] S60 %[%] TOF [h–1][b] TOFs[h–1][c]
1 Ru@TPhTC - 40:1 5 64.0 57.5 53.5 46.5 15.6
2 Ru@HF - 120:1 3 86.1 59.5 51.2 134.3 70.2
3 1.6 %Ru/O-CNT[15a] 8 10.6 67.8[d] – 3.8 5.8[e]
[a] Reaction conditions: 0.02 mmol of Ru, 412 mg (4.00 mmol) of phenylacetylene, 71 mg (0.50 mmol) of decane (internal standard), room temperature, 5 bar H2, 25 mL of MeOH. [b] TOF in molPAconvertedmolRu–1h–1calculated according to surface Ru content at the time given in column reporting the reaction time.
[c] TOF calculated according to surface Ru content at 1 h. [d] Selectivity calculated at 10 % conversion. [e] TOF calculated according to surface Ru content at 8 h and Ru dispersion calculated as described in ref.[44].
Figure 7. Evolution of conversion (blue lines) and selectivity toward styrene (red lines) over time for the investigated catalysts: a) Ru@TPhTC - 40:1 and b) Ru@HF - 120:1; product distribution over time for: c) Ru@TPhTC - 40:1; and d) Ru@HF - 120:1. (Black circle phenylacetylene, red diamond styrene, green triangle ethylbenzene, and blue square ethylcyclohexane).
surface increases, favoring thus the π back-donation from the
d Ru orbitals to the antibonding π* orbital of the alkyne/alkene,
we can expect a facilitated hydrogenation. Conversely, if the charge transfer from the metal to the ligand results in elec-trodeficient Ru NP providing less π back-donation to the alkene, a weakened Ru–alkene bonding is obtained, which favors its quick desorption, and avoids overhydrogenation to produce ethylbenzene. From the results obtained we could thus ex-pected that the Ru@HF catalyst will be more active, but less selective than Ru@TPhTC.
Both catalysts were active for this hydrogenation reaction displaying turnover frequencies (TOF) of 46.5 h–1for Ru@TPhTC
and 134.3 h–1for Ru@HF. The selectivity towards styrene is
simi-lar for both catalysts and relatively high (50–60 %) and constant over time, up to 90 % conversion. In this conversion range, the main products of reaction are styrene and ethyl benzene for both catalysts. Above 90 % conversion the selectivity abruptly decreases due to the formation of ethylbenzene and then ethyl-cyclohexane (Figure 7). The total hydrogenation of
phenylacet-ylene under relatively mild reaction conditions using sup-ported[43a]or colloidal[43c]Ru NP as catalysts has already been
reported and is not surprising, even at room temperature.
Ru@HF - 120:1 displayed the highest activity, which correlated
well with the fact that the Ru NP in Ru@HF display the highest electron density. The fact that both catalysts present a similar selectivity cannot be correlated to this electronic effect.
As far as steric effects are concerned, it is thus worth noting that from SAXS data these two catalysts present a similar inter-particle distance. However, we can postulate that considering the molecular structure of the HF ligand (Scheme 2) a more sterically crowded environment should exist around the Ru NP in the 3D Ru@HF architecture than in the 2D Ru@TPhTC one. If this is the case, the higher TOF obtained with Ru@HF would be in phase with a CE, as previously reported.[15a] However,
there also the selectivity towards styrene should be lower for the Ru@HF catalyst in comparison with Ru@TPhTC.
A general tendency generally observed for ligand protected NP catalysis is that the cleaner the metal surface, the higher
the activity and the lower the selectivity.[45]In this sense, if we
consider the Ru/L molar ratio calculated from elemental and ICP analyses, it is around 73 and 22.5 for the Ru@HF and
Ru@TPhTC catalysts, respectively. If we take into account the
Ru NP size, this roughly corresponds to -COOH/Rusurf ratio of
0.35 and 0.23 for the Ru@HF and Ru@TPhTC catalysts, respec-tively (see experimental section for calculations). The lower ratio obtained with the TPhTC ligand (cleaner metal surface) should contribute to an increased activity and a decreased the selecti-vity, which is not the observed tendency. Thus, as none of the classical ligand effects observed in selective hydrogenation can satisfactorily explain the performances obtained in terms of both activity and selectivity, we tentatively attributed the spe-cific behavior of the Ru@TPhTC catalyst (lower activity and sim-ilar selectivity than Ru@HF) to the different spatial ordering of the sample, 2D, in contrast to the 3D networks displayed for
Ru@HF. In the 2D assembly, the ratio between
confined/uncon-fined Ru NP should be much smaller than for the 3D assemblies. These less marked effects of confinement, combined with the electronic effects brought about by the ligands must be at the origin of the lower performances obtained with the Ru@TPhTC catalyst.
To better delineate the performances of the Ru NP networks prepared from the functionalized ligands we compared their reactivity with the ones of individual unprotected Ru NP depos-ited on carbon nanotubes functionalized with nitric acid (O-CNT)[15a]that contains significant amounts of carboxylic groups
to stabilize Ru NP.[33]This catalyst present Ru NP size of 1.5 nm
(Figure S12) and show much lower conversions (Table 2, entry 3 and Figure S13) than the Ru NP networks. For this catalyst, in which the Ru NP are not confined, the selectivity towards styr-ene is higher than for the 2D and 3D NP networks. At low conversions (< 10 %) the two products of the reaction are styr-ene and ethyl benzstyr-ene. High selectivity towards styrstyr-ene and relatively low activity are often obtained on supported or colloi-dal Ru NP (see Table S3 for representative examples from the literature). It thus appears that the confined Ru NP networks prepared in this work present a lower selectivity than many catalytic systems based on supported or colloidal Ru NP. CE have been regularly reported to have a beneficial impact on
catalyst selectivity towards styrene in phenylacetylene
hydrogenation, the CE facilitating desorption of styrene from metallic NP surface.[46]However, it is important to note that in
our confined catalysts the metal loading is extremely high (> 60 % w/w). Thus, the Ru NP density is extremely high and the probability that a desorbed styrene molecule reached a new Ru NP to be further hydrogenated is much higher than in the case of conventional confined catalysts (see Scheme 1).
The different catalysts prepared from TPhTC and HF linkers were also analyzed by ICP and TEM after the catalytic reaction (Figure S14 and Table S4). In all cases, the NP after catalysis are slightly more aggregated, making the determination of their size distribution more difficult. Surprisingly, the average NP sizes is smaller than before the catalytic test. As this could be the result from metal leaching, the ruthenium leaching was de-termined by ICP analyses of the liquid phase after catalysis. Assemblies of TPhTC did not show any leaching, while for HF
ligand it was determined to be only 0.25 %. We therefore attrib-ute this surprising result to the precision of the TEM measures since after catalysis the NP are more aggregated, which is not the case before catalysis. It is also worth mentioning that we cannot discard a possible redispersion of the metallic phase after catalysis with the formation of Ru single atoms. Although we have not performed STEM-HAADF analyses to confirm that possibility, this phenomenon has already been reported for Ru/C catalysts.[47]
These results highlight the good stability of the covalent assemblies prepared as already reported in our previous stud-ies.[15a]
3. Conclusion
We have demonstrated here that the careful choice of the li-gand allows producing in a controlled manner assemblies of Ru metallic NP, which can be ordered in 2D or 3D networks. The networks of small Ru NP are synthesized straightforwardly un-der mild synthetic conditions. We have shown that electronic and steric effects can be finely tuned, and therefore the cata-lytic properties of the materials. It has already been shown that long interparticle distances can be detrimental for activity in the selective hydrogenation of phenylacetylene (weak CE), while electron-deficient Ru surfaces can provide higher selecti-vity towards the semi-hydrogenated product.[15a]The present
work proves that this is not always the case and that the dimen-sionality of the NP networks should also be considered. Even if instinctively 2D networks of metal NP should provide more ac-tive catalysts, as a priori metal surface should be more readily available, here it is not the case, argument which gives strength to the importance of confinement effects, which seem to be more easily reached when using 3D networks of metal NP.
4. Experimental Section
4.1 General Methods: Solvents were purified by standard methods
or by an MBraun SPS-800 solvent purification system. 4-pentyn-1-ol, triethylamine,4-dimethylaminopyridine, malonyl chloride, CBr4,
C60fullerene, 1,8-diazabicyclo[5.4.0]undec-7-ene (DBU), sodium
az-ide (NaN3), 6-bromohexanoic acid, KI, CuBr·SMe2, sodium ascorbate,
QuadraSil® MP, phenylacetylene and decane were purchased from Sigma-Aldrich and used as received. [Ru(COD)(COT)] [(1,5-cycloocta-diene)(1,3,5-cyclooctatriene)ruthenium] was purchased from Na-nomeps Toulouse, CO and H2from Air Liquid. For column
chroma-tography silica gel 60 (230–400 mesh, 0.040–0.063 mm) was pur-chased from E. Merck or by Sephadex LH20 (GE Healthcare, Barce-lona, Spain) gel filtration.
Microwave irradiation experiments were performed using a Monowave 300 (Anton Pear) apparatus. The temperature in the sealed reaction vessel was monitored by an external surface sensor.
4.2 Characterization: The details of characterizations techniques
used in this work are provided in the Method section in the SI).
4.3 Ligand Synthesis
Synthesis of Carboxylic Functionalized Triphenylene (TPhC) 2-(4-(Methoxycarbonyl)phenoxy)hexyloxy)-pentakis-(hexyloxy)triphenylene (1): (Scheme 3) A mixture of
3,6,7,10,11-pentakis(hexyloxy)triphenylen-2-ol[48](1.22 g, 1.64 mmol),
methyl-4-(6-bromohexyloxy)benzoate[48](1.80 g, 5.73 mmol), and anhydrous
K2CO3(0.80 g, 1.44 mmol) in 100 mL of dry butanone was refluxed
under nitrogen atmosphere for 24 h. After cooling to room tempera-ture, the solvent was removed under vacuum, and then water (200 mL) was added. The mixture was extracted with dichloro-methane (5 × 30 mL). The organic fractions were combined and dried with MgSO4. Filtration followed by solvent removal afforded the
crude product, which was purified by column chromatography (silica gel, dichloromethane/hexane 1:3 v/v). The compound was isolated as light yellow solid (1.33 g, 83 % yield).1H NMR (CDCl
3, 500 MHz)
δ(ppm) = 7.97 (d, 2H, ArH, AA′ part of AA′XX′ spin system, N = JAX+ JAX′= 8.98 Hz, JAA′ ~ JXX′), 7.83 (s, 6H, TripH), 6.90 (d, 2H, ArH, XX′ part
of AA′XX′ spin system, N = JAX+ JAX′= 8.98 Hz, JAA′ ~ JXX′), 4.23 (m,
12H, TriPh-O-CH2), 4.04 (t, 2H, ArH-O-CH2, J = 6.40 Hz), 3.88 (s, 3H,
Scheme 3. Synthesis procedure of TPhC.
Scheme 4. Synthesis procedure of TPhTC.
O-CH3), 2.02–1.84 (m, 14H, CH2), 1.71–1.56 (m, 14H, CH2), 1.44–1.33
(m, 20H, CH2), 0.93 (m, 15H, CH3). IR (cm–1): ν (C=O): 1722.
2(6-(4-(Carboxy)phenoxy)hexyloxy)-3,6,7,10,11-pentakis(hexyl-oxy)triphenylene (TPhC): To a suspension of compound (1)
(1.33 g, 1.36 mmol) in 140 mL of absolute ethanol, NaOH (1.69 g, 42.25 mmol) was added. After refluxing for 5 h, the solvent was removed on a rotary evaporator. Water (120 mL) and dichloro-methane (50 mL) were added to the solid residue obtained, and the stirred mixture was treated with 36 % hydrochloric acid until pH = 2. The organic phase was collected and the water solution extracted again with dichloromethane (4 × 50 mL). The dichloro-methane extracts were dried with anhydrous magnesium sulfate and filtered. The solvent was removed on a rotary evaporator to obtain the product as a light yellow solid, which was dried under
vacuum. (1.21 g, 93 % yield).1H NMR (CDCl
3, 500 MHz) δ (ppm) =
10.86 (s, 1H, OH), 8.04 (d, 2H, ArH, AA′ part of AA′XX′ spin system,
N = JAX + JAX′ = 9.01 Hz, JAA′ ~ JXX′), 7.84 (s, 6H, TriPh), 6.93 (d,
2H, ArH, XX′ part of AA′XX′ spin system, N = JAX+ JAX′ = 9.01 Hz,
JAA′ ~ JXX′), 4.23 (m, 12H, TriPh-O-CH2), 4.06 (t, 2H, ArH-O-CH2, J =
6.48 Hz), 2.02–1.86 (m, 14H, CH2), 1.72–1.54 (m, 14H, CH2), 1.45–
1.34 (m, 20H, CH2), 0.93 (m, 15H, CH3).13C {1H} NMR (CDCl3,
126 MHz, Me4Si) δ(ppm) = 171.43 (C=O), 163.60 (sp2-C, O-CPh),
149.03, 149.02, 148.99, 148.97, 148.96, 148.85 (sp2-C, O-C TriPh), 132.32 (sp2-C, H A-CPh), 123.71, 123.67, 123.65, 123.58 (sp2-C, CTriPh), 121.41 (sp2-C, HOOC-C Ph), 114.16 (sp2-C, Hx-CPh), 107.47, 107.46, 107.39, 107.36, 107.25 (sp2-C, H-C TriPh), 69.79, 69.74, 69.71, 69.62, 69.52, 68.10 (O-CH2), 31.69, 31.67, 29.44, 29.43, 29.11, 25.98, 25.85,
22.66 (CH2), 14.05 (CH3). IR (cm–1): ν (C=O): 1690. Anal. calcd. (%) for
C61H88O9: C, 75.90; H, 9.19; O, 14.92; found C, 75.78; H, 9.02. DSC
(Transition temperature and enthalpy in parentheses; data referred to the second heating scan) = Crystal→ Isotropic liquid 63.6 °C (33.2 kJ mol–1).
Synthesis of Tricarboxylic Functionalized Triphenylene (TPhTC) 2,6,10-Tris(6-(4-(methoxycarbonyl)phenoxy)hexyloxy)-3,7,11-tri-hexyloxytriphenylene (2): (Scheme 4). A mixture of
2,6,10-tri-hydroxy-3,7,11-trihexyloxytriphenylene[49](1.83 g, 3.17 mmol),
methyl-4-(6-bromohexyloxy)benzoate[50] (9.00 g, 28.6 mmol), and
anhydrous K2CO3(15.79 g, 114.2 mmol) in 100 mL of dry butanone
was refluxed under nitrogen atmosphere for 24 h. After cooling to room temperature, the solvent was removed under vacuum, and then water (100 mL) was added. The mixture was extracted with dichloromethane (3 × 30 mL). The organic fractions were combined and dried with MgSO4. Filtration followed by solvent removal
af-forded the crude product, which was purified by column chroma-tography (silica gel, ethyl acetate/hexane 3:1 v/v). The compound was isolated as a light yellow solid (2.25 g, 55.4 % yield).1H NMR
(CDCl3, 500 MH z) δ (ppm) = 7.97 (d, 6H, Ar H, AA′ par t of
AA′XX′ spin system, N = JAX+ JAX′= 8.92 Hz, JAA′ ~ JXX′), 7.84 (s, 3H,
TriPh), 7.83 (s, 3H, TriPh), 6.90 (d, 6H, ArH, XX′ part of AA′XX′ spin system, N = JAX+ JAX′= 8.92 Hz, JAA′ ~ JXX′), 4.23 (m, 12H,
TriPh-O-CH2), 4.04 (t, 6H, ArH-O-CH2, J = 6.40 Hz), 3.88 (s, 9H, O-CH3), 2.02–
1.84 (m, 18H, CH2), 1.72–1.53 (m, 18H, CH2), 1.38 (m, 12H, CH2), 0.92
(t, 9H, CH2, J = 6.92 Hz). IR (cm–1): ν (C=O): 1716.
2,6,10-Tris(6-(4-(carboxy)phenoxy)hexyloxy)-3,7,11-trihexyl-oxytriphenylene (TPhTC): To a solution of
2,6,10-tris(6-(4-(meth-oxycarbonyl)phenoxy)hexyloxy)-3,7,11-trihexyloxytriphenylene[49]
(1.90 g, 1.48 mmol) in 100 mL of absolute ethanol, NaOH (3.56 g, 89.1 mmol) was added. After refluxing for 6 h, the solvent was re-moved on a rotary evaporator. Glacial acetic acid (125 mL) was added and the mixture refluxed for 2 h giving rise to a white solid. The solid was collected by filtration, washed first with cold water (3 × 50 mL), then with cold acetone (3 × 50 mL) and finally dried under vacuum. (1.60 g, 87.1 % yield).1H NMR ([D
6]DMSO, 500 MHz)
δ(ppm)= 12.56 (s, 3H, OH), 7.94 (s, 3H, TriPh), 7.93 (s, 3H, TriPh), 7.85
(d, 6H, ArH, AA′ part of AA′XX′ spin system, N = JAX+ JAX′= 8.92 Hz,
JAA′ ~ JXX′), 6.96 (d, 6H, ArH, XX′ part of AA′XX′ spin system, N = JAX + JAX′= 8.92 Hz, JAA′ ~ JXX′), 4.19 (m, 12H, TriPh-O-CH2), 4.01 (t, 6H,
ArH-O-CH2, J = 6.42 Hz), 1.85–1.71 (m, 18H, CH2), 1.63–1.42 (m, 18H,
CH2), 1.35–1.22z (m, 12H, CH2), 0.82 (t, 9H, CH3, J = 6.87 Hz). 13C
{1H} NMR ([D
6]DMSO, 126 MHz, Me4Si) δ(ppm) = 167.44 (C=O),
162.72 (sp2-C, O-C Ph), 149.00, 148.98 (sp2-C, O-CTriPh), 131.75 (sp2-C, HA-CPh), 123.39, 123.35 (sp2-C, CTriPh), 123.26 (sp2-C, HOOC-CPh), 114.56 (sp2-C, H x-CPh), 107.55, 107.49 (sp2-C, H-CTriPh), 69.13, 69.08, 68.12 (O-CH2), 31.53, 29.35, 29.05, 25.97, 25.83, 25.76, 22.58 (CH2),
14.29 (CH3). IR (cm–1): ν (C=O): 1678. Anal. calcd. (%) for C75H96O15:
C, 72.79; H, 7.82; found C, 72.81; H, 7.70. DSC (Transition
tempera-tures and enthalpies in parentheses; data referred to the second heating scan) = Glass→ Nematic 58.5 °C, Nematic → Isotropic liq-uid 113.6 °C (3.3 kJ mol–1).
Synthesis of Hexa-Substituted Fullerene (HF)
Di(pent-4-yn-1-yl) Malonate (1): (Scheme 5) 4-pentyn-1-ol
(0.88 ml, 9.46 mmol), NEt3(1.34 mL) and 4-dimethylaminopyridine
(DMAP) (11.56 mg, 0.0946 mmol) were successively dissolved in di-chloromethane (25 ml) under inert atmosphere. The mixture was cooled down to 0 °C, and a solution of malonyl chloride (0.47 mL, 4.73 mmol) in 1–2 mL of dichloromethane was added dropwise. After 30 min, the reaction mixture was warmed up to room temper-ature and stirred overnight. The reaction solution was treated with 20 mL of HCl (1M) twice, and then by the same volume NaHCO3
saturated solution for two times. After, the organic phase was washed once by 20 mL of brine, dried with MgSO4 and filtered.
After evaporation of the solvent the crude product was purified by flash chromatography (dichloromethane/hexane, 3:1) to obtain colorless oily product. (616.2 mg, 55 % yield). 1H NMR (CDCl
3,
300 MHz) δ(ppm) = 4.30 (t, J = 6.3 Hz, 4H), 3.4 (s, 2H), 2.31 (td,
J = 7.0, 2.7 Hz, 4H), 1.99 (t, J = 2.7 Hz, 2H), 1.89 (m, 4H).
Th-symmetrical C60
Hexa(di(pent-4-yn-1-yl)cyclopropane-1,1-di-carboxylate) (2): (Scheme 5). CBr4(8.8 g, 26 mmol), compound (1)
in Scheme S3 (616 mg, 2.6 mmol) and fullerene (187.4 mg, 0.26 mmol) were dissolved in dry toluene (500 mL). DBU (0.78 mL, 5.2 mmol) was introduced into the mixture dropwise. The color of the solution changed from violet to red. The mixture was kept stir-ring under inert atmosphere for 72 h at room temperature. After that, the organic solution was extracted with 100 mL of saturated Na2S2O3solution, 150 mL of HCl (1M), deionized water twice, and
finally with 100 mL of brine. The organic layer was dried with MgSO4 filtered and concentrated under reduced pressure. The
crude product was purified by flash chromatography using di-chloromethane as eluting solvent. The product was isolated as or-ange solid (289.9 mg, 53 % yield).13C NMR (CDCl
3, 75 MHz, Me4Si) δ (ppm) = 164.0 (C=O), 146.1 (sp2-C C 60), 141.4 (sp2-C C60), 82.8 (C≡), 70.2 (CH≡), 69.4 (sp3-C C 60), 65.7 (CH2), 45.7 (tert-C), 27.5 (CH2), 15.5 (CH2).
6-Azido-hexanoic Acid (3): (Scheme 5) Sodium azide (NaN3, 1 g,
26 mmol), 6-Bromohexanoic acid (1 g, 5 mmol) and KI (170 mg, 1.02 mmol) were dissolved into deionized H2O (15 mL) in a
30 mL glass vial. The reaction was carried out in a microwave at 120 °C for 30 min, and cooled down to 55 °C for removing. The mixture was extracted with diethyl ether (20 mL) three times. The organic layer was washed with brine once and dried with MgSO4. A
colorless liquid was afforded after concentration at reduced pressure (436 mg, 69 % yield). IR (cm–1): 2090.19 (s, N
3), 1703.23 (s, C=O),
1250.95 (m, C-O).13C NMR (CDCl
3, 175 MHz, Me4Si) δ (ppm) = 180.3
(C=O), 51.5 (N-CH2), 34.1 (CH2), 28.8 (CH2), 26.4 (CH2), 24.4 (CH2). Th-symmetrical C60 hexa(6,6
′-((((cyclopropane-1,1-dicarbonyl)- bis(oxy))bis(propane-3,1-diyl))bis(1H-1,2,3-triazole-4,1-diyl))di-hexanoic Acid): (Scheme 5, HF). Compound (Scheme 5 (2))
(120 mg, 0.056 mmol) and 6-azido-hexanoic acid (177.2 mg, 1.129 mmol) were dissolved in DMSO (3 mL). Copper bromide di-methyl sulfide complex, CuBr·SMe2, (81.2 mg, 0.395 mmol) and
so-dium ascorbate (134.2 mg, 0.677 mmol) were added into the mix-ture successively. The solution was stirred with a stirrer twined with copper wire under inert atmosphere at room temperature for 48 h. Then, QuadraSil® MP was added to the solution and stirred for 15 min to remove Cu. After filtration the solution was passed through a Sephadex LH-20 column with dichloromethane/meth-anol (1:1) as elution. The solution was washed by centrifugation
Scheme 5. Synthesis of the hexa-substituted fullerene C60(HF) using a Bingel-Hirsch hexaadduct and click chemistry.[51]
with AcOEt (10 min, 6000 rpm) for three times. A dark red solid was isolated (79 mg, 36 % yield). IR (cm–1): 3140 (w, C-H), 1720 (s, C=O),
1459 (w, triazole), 1210 (s, C-O), 1006 (m, C-O). 1H NMR (DMSO,
700 MHz): δ = 12.00 (s, 1H, COOH), 7.89 (s, 1H, N-CH=C), 4.33 (s, 2H, N-CH2), 4.27 (s, 2H, O-CH2-), 2.63 (s, 2H, CH2), 2.23 (s, 2H, CH2), 1.95
(s, 2H, CH2), 1.77 (s, 2H, CH2), 1.49 (s, 2H, CH2), 1.21 (s, 2H, CH2).13C
NMR (DMSO, 175 MHz, Me4Si): δ = 207.0 (COOH), 163.3 (C=O)145.5
(sp2-C, C
60), 141.2 (sp2-C, C60), 123.0 (N-CH=C), 69.2 (sp3-C, C60), 67.0
(N-CH2), 49.6 (O-CH2), 46.0 ppm (tert-C), 29.9 (CH2), 28.2 (CH2), 26.0
Table 3. Calculation of the -COOH/Rusurfratio.
Rutotal/L L/Rutotal L/Rusurf –COOH/Rusurf Ru@HF 73 0.0137 0.029 (2.2 nm - 47.7 % Rusurf ) 0.35 ( × 12 L/Rusurf) Ru@TPhTC 22.5 0.0444 0.076 (1.7 nm - 58.1 % Rusurf ) 0.23 ( × 3 L/Rusurf)
4.4 Synthesis of Ru NP
In a typical experiment, ruthenium precursor [Ru(η4-C 8H12
)-(η6-C
8H10)] and the corresponding ligand were dissolved in THF in
a Fisher-Porter bottle and the solution was stirred 1 h (30 min for
HF) at room temperature. After this period of time, 3 bar of
dihydro-gen were introduced into the bottle. The reaction was allowed to react 16 h at room temperature under vigorous stirring. The excess of H2was eliminated and the volume of the solvent was reduced
under vacuum. The black solid from the suspension was precipi-tated after the addition of 200 mL of pentane. After filtration under argon with a cannula, the black solid powder was washed twice with pentane (200 mL) and filtered again before drying under vac-uum overnight. For typical ratio and ligand studied, the quantities of the reactants are detailed hereafter:
Ru@TPhC - 10:1: 50 mg (0.159 mmol) of [Ru(η4-C
8H12)(η6-C8H10)],
13.8 mg (0.0143 mmol) of TPhC, and 20 mL of THF. Yield: 21.7 mg.
Ru@TPhTC - 4:1: 200 mg (0.634 mmol) of [Ru(η4-C
8H12)(η6-C8H10)],
200 mg (0.162 mmol) of TPhTC, and 80 mL of THF. Yield: 156.1 mg. Anal.: Ru, 14.4 %.
Ru@TPhTC - 20:1: 200 mg (0.634 mmol) of [Ru(η4-C
8H12)(η6-C8H10)],
40.6 mg (0.033 mmol) of TPhTC, and 80 mL of THF. Yield: 65.7 mg. Anal.: Ru, 50.6 %.
Ru@TPhTC - 40:1: 200 mg (0.634 mmol) of [Ru(η4-C
8H12)(η6-C8H10)],
20.3 mg (0.016 mmol) of TPhTC, and 80 mL of THF. Yield: 81.7 mg. Anal.: Ru, 66.0 %; C, 17.0 %; H, 1.8 %.
Ru@TPhTC - 70:1: 200 mg (0.634 mmol) of [Ru(η4-C
8H12)(η6-C8H10)],
10.7 mg (0.009 mmol) of TPhTC, and 80 mL of THF. Yield: 63.5 mg. Anal: Ru, 66.1 %.
Ru@HF - 120:1: 130 mg (0.412 mmol) of [Ru(η4-C
8H12)(η6-C8H10)],
13.3 mg (0.0034 mmol) of HF, and 2.6 mL of methanol and 26 mL of THF. Yield: 50.4 mg. Anal.: Ru, 65.9 %; C, 16.0 %; H, 1.2 %; N, 2.6 %.
4.5 Catalytic Hydrogenation of Phenylacetylene
In a typical catalytic reaction, a mixture of phenylacetylene (4 mmol, 412 mg), decane (0.5 mmol, 71 mg) and Ru NP catalyst (0.02 mmol of Ru) were dispersed in methanol (25 mL) in a magnetically stirred autoclave with Teflon inner cylinder. The autoclave was purged three times with H2. The autoclave was pressurized with 5 bar of
H2at room temperature and stirred at 1500 rpm. Under such
condi-tions, external mass transfer limitation should not be relevant.[15a]
The suspension was continuously stirred until the end of the reac-tion. Gas chromatography (GC) was used to identify the products. After catalysis, samples were taken for TEM analyses, also, the % of Ru on the filtered catalytic solution was ascertained by ICP.
Calculation of Ru Surface Content
The number of Ru atoms in hcp cell (N) is 6. Ru atom radius (RRu) is
0.214 nm. The volume of Ru cell is 0.0817 nm3. R
NPrepresents the
radius of the NP. The volume of all Ru atoms on the shell of NP: Vshell= Vtotal– Vcore= 4/3πRNP3– 4/3π(RNP-RRu)3, Vtotalmeaning the
volume of one Ru nanoparticle, Vcorepresenting the volume of the
NP excluded the one outer layer of atoms. The numbers of Ru at-oms on the shell Nshell = N*Vshell/0.0817. The number of total Ru
atoms Ntotal= N*Vtotal/0.0817. The percentage of Ru atoms on the
surface of the NP = Nshell/Ntotal*100 %. For calculation of the COOH/
Rusurfratio see Table 3.
Acknowledgments
We acknowledge the Centre National de la Recherche Scientif-ique (CNRS) and Institute Nationale PolytechnScientif-ique (INP). This work was supported by the Agence Nationale de la Recherche (ANR project ANR-16-CE07-0007-01, Icare-1), which is gratefully acknowledged.
Keywords: Metallic nanoparticles · Ruthenium · Covalent
assembly · Acetylene hydrogenation · Confinement effect
[1] A. Küchler, M. Yoshimoto, S. Luginbühl, F. Mavelli, P. Walde, Nat.
Nano-technol. 2016, 11, 409–420.
[2] a) S. Sadjadi in Organic Nanoreactors (Ed.: S. Sadjadi), Academic Press, Boston, 2016, pp. 1–14; b) P. Ballester, Angew. Chem. Int. Ed. 2017, 56, 7713; Angew. Chem. 2017, 56, 7713–7714.
[3] a) S. H. Petrosko, R. Johnson, H. White, C. A. Mirkin, J. Am. Chem. Soc.
2016, 138, 7443–7445; b) M. T. De Martino, L. K. E. A. Abdelmohsen,
F. P. J. T. Rutjes, J. C. M. van Hest, Beilstein J. Org. Chem. 2018, 14, 716– 733.
[4] a) F. Yang, D. Deng, X. Pan, Q. Fu, X. Bao, Natl. Sci. Rev. 2015, 2, 183– 201; b) F. Goettmann, C. Sanchez, J. Mater. Chem. 2007, 17, 24–30; c) V. Mouarrawis, R. Plessius, J. I. van der Vlugt, J. N. H. Reek, Front. Chem.
2018, 6, 623.
[5] B. Smit, T. L. M. Maesen, Nature 2008, 451, 671–678.
[6] W. Sparreboom, A. van den Berg, J. C. T. Eijkel, New J. Phys. 2010, 12, 015004.
[7] L. D. Gelb, K. E. Gubbins, R. Radhakrishnan, M. Sliwinska-Bartkowiak, Rep.
Prog. Phys. 2000, 63, 727–727.
[8] C. Alba-Simionesco, B. Coasne, G. Dosseh, G. Dudziak, K. E. Gubbins, R. Radhakrishnan, M. Sliwinska-Bartkowiak, J. Phys. Condens. Matter 2006,
18, R15–R68.
[9] Y. Long, J. C. Palmer, B. Coasne, M. Śliwinska-Bartkowiak, K. E. Gubbins,
Phys. Chem. Chem. Phys. 2011, 13, 17163–17170.
[10] a) S.-M. Wu, X.-Y. Yang, C. Janiak, Angew. Chem. Int. Ed. 2019, 131, 12468;
Angew. Chem. 2019, 58, 12340–12354; b) N. Kosinov, C. Liu, E. J. M.
Hen-sen, E. A. Pidko, Chem. Mater. 2018, 30, 3177–3198; c) G. Sastre, A. Corma,
J. Mol. Catal. A 2009, 305, 3–7.
[11] a) N. Wang, Q. Sun, J. Yu, Adv. Mater. 2019, 31, 1803966; b) Q. Yang, Q. Xu, H.-L. Jiang, Chem. Soc. Rev. 2017, 46, 4774–4808.
[12] a) P. Serp, E. Castillejos, ChemCatChem 2010, 2, 41–47; b) S. A. Miners, G. A. Rance, A. N. Khlobystov, Chem. Soc. Rev. 2016, 45, 4727–4746. [13] S. Lu, Y. Hu, S. Wan, R. McCaffrey, Y. Jin, H. Gu, W. Zhang, J. Am. Chem.
Soc. 2017, 139, 17082–17088.
[14] a) H. Li, J. Xiao, Q. Fu, X. Bao, Proc. Natl. Acad. Sci. USA 2017, 114, 5930– 5934; b) L. Tang, X. Meng, D. Deng, X. Bao, Adv. Mater. 2019, 31, 1901996. [15] a) Y. Min, M. R. Axet, P. Serp, in Molecular Catalysis (Eds.: P. W. N. M. van Leeuwen, C. Claver), Springer Nature, Switzerland AG 2020, vol. 1, pp. 129–198; b) Y. Min, H. Nasrallah, D. Poinsot, P. Lecante, Y. Tison, H. Martinez, P. Roblin, A. Falqui, R. Poteau, I. del Rosal, I. C. Gerber, J.-C. Hierso, M. R. Axet, P. Serp, Chem. Mater. 2020, 32, 2365–2378; c) F. Leng, I. C. Gerber, P. Lecante, A. Bentaleb, A. Muñoz, B. M. Illescas, N. Martín, G. Melinte, O. Ersen, H. Martinez, Chem. Eur. J. 2017, 23, 13379–13386; d) T. Huang, G. Sheng, P. Manchanda, A. H. Emwas, Z. Lai, S. P. Nunes, K.-V. Peinemann, Sci. Adv. 2019, 5, eaax6976.
[17] M. K. Kinnan, G. Chumanov, J. Phys. Chem. C 2010, 114, 7496–7501. [18] R. Li, X. Zhu, D. Shou, X. Zhou, X. Yan, RSC Adv. 2016, 6, 88486–88489. [19] a) S. Julin, S. Nummelin, M. A. Kostiainen, V. Linko, J. Nanopart. Res. 2018,
20, 119; b) C. George, I. Szleifer, M. Ratner, ACS Nano 2013, 7, 108–116;
c) I. Fratoddi, R. Matassa, L. Fontana, I. Venditti, G. Familiari, C. Battocchio, E. Magnano, S. Nappini, G. Leahu, A. Belardini, R. Li Voti, C. Sibilia, J. Phys.
Chem. C 2017, 121, 18110–18119; d) S. K. Ghosh, T. Pal, Chem. Rev. 2007, 107, 4797–4862.
[20] S. Sreedhala, C. P. Vinod, Chem. Commun. 2015, 51, 10178–10181. [21] E. Morsbach, S. Kunz, M. Bäumer, Catal. Sci. Technol. 2016, 6, 339–348. [22] a) H. Yan, S. I. Lim, Y.-J. Zhang, Q. Chen, D. Mott, W.-T. Wu, D.-L. An, S.
Zhou, C.-J. Zhong, Chem. Commun. 2010, 46, 2218–2220; b) WangWang, X. Shi, N. N. Kariuki, M. Schadt, G. R. Wang, Q. Rendeng, J. Choi, J. Luo, S. Lu, C.-J. Zhong, J. Am. Chem. Soc. 2007, 129, 2161–2170; c) R. Abar-gues, S. Albert, J. L. Valdés, K. Abderrafi, J. P. Martínez-Pastor, J. Mater.
Chem. 2012, 22, 22204–22211.
[23] a) S. Kumar, Liq. Cryst. 2004, 31, 1037–1059; b) S. K. Pal, S. Setia, B. S. Avinash, S. Kumar, Liq. Cryst. 2013, 40, 1769–1816.
[24] a) D. Sonet, B. Bibal, Tetrahedron Lett. 2019, 60, 872–884; b) L.-P. Yang, C.-Y. Pan, Macromol. Chem. Phys. 2008, 209, 783–793; c) C. T. Kresge, M. E. Leonowicz, W. J. Roth, J. C. Vartuli, J. S. Beck, Nature 1992, 359, 710–712; d) C. D. Sheraw, L. Zhou, J. R. Huang, D. J. Gundlach, T. N. Jackson, M. G. Kane, I. G. Hill, M. S. Hammond, J. Campi, B. K. Greening, J. Francl, J. West,
Appl. Phys. Lett. 2002, 80, 1088–1090; e) S. Das, F. Irin, H. S. Tanvir Ahmed,
A. B. Cortinas, A. S. Wajid, D. Parviz, A. F. Jankowski, M. Kato, M. J. Green,
Polymer 2012, 53, 2485–2494.
[25] a) A. Mahringer, A. C. Jakowetz, J. M. Rotter, B. J. Bohn, J. K. Stolarczyk, J. Feldmann, T. Bein, D. D. Medina, ACS Nano 2019, 13, 6711–6719; b) E. M. Miner, L. Wang, M. Dinca, Chem. Sci. 2018, 9, 6286–6291; c) L. Yang, X. He, M. Dinca, J. Am. Chem. Soc. 2019, 141, 10475–10480.
[26] M. Mansueto, S. Sauer, M. Butschies, M. Kaller, A. Baro, R. Woerner, N. H. Hansen, G. Tovar, J. Pflaum, S. Laschat, Langmuir 2012, 28, 8399–8407. [27] a) Z. Shen, M. Yamada, M. Miyake, J. Am. Chem. Soc. 2007, 129, 14271–
14280; b) A. Gowda, S. Kumar, Materials 2018, 11, 382.
[28] M. Hara, S. Nagano, T. Seki, J. Am. Chem. Soc. 2010, 132, 13654–13656. [29] a) D. P. Dinega, M. Bawendi, Angew. Chem. Int. Ed. 1999, 38, 1788–1791;
Angew. Chem. 1999, 111, 1906; b) F. Dassenoy, M.-J. Casanove, P. Lecante,
M. Verelst, E. Snoeck, A. Mosset, T. O. Ely, C. Amiens, B. Chaudret, J. Chem.
Phys. 2000, 112, 8137–8145.
[30] a) O. Margeat, M. Respaud, C. Amiens, P. Lecante, B. Chaudret, Beilstein J.
Nanotechnol. 2010, 1, 108–118; b) E. Bonnefille, F. Novio, T. Gutmann, R.
Poteau, P. Lecante, J.-C. Jumas, K. Philippot, B. Chaudret, Nanoscale 2014,
6, 9806–9816; c) R. Choukroun, D. de Caro, B. Chaudret, P. Lecante, E.
Snoeck, New J. Chem. 2001, 25, 525–527.
[31] R. Mas-Balleste, C. Gomez-Navarro, J. Gomez-Herrero, F. Zamora,
Nano-scale 2011, 3, 20–30.
[32] R. Besselink, T. Stawski, A. Van Driessche, L. G. Benning, J. Chem. Phys.
2016, 145, 211908.
[33] B. F. Machado, M. Oubenali, M. Rosa Axet, T. Trang Nguyen, M. Tunckol, M. Girleanu, O. Ersen, I. C. Gerber, P. Serp, J. Catal. 2014, 309, 185–198. [34] R. Gonzalez-Gomez, L. Cusinato, C. Bijani, Y. Coppel, P. Lecante, C. Amiens,
I. del Rosal, K. Philippot, R. Poteau, Nanoscale 2019, 11, 9392–9409. [35] P. Uznanski, J. Zakrzewska, F. Favier, S. Kazmierski, E. Bryszewska, J.
Nano-part. Res. 2017, 19, 121.
[36] E. Bresó-Femenia, B. Chaudret, S. Castillón, Catal. Sci. Technol. 2015, 5, 2741–2751.
[37] N. Chakroune, G. Viau, S. Ammar, L. Poul, D. Veautier, M. M. Chehimi, C. Mangeney, F. Villain, F. Fievet, Langmuir 2005, 21, 6788–6796. [38] a) H. Li, Q. Zheng, C. Han, Analyst 2010, 135, 1360–1364; b) V. Kamalraj,
S. Senthil, P. Kannan, J. Mol. Struct. 2008, 892, 210–215.
[39] V. Krishnakumar, R. J. Xavier, Spectrochim. Acta Part A 2004, 60, 709–714. [40] United States Pat., 6,727,398, 2004.
[41] M. Bystrzanowska, P. Petkov, M. Tobiszewski, ACS Sustainable Chem. Eng.
2019, 7, 18434–18443.
[42] M. R. Axet, K. Philippot, Chem. Rev. 2020, 120, 1085–1145.
[43] a) W. Qian, L. Lin, Y. Qiao, X. Zhao, Z. Xu, H. Gong, D. Li, M. Chen, R. Huang, Z. Hou, Appl. Catal. A 2019, 585, 117183; b) S. Noël, D. Bourbiaux, N. Tabary, A. Ponchel, B. Martel, E. Monflier, B. Léger, Catal. Sci. Technol.
2017, 7, 5982–5992; c) L. Rakers, L. M. Martinez-Prieto, A. M.
Lopez-Vin-asco, K. Philippot, P. van Leeuwen, B. Chaudret, F. Glorius, Chem.
Com-mun. 2018, 54, 7070–7073; d) C. Li, Z. Shao, M. Pang, C. T. Williams, X.
Zhang, C. Liang, Ind. Eng. Chem. Res. 2012, 51, 4934–4941; e) M. Dhiman, B. Chalke, V. Polshettiwar, ACS Sustainable Chem. Eng. 2015, 3, 3224– 3230; f) J.-Y. Ruzicka, D. P. Anderson, S. Gaw, V. B. Golovko, Aust. J. Chem.
2012, 65, 1420–1425; g) T. López, J. Hernandez-Ventura, M. Asomoza,
A. Campero, R. Gómez, Mater. Lett. 1999, 41, 309–316; h) A. Maximov, A. Zolotukhina, L. Kulikov, Y. Kardasheva, E. Karakhanov, React. Kinet. Mech.
Catal. 2016, 117, 729–743; i) M. Niu, Y. Wang, W. Li, J. Jiang, Z. Jin, Catal. Commun. 2013, 38, 77–81; j) S. Ji, Y. Chen, S. Zhao, W. Chen, L. Shi, Y.
Wang, J. Dong, Z. Li, F. Li, C. Chen, Q. Peng, J. Li, D. Wang, Y. Li, Angew.
Chem. Int. Ed. 2019, 58, 4271–4275; Angew. Chem. 2019, 131, 4315.
[44] S. Domínguez-Domínguez, Á. Berenguer-Murcia, B. K. Pradhan, Á. Lin-ares-Solano, D. Cazorla-Amorós, J. Phys. Chem. C 2008, 112, 3827–3834. [45] a) M. J.-L. Tschan, O. Diebolt, P. W. N. M. van Leeuwen, Top. Catal. 2014,
57, 1054–1065; b) S. Campisi, M. Schiavoni, C. E. Chan-Thaw, A. Villa, Catalysts 2016, 6, 185; c) L. M. Rossi, J. L. Fiorio, M. A. S. Garcia, C. P.
Ferraz, Dalton Trans. 2018, 47, 5889–5915.
[46] a) N. Tiengchad, O. Mekasuwandumrong, C. Na-Chiangmai, P. Weera-chawanasak, J. Panpranot, Catal. Commun. 2011, 12, 910–916; b) H. Tian, F. Huang, Y. Zhu, S. Liu, Y. Han, M. Jaroniec, Q. Yang, H. Liu, G. Qing, M. Lu, J. Liu, Adv. Funct. Mater. 2018, 28, 1801737; c) L. Xia, D. Li, J. Long, F. Huang, L. Yang, Y. Guo, Z. Jia, J. Xiao, H. Liu, Carbon 2019, 145, 47–52; d) J. Tang, P. Liu, X. Liu, L. Chen, H. Wen, Y. Zhou, J. Wang, ACS Appl. Mater.
Interfaces 2020, 12, 11522–11532.
[47] S. K. Kaiser, R. Lin, F. Krumeich, O. V. Safonova, J. Pérez-Ramírez, Angew.
Chem. Int. Ed. 2019, 58, 12297–12304; Angew. Chem. 2019, 58, 12297–
12304.
[48] B. Feringán, P. Romero, J. L. Serrano, C. L. Folcia, J. Etxebarria, J. Ortega, R. Termine, A. Golemme, R. Giménez, T. Sierra, J. Am. Chem. Soc. 2016,
138, 12511–12518.
[49] Z. Ke-Qing, W. Bi-Qin, H. Ping, L. Quan, Z. Liang-Fu, Chin. J. Chem. 2005,
23, 767–774.
[50] W. Xiao, Z. He, M. Xu, N. Wu, X. Kong, X. Jing, Tetrahedron Lett. 2015, 56, 700–705.
[51] a) J. Iehl, R. Pereira de Freitas, B. Delavaux-Nicot, J. F. Nierengarten, Chem.
Commun. 2008, 2450–2452; b) A. Hirsch, O. Vostrowsky, Eur. J. Org. Chem. 2001, 2001, 829–848; c) M. Sanchez-Navarro, A. Munoz, B. M. Illescas, J.