HAL Id: hal-00298356
https://hal.archives-ouvertes.fr/hal-00298356
Submitted on 19 Feb 2008
HAL is a multi-disciplinary open access
archive for the deposit and dissemination of
sci-entific research documents, whether they are
pub-lished or not. The documents may come from
teaching and research institutions in France or
abroad, or from public or private research centers.
L’archive ouverte pluridisciplinaire HAL, est
destinée au dépôt et à la diffusion de documents
scientifiques de niveau recherche, publiés ou non,
émanant des établissements d’enseignement et de
recherche français ou étrangers, des laboratoires
publics ou privés.
on near-surface temperature of the equatorial Pacific: a
model study
J. F. Lübbecke, C. W. Böning, A. Biastoch
To cite this version:
J. F. Lübbecke, C. W. Böning, A. Biastoch. Variability in the subtropical-tropical cells and its effect
on near-surface temperature of the equatorial Pacific: a model study. Ocean Science, European
Geosciences Union, 2008, 4 (1), pp.73-88. �hal-00298356�
www.ocean-sci.net/4/73/2008/
© Author(s) 2008. This work is licensed under a Creative Commons License.
Ocean Science
Variability in the subtropical-tropical cells and its effect on
near-surface temperature of the equatorial Pacific: a model study
J. F. L ¨ubbecke, C. W. B¨oning, and A. Biastoch
Leibniz Institute of Marine Sciences at the University of Kiel, (IfM-GEOMAR), Kiel, Germany Received: 27 June 2007 – Published in Ocean Sci. Discuss.: 6 July 2007
Revised: 28 November 2007 – Accepted: 14 January 2008 – Published: 19 February 2008
Abstract. A set of experiments utilizing different imple-mentations of the global ORCA-LIM model with horizon-tal resolutions of 2◦, 0.5◦ and 0.25◦ is used to investigate tropical and extra-tropical influences on equatorial Pacific SST variability at interannual to decadal time scales. The model experiments use a bulk forcing methodology building on the global forcing data set for 1958 to 2000 developed by Large and Yeager (2004) that is based on a blend of at-mospheric reanalysis data and satellite products. Whereas representation of the mean structure and transports of the (sub-)tropical Pacific current fields is much improved with the enhanced horizontal resolution, there is only little differ-ence in the simulation of the interannual variability in the equatorial regime between the 0.5◦ and 0.25◦ model ver-sions, with both solutions capturing the observed SST vari-ability in the Ni˜no3-region. The question of remotely forced oceanic contributions to the equatorial variability, in partic-ular, the role of low-frequency changes in the transports of the Subtropical Cells (STCs), is addressed by a sequence of perturbation experiments using different combinations of fluxes. The solutions show the near-surface temperature vari-ability to be governed by wind-driven changes in the Equa-torial Undercurrent. The relative contributions of equaEqua-torial and off-equatorial atmospheric forcing differ between inter-annual and longer, (multi-) decadal timescales: for the lat-ter there is a significant impact of changes in the equator-ward transport of subtropical thermocline water associated with the lower branches of the STCs, related to variations in the off-equatorial trade winds. A conspicuous feature of the STC variability is that the equatorward transports in the in-terior and along the western boundary partially compensate each other at both decadal and interannual time scales, with the strongest transport extrema occurring during El Ni˜no episodes. The behaviour is rationalized in terms of a wob-Correspondence to: J. F. L¨ubbecke
bling in the poleward extents of the tropical gyres, which is manifested also in a meridional shifting of the bifurcation lat-itudes of the North and South Equatorial Current systems.
1 Introduction
The upper-ocean circulation in the tropical Pacific can be described, in a zonally-integrated sense, in terms of shal-low subtropical-tropical overturning cells (STCs; McCreary and Lu, 1994; Liu et al., 1994), involving equatorward geostrophic transport of water in the main thermocline, its upwelling at the equator, and return to the subtropics in the surface Ekman layer (Fig. 1). Since the strength of the STCs relates to the rate of supply of cold subtropical waters to the equatorial upwelling regime, low-frequency changes in STC transport have been proposed as a mechanism contribut-ing to the modulation of sea surface temperature (SST) in the equatorial Pacific (Kleeman et al., 1999), thus represent-ing an oceanic mechanism potentially important for gener-ating changes in tropical climate parameters, such as ENSO decadal variability (for a review, see Chang et al., 2006). The dynamics of changes in STC transport and their role in equa-torial SST variability have been examined by ocean model studies of various complexity and different coupling to the atmosphere. The original study of Kleeman et al. (1999) in-voked a 312 layer shallow water model coupled to a statisti-cal atmosphere; changes in equatorial SSTs were found here to be related to changes in STC transports induced by wind stress forcing poleward of ∼23◦ latitude. The leading role of ocean dynamics in generating low-frequency equatorial SST variability was confirmed by ocean general circulation model (OGCM) results of Nonaka et al. (2002). Their set of experiments forced by observed wind stress (from reanalysis products) showed SST anomalies at interannual time scales to be governed by equatorial (5◦N–5◦S) winds, whereas at decadal time scales both equatorial and off-equatorial winds
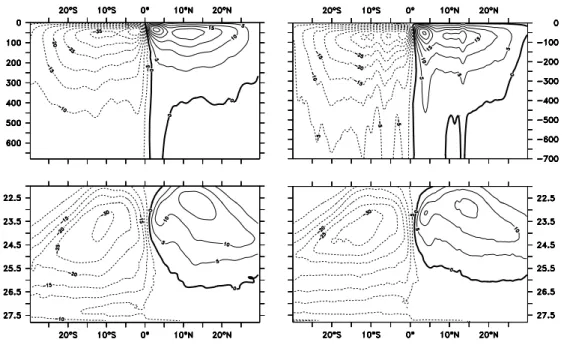
Fig. 1. Mean meridional overturning streamfunctions for the upper layer Pacific and Indian Ocean obtained by zonal integrations of the
velocity fields along fixed depth-levels (upper panels) and along time-varying isopycnal surfaces (σ0) (lower panels), for REF-05 (left) and REF-025 (right).
were important; in contrast to Kleeman et al. (1999) the con-tribution from midlatitude winds poleward of 25◦was negli-gible, however. The mechanism of the off-equatorial forcing involved anomalies in heat transport caused by a spinning up and down of the STCs, resulting in vertical shifts in the depth of the equatorial thermocline. Observational evidence for the decadal variability mechanism proposed by Kleeman et al. (1999) was presented by McPhaden and Zhang (2002); hereafter MZ02, and McPhaden and Zhang (2004); hereafter MZ04. Estimates of meridional geostrophic transport con-vergence across 9◦N and 9◦S from historical hydrographic data for four time intervals of approximately 10 years, sug-gested a slowdown of the equatorward thermocline transport between the 1970s and the 1990s, corresponding to the in-creasing trend in the central and eastern equatorial SST dur-ing this period (MZ02); durdur-ing the 1990s the trend appeared to be reversed , indicating a rebound of the STCs towards a more active state in the early 2000s (MZ04). Sparsity of data in space and time, particularly for the western bound-ary current (WBC) regimes, led to some uncertainty, how-ever, in the calculation of the net, zonally-integrated trans-ports (i.e., the STC transtrans-ports). Understanding of the rel-evant processes in decadal STC variability and its relation to SST variability in the equatorial Pacific was advanced by several model studies. The importance of the WBCs in transport budgets was demonstrated by modelling studies of Lee and Fukumori (2003) (hereafter LF) and Hazeleger et al. (2004), both suggesting a tendency for a partial
compensa-tion of boundary and interior transport variability on inter-annual and decadal time scales. A comprehensive, three-dimensional perspective of the structure of STC changes and of the associated phase relationships between its different branches and the equatorial SST changes was provided by Capotondi et al. (2005); (hereafter CA), based on an OGCM driven by observed surface forcing for 1958–1997. Consis-tent with the observations of MZ02, the model simulated a decreasing trend for the interior thermocline transport after the mid-1970s (somewhat weaker but within the error bars of MZ02), which correlated with the SST change in the central to eastern equatorial Pacific. The interior transport variations were partially compensated, however, by boundary current changes; and an understanding of the phase relationship be-tween transport and SST changes required consideration of the ocean adjustment process through westward-propagating Rossby waves. The importance of western boundary current contributions to the net equatorward transports and equato-rial SST trends suggested by these studies raises the issue of possible model sensitivities, in particular, to horizontal res-olution. Previous model studies have usually utilized grid configurations (marginally) adapted to the minimum require-ment for resolving equatorial wave dynamics (e.g., a latitu-dinal grid spacing near the equator of 0.6◦in CA), but typi-cally lacked zonal resolution to capture the western boundary regimes (e.g., zonal grid spacing in CA was 2.4◦). A first, eddy-resolving model study was reported by Cheng et al. (2007) for the years 1992–2003. Their simulation showed
an upward trend during that period in the equatorward py-cnocline transport in qualitative agreement with MZ04, and demonstrated a relationship between the decadal changes in the transport convergence, the EUC transport, equatorial up-welling, and SST in the equatorial Pacific. As in the previ-ous, coarse resolution studies of LF and CA, the equatorward pycnocline transports across 9◦N/9◦S in the interior Pacific were partially compensated by opposing changes in the west-ern boundary currents.
In this study, we are concerned with the interannual-decadal variations in the tropical Pacific in response to at-mospheric momentum, heat and freshwater fluxes during the period 1958–2000. The atmospheric forcing builds on the formulations developed by Large and Yeager (2004) based on combinations of reanalysis products and various observed fields, e.g., from satellite products. Our implementation fol-lows the proposed configuration of “Co-ordinated Ocean-ice Reference Experiments” (COREs) by the WCRP/CLIVAR Working Group on Ocean Model Development (Griffies et al., 2007). We analyze a sequence of experiments per-formed with different configurations of a global ocean cir-culation model, including recent developments with 0.5◦ and 0.25◦horizontal resolutions. The main objective of the present study is to re-examine the mechanisms of the STC variability and its relation to SST changes in the equatorial Pacific in model simulations with increased horizontal reso-lution, particularly in longitudinal direction. There are two specific questions we want to address: first, the relative im-portance of equatorial vs. off-equatorial dynamic causes of low-frequency equatorial SST variability; and second, the nature of the compensatory behaviour between equatorward transport changes in the interior ocean and near the western boundary.
The paper is organized as follows: in Sect. 2 we intro-duce the ocean circulation model, and describe the sequence of reference cases and perturbation experiments. In Sect. 3 we discuss the ability of the different model configurations to capture major aspects of the annual mean flow fields in the tropical Pacific, before turning in Sect. 4 to the analysis of the low-frequency variability: first, in Sect. 4.1, to the vari-ability of near-surface equatorial temperature in the Ni˜no3-region, its relation to EUC and STC changes on interannual and decadal time scales, and the relevance of equatorial and off-equatorial atmospheric forcing; second, in Sect. 4.2, to the meridional transport variability in the interior and west-ern boundary regimes and the degree and nature of compen-sation between these components. A summary and conclu-sions are given in Sect. 5.
2 Model configurations
Three different, global implementations of the OPA ocean model (the recent release 9.0 of the model described by Madec et al., 1998) coupled to the LIM2 sea ice model
(Fichefet and Morales-Marqueda, 1997) are used, all utiliz-ing a tripolar grid configuration (Madec and Imbard, 1996), referred to as ORCA2, ORCA05 and ORCA025: the nom-inal equatorial grid sizes are 2◦, 0.5◦ and 0.25◦, respec-tively; near the equator the latitudinal resolution of ORCA2 increases to 0.5◦. Both higher resolution models share the same vertical grid formulation, with 46 geopotential levels of variable thickness; vertical resolution is 6 m at the surface, and there are 20 vertical levels in the top 500 m. In ORCA2 there are 31 vertical levels. Vertical mixing is achieved us-ing the TKE scheme of Blanke and Delecluse (1993). Lat-eral mixing is oriented along isopycnals. In ORCA2 and ORCA05 the effect of eddies is parametrized using a GM scheme (Gent and McWilliams, 1990) with coefficients de-pending on the internal Rossby Radius, effectively render-ing a non-eddyrender-ing solution. Topographic slopes are repre-sented by a partial step formulation (Adcroft et al., 1997); together with an advanced energy-enstrophy conserving mo-mentum advection scheme, the ORCA025-configuration was found to achieve significant improvements in simulating boundary current and frontal regimes in the world ocean (Barnier et al., 2006). The momentum, heat and freshwa-ter fluxes at the sea surface are implemented according to the “CORE-II”-protocol proposed by Griffies et al. (2007), utilizing the bulk forcing methodology for global ocean-ice models developed by Large and Yeager (2004). It is based on NCEP/NCAR reanalysis products for the atmospheric state during 1958–2004, merged with various observational (e.g., satellite) products for radiation, precipitation and continental run-off fields, and adjusted so as to provide a globally bal-anced diurnal to decadal forcing ensemble (Large, 2007). A notable deviation from the reanalysis fields with some rele-vance to the present study is the correction of the low bias in NCEP wind speeds (Smith et al., 2001) by application of a spatially-dependent factor derived from the ratio of the QuikScat scatterometer to the NCEP winds calculated over a two-year period (2000–2001). The scatterometer winds are higher by 5–10% over most of the mid-latitude ocean, but the correction factor increases to more than 30% over the equato-rial Pacific (cf., Fig. 6 in Large and Yeager, 2004). A general issue of ocean-only modelling, pertinent especially to simu-lations of low-frequency variability, is the need to prescribe the evolution of (at least, parts of) the atmospheric state in the formulation of the surface boundary condition for tempera-ture, thereby eliminating potentially important air-sea feed-backs. Specifically, this concerns the turbulent heat fluxes which can be expressed as functions of SST and atmospheric state variables (most importantly, surface air temperature and wind speed). For the computation of the fluxes in ocean-only models (i.e., by invoking a bulk formula), the latter have to be prescribed: since this implies a damping of SST toward given surface air temperature values, SST effectively ceases to be a prognostic model variable. The previous OGCM stud-ies of the Pacific STC variability dealt with this situation in different ways: Nonaka et al. (2002) used a restoring of SST
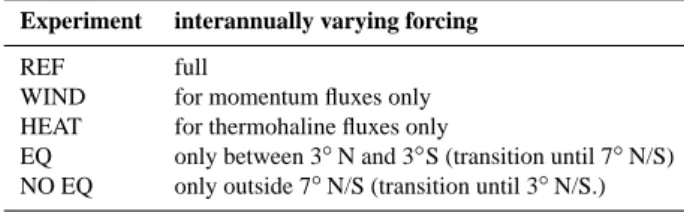
Table 1. The different experiments
Experiment interannually varying forcing
REF full
WIND for momentum fluxes only
HEAT for thermohaline fluxes only
EQ only between 3◦N and 3◦S (transition until 7◦N/S)
NO EQ only outside 7◦N/S (transition until 3◦N/S.)
to monthly climatological values, thus allowing interannual SST variations only to be generated (albeit damped) dynam-ically, by changes in the wind-driven circulation. In contrast, both CA and Cheng et al. (2007) chose bulk formulations for the turbulent fluxes (based on different reanalysis prod-ucts: NCEP for 1959–1997, and ECMWF for 1979–2003, re-spectively), so that in these cases the effect of interior ocean dynamics on SST was superimposed by a relaxation toward prescribed atmospheric temperatures. In the present study we basically follow the latter approach and adopt a bulk for-mulation for the turbulent fluxes; however, it will be shown that while SST is tightly constrained by the thermal bound-ary condition, the impact of wind-driven circulation changes on the near-surface equatorial temperature variability is re-flected in the temperature response below the mixed layer. The model integrations were initialized with the annual mean temperature and salinity distributions of the Levitus clima-tology (Levitus et al., 1998) for low and mid-latitudes, and from the data set of the Polar Hydrographic Center (PHC 2.1) for high latitudes (Steele et al., 2001). The main (refer-ence) experiments with the interannual CORE-forcing span the period of 1958–2000. The ORCA2 and ORCA05 sim-ulations built on a climatological spin-up of 20 years while the ORCA025 run started from scratch. These experiments with “full” interannual variation, i.e., in the momentum, heat and freshwater fluxes, will be referred to as REF-2, REF-05 and REF-025, respectively. In all experiments, the freshwa-ter forcing followed the common practice of including a re-laxation of sea surface salinity to observed, climatological values. However, the restoring time scale in the subtropics-tropics is 180 days, rendering a relatively weak damping compared to previous studies.
In order to identify the relative contributions of equatorial and off-equatorial (wind) forced circulation changes on the equatorial near-surface temperature variability, REF-05 is complemented by two pairs of perturbation experiments us-ing ORCA05. All experiments use the same initial condi-tions and span the same integration period (1958–2000), but are subject to different, artificial changes in the forcing set-up; an overview is given in Table 1. The first pair exam-ines the relative importance of changes in the wind-driven circulation. In WIND, the interannual variability is restricted to the momentum fluxes (wind stress) only, while the ther-mohaline fluxes are based on a climatological, repeated
an-nual cycle. In HEAT, the thermohaline fluxes are interan-nual, the wind stress is climatological. Note that the wind speed determining thermohaline fields (e.g. evaporation) is interannually varying for HEAT and climatological in case of WIND. The second pair aims at identifying the contribu-tion from off-equatorial forcing. In EQ, the interannual (full) forcing variability is restricted to the equatorial band of 3◦S to 3◦N, whereas poleward of 7◦N/S the forcing is climato-logical, with a smooth transition from 3◦to 7◦latitude. Case NO EQ uses the opposite forcing configuration, i.e., interan-nual forcing poleward of 7◦latitude.
3 Mean circulation features
It appears useful to precede the discussion of the low-frequency variability with an inspection of the salient fea-tures of the mean subtropical-tropical circulation. Of par-ticular relevance in this regard is the representation in REF-05 and REF-025 of the equatorial current system and of the western boundary current regime. In Fig. 1, the zonally-integrated, long-term mean transports in 05 and REF-025 are depicted in two different ways. The transport streamfunctions computed in the vertical-meridional plane (Figs. 1a,b) exhibit the familiar signature of the subtropical-tropical overturning cells as discussed, e.g., in the review by Schott et al. (2004): poleward transport in the surface Ek-man layer, subduction in the subtropics, and equatorward flow in the thermocline, below about 50–70 m. The STCs are closed by equatorial upwelling, connecting the subduc-tion zones in the subtropics with the sea surface at the equa-tor. As pointed out by Hazeleger et al. (2001), the rele-vance of transport streamfunctions based on zonal integra-tions along fixed depth-levels is obscured near the equator where strong temporal variations in the depth of isopycnals occur: in particular, the so-called ”tropical cells” (Liu et al., 1994) between about 5◦S and 5◦N appear as artifacts of this integration and are not associated with diapycnal transports. The ventilation of the equatorial thermocline can thus more clearly be assessed by zonally-integrating the time-varying velocity field along the time-varying isopycnal surfaces, as depicted in Fig. 1c,d. Comparison with the streamfunction averaged along depth-coordinates confirms the strong devia-tion of the isopycnal average especially in the inner tropics, i.e., with respect to the presence of the tropical cells. The equatorward flow of the northern STC (henceforth, nSTC) spans the σ0− range of about 23.0 to 26.0, with maximum
meridional transports of about 16 Sv between 10–15◦N in both model cases. The main effect of the higher resolution is the increase in the vertical extent of the cell in that lati-tude range, with about 500 m in REF-025 compared to about 400 m in REF-05. The vertical range of the southern STC (sSTC) is not defined as clearly as the nSTC, since the north-ward flow in the Southern Hemisphere also involves sub-antarctic mode and intermediate waters partly extending far
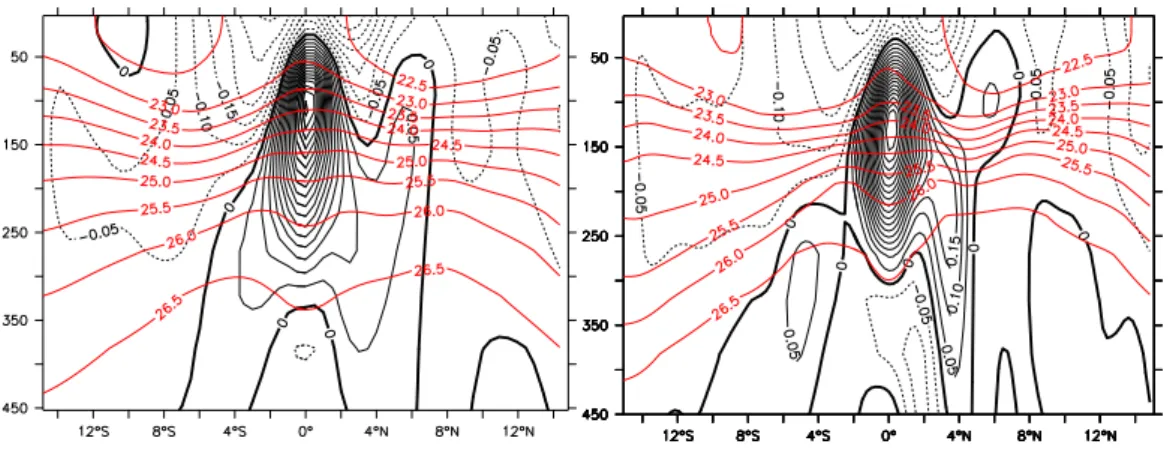
Fig. 2. Meridional section of the mean zonal velocity (in m/s) and density (sigma0) at 155◦W; positive values denote eastward velocities;
(a) REF-05 (b) REF-025.
Fig. 3. Velocity field, shown are annual mean current vectors averaged over the upper 500 m (in m/s, exp. REF-05); the colourbar displays
the speed while the vector lengths are strongly scaled to a maximum value.
into the Northern Hemisphere before eventually drawn into the equatorial upwelling regime. From Figs. 1 the equator-ward sSTC flow spans the isopycnal range of 23.5 to 26.8; maximum transports are found at 10–12◦S with 23–24 Sv for both model cases. The STC transports in the present model are somewhat higher than the values reported by CA for the NCAR model and by Hazeleger et al. (2001) for OCCAM,
consistent with the stronger wind stress of the CORE forc-ing used here. Comparison of the STC patterns between the 0.5◦- and 0.25◦-model versions reveals relatively little effects of model resolution on the maximum transports, but indi-cates a tendency toward some tightening of the thermocline in REF-025, i.e., the equatorward flow tending to be confined to a somewhat narrower density interval than in REF-05,
0.06 0.10 0.02 −0.05 0.05 0.1 0.05 0.1 0.25 0.1 0.25
Fig. 4. Meridional velocity mean for a section along 7◦S (off New Guinea) for (a) REF-2, (b) REF-05, (c) REF-025.
especially in the Northern Hemisphere. For an examination of the equatorial current system, Fig. 2 provides meridional sections of the mean zonal velocity at 155◦W for REF-05 and REF-025. In both cases the Equatorial Undercurrent (EUC) is centered around the equator with a core depth of about 120 m and a maximum velocity of 90 cm/s. The two branches of the South Equatorial Current (nSEC, sSEC) and the North Equatorial Current (NEC) are well represented, while the North Equatorial Counter Current (NECC) ap-pears weaker than observed. The EUC shoals from a core depth of 200 m near the western boundary to approximately 80 m at 110◦W (not shown) and spans the density range 22.5≤σ ≤26.5. This picture is in agreement with observa-tions by e.g. Wyrtki and Kilonsky (1984) and Johnson et al. (2002), except that in REF-05 the extension of the EUC is too deep and the Subsurface Countercurrents (also called “Tsuchiya Jets”, Tsuchiya, 1975) are missing. The Tsuchiya Jets are, however, present in REF-025. The Northern
Sub-surface Countercurrent (nSSCC), located around 4◦N with a maximum velocity of 20 cm/s is not completely separated from the EUC and NECC; the sSSCC is much weaker but discernible as a discrete current at 5◦S. Both currents pene-trate throughout the basin, slightly diverging towards the east as observed (Rowe et al., 2000). The more realistic structure of the equatorial current system in the high-resolution case is accompanied with an improved simulation of the mean EUC transport. The EUC transport in REF-05, calculated by inte-grating all eastward velocities >5 cm/s in the density range 22.5≤σ ≤26.0 between 3◦N and 3◦S, is rather large (34 Sv at 165◦E, 46 Sv at 155◦W and 28 Sv at 110◦W): since the Tsuchiya Jets are not resolved as individual current features in this simulation, their eastward transport becomes implic-itly included in the (broader) EUC. In REF-025 the trans-port is about 32 Sv at 165◦E, 38 Sv at 155◦W and 23 Sv at 110◦W which is closer to direct measurements in the cen-tral and eastern parts of the basin, e.g. the results of Johnson et al. (2002) of 17 Sv at 165◦E, 35 Sv at 155◦W and 26 Sv at 110◦W.
A major contribution to the zonally-integrated equatorward STC transport, and an important part of the low-frequency variability examined in the next section, is provided by the current system along the western boundary. The rich struc-ture of this system is illuminated in Fig. 3, depicting the annual mean flow field averaged over the upper 500 m in REF-05. In the Northern Hemisphere the NEC splits at the Philippine coast near 14◦N into the northwestward flowing Kuroshio and the southward flowing Mindanao Current (MC, e.g. Toole et al., 1990). The MC continues along the Philip-pine Islands and turns partly into the Indonesian Through-flow (ITF), represented in the model with a mean transport of about 16 Sv, and partly into the NECC and the EUC. In the Southern Hemisphere equatorward flow along the coast of New Guinea is by the New Guinea Coastal Undercurrent (NGCU, e.g. Butt and Lindstrom, 1994). After overshoot-ing the equator it retroflects southeastward, feedovershoot-ing the EUC (Tsuchiya et al., 1989). Whereas in the models of LF and CA the western boundary currents were too weak, both the MC and the NGCU appear well captured in REF-05 and REF-025, probably due to their improved zonal resolution. For a more quantitative examination of the effect of model resolution, Fig. 4 provides a comparative view of the WBC structure for a zonal section at 7◦S in REF-2, REF-05 and REF-025. There is a clear improvement in the representa-tion of the New Guinea Coastal Undercurrent (NGCU) go-ing from 2◦(which is similar to previous studies (e.g., CA) and rather typical for current climate studies) to 0.5◦zonal resolution. The current is located closer to the coast and di-vided into two main cores as observed (Butt and Lindstrom, 1994). The maximum meridional velocity is much higher, and the transport of the NGCU becomes more realistic: the mean transports of the western boundary currents in REF-05 for the density ranges 23.0≤σ ≤26.2 at 8◦N for the MC, and 24.0≤σ ≤26.7 at 6◦S for the NGCU are both 15 Sv, in
a
bd c
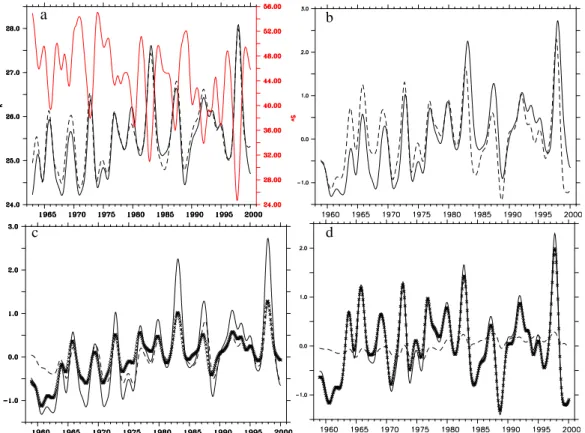
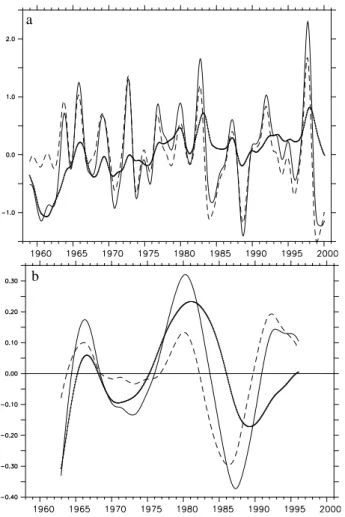
Fig. 5. Temperature variability averaged over the Ni˜no3 region, interannually filtered; (a) SST from reference experiment (REF-05, solid
line) and COADS observational data (dashed line), in relation to the EUC Transport at 155◦W (red); (b) comparison of SST (solid) and T80
(dashed) anomalies for REF-05; (c) SST anomalies for REF-05 (solid), compared to the response experiments WIND (crosses), and HEAT (dashed); (d) same as in (c) but for T80.
good agreement with Liu and Philander (2001) and Sloyan et al. (2003), respectively. In ORCA2 the currents are weaker with a transports of about 13 Sv (MC) and 9 Sv (NGCU). In contrast, further increase in resolution to 0.25◦ leads to in-creases in maximum velocities, but not to significant changes in transports.
4 Interannual – decadal variability
The low-frequency variability behaviour of the model so-lutions is diagnosed on the basis of monthly-mean output fields, smoothed either by a 23-point Hanning filter to re-move intraseasonal variability (in the following referred to as “interannual smoothing”), or on a 119-point (∼10 years) Hanning filter (“decadal smoothing”).
4.1 Equatorial near surface temperature (NST) and STC transport
We begin with an inspection of the equatorial near surface temperature (NST) variability, followed by assessing its rela-tion to wind-driven, equatorial and off-equatorial, changes in
the EUC, and in turn, the STC transports. As demonstrated by Fig. 5a, the SST as simulated in the reference experi-ment reproduces the observed variability (here taken from the COADS) in the Ni˜no3-region (150◦W to 90◦W, 5◦S to 5◦N), depicting the prominent temperature maxima associ-ated with the El Ni˜nos of 65/66, 72/73, 82/83, 91/92, and 97/98. A comparison between REF-05 and REF-025 (not shown) reveals only minor differences (i.e., the same phase, but a slightly higher amplitude of the SST variability in the high-resolution case); we shall thus focus our analysis on the sequence of experiments conducted with the ORCA05-configuration. The SST variability in the eastern equato-rial region appears closely related to the to the EUC trans-port variability: both time series are strongly anti-correlated (r=−0.91), emphasizing the key role of the eastward trans-port and upwelling of subtropical waters as discussed, e.g., by Sloyan et al. (2003) and explicitly demonstrated in the model study of Cheng et al. (2007). What is the relative im-portance for the equatorial temperature variability of changes in the wind-driven circulation, and what is the importance of atmospheric forcing within the equatorial regime vs. off-equatorial forcing variability, and thus, of a variability in
a
b
Fig. 6. Equatorial near-surface temperature (T80) anomalies
av-eraged over the Ni˜no3 region for REF (solid line), EQ (dashed line) and NO EQ (crossed line); (a) interannually, (b) decadally smoothed.
the STC transports? Addressing these questions in an ocean model using a bulk formulation for the turbulent heat flux has to account for the strong constraint on SST imposed by the damping toward prescribed atmospheric temperatures. In other words, although the EUC variability apparently respon-sible for the SST changes are primarily of dynamical origin, i.e., related to the variability in wind forcing, this impact can-not easily be separated from that of the local thermal forcing. This difficulty is illustrated in Fig. 5c by comparing the SST anomalies (deviations from the long-term mean temperature) as simulated in REF-05 with the result of the perturbation experiments WIND and HEAT: although the EUC transport variability in WIND is nearly the same as in REF-05 (Fig. 5), its impact on SST is weakened in this case by the damping toward climatological SST values; in contrast, in case HEAT some part of the interannual SST variability is captured even without any wind-driven EUC variability. In order to gain in-sight into the relative importance of dynamical factors, such
Sv T80 STC −12.00 K Sv STC T80
a
b
c
Fig. 7. Anomalies of the STC strength (a) for REF (solid line), EQ
(dashed line) and NO EQ (crossed line), interannually smoothed;
(b) for NO EQ (solid line) and of Ni˜no3 T80(dashed line),
interan-nually smoothed; (c) same as (b) but decadally smoothed.
as wind-driven changes in STC transports, we thus turn to an inspection of low-frequency temperature changes below the mixed layer, i.e., at 80 m depth (T80). Figure 5b and d
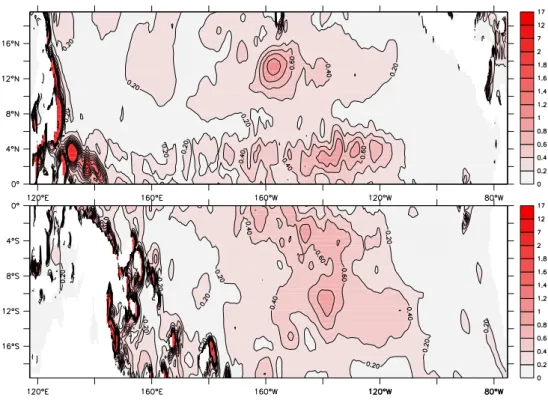
Fig. 8. Standard deviation of v′ ¯T in REF-05, integrated across the density range of the equatorward flow and decadally smoothed.
although being below the immediate influence of the local constraint imposed by the thermal boundary condition: in contrast to SST, the masking effect of the surface relaxation is now much weaker, and the variability can be identified as nearly completely attributable to the wind-driven circulation changes. Using the 80 m-temperature variability as a means to diagnose the effect of perturbations in wind-driven trans-port, we now re-visit the question of local vs. remote forcing effects, previously addressed in the study of Nonaka et al. (2002). The perturbation experiments EQ and NO-EQ seek to identify the role of interannual forcing variability within and outside the equatorial regime. A first look at the EUC transport time series in these experiments (not shown) reveals roughly equal contributions to the variance of interannual variability by the equatorial and the off-equatorial forcing (however, with strong variations in the ratio between the two components during the four decades of the integration); the transport anomalies in EQ and NO EQ add almost linearly to the transport anomalies of the reference experiment REF-05. Figure 6 shows time series of T80 anomalies averaged
over the Ni˜no3 region from the experiments REF-05, EQ and NO EQ, revealing a distinctive difference in the relative im-portance of off-equatorial forcing mechanisms between in-terannual and decadal time scales. At inin-terannual time scales the NST appears mainly driven by the equatorial forcing, al-though there are some minor in-phase variations also in the
NO EQ run. About 70% of the interannual variability of the reference experiment can be explained by equatorial forcing while the off-equatorial forcing accounts for around 30%. At decadal time scale the variations in the NO EQ experiment are of the same order as in the EQ run, consistent with the results of Nonaka et al. (2002). The ratio between equato-rial and off-equatoequato-rial influence changes to 50% : 50%. In order to investigate the role of changes in the equatorward transport of thermocline water on the equatorial temperature variability, i.e., the mechanism proposed by Kleeman et al. (1999), we define an index for the STC strength (following Lohmann and Latif, 2005), based on the sum of the trans-port maxima of the northern and southern cells in the lati-tude range 8◦–12◦(for the monthly time series of the model output). Figure 7a shows the interannual variability of that index for REF-05, as well as for the EQ and NO EQ ex-periments. In contrast to the behaviour of the tropical cells (TCs) discussed by Lohmann and Latif (2005), the STC vari-ability is mainly driven by off-equatorial forcing, closely re-lated (not shown) to the Ekman transports associated with the zonal wind stress variability at these latitudes. The relation between the STC transport variability and the near-surface equatorial temperature is examined in Fig. 7b and c. It in-dicates a similar difference for the role of the STC variabil-ity between interannual and decadal time scales as found for the equatorially and off-equatorially forced EUC transport
variability: while there is only a weak relation between in-terannual STC and NST changes (r= − 0.27) as well as be-tween STC and EUC anomalies (not shown), the wind-driven STC changes on decadal time scales appear clearly linked to the EUC and NST; the correlation between the decadally smoothed STC index and the Ni˜no3 T80 is r= − 0.92 in the
NO EQ experiment and almost that high in REF-05. This connection between STC, EUC and SST changes at decadal time scales was also shown by Cheng et al. (2007) who found the increase in the meridional volume transport convergence in the 1990s to be accompanied by a higher EUC transport and anomalous upwelling. The model solutions thus sug-gest that the part of the NST variability which was found to be associated with off-equatorial atmospheric forcing, espe-cially at decadal time scales, can be rationalized in terms of the variability in equatorward transport of subtropical ther-mocline waters with the subsurface STC branches which, in turn, are related to the variability in the off-equatorial trade winds.
4.2 Interior vs. WBC transport variability
As emphasized in the model study of CA, a quantitative as-sessment of the phase relationship between the equatorward transports of thermocline water and the equatorial variability requires a rather detailed examination of the different STC branches contributing to the zonally-integrated index. A dis-section of the temporal evolution of the three-dimensional current fields as provided by CA is not repeated here; how-ever, Fig. 8 provides a view in a complementary, statistical sense of the thermocline areas where the main contributions to the meridional transport variability is concentrated. The strongest signals are clearly found in a narrow band along the western boundary, reminiscent of the dominant role of the western boundary window in the mean STCs (as shown, e.g. in transport calculations by Huang and Liu, 1999). The interior variability signal is not spread across the longitudi-nal extent of the basin, but rather concentrated in wedges in the central Pacific, consistent with the accumulated trans-port integration by Cheng et al. (2007). The latitudinal dis-tribution of these patterns differs between the northern and Southern Hemisphere: while the southern variability signa-ture appears, at least partly, to extend from 15◦S to the equa-tor, this is not the case for the northern maximum associ-ated with the North Equatorial Current (NEC) at 12–14◦N. The structure of this signal is related to the existence of the potential vorticity ridge in the northern hemispheric tropics (Rothstein et al., 1997; Johnson and McPhaden, 1999) that prevents a direct pathway to the equator. Inspection of the model flow field in the thermocline, including the trajectories of particles (not shown here) confirms this interhemispheric difference, and demonstrates the more convoluted pathway, through the different zonal equatorial current bands, of the northern subtropical water, as described by Huang and Liu
(1999). What is the temporal evolution of the western bound-ary current system relative to the interior STC transport, i.e., does the eddy-permitting simulation also exhibit the anticor-relation noted in previous model studies? This question is addressed by examining the equatorward thermocline trans-ports separately for zonal averages west and east of 160◦E (Southern Hemisphere) and 145◦E (Northern Hemisphere); the separation longitudes are chosen so as to include possi-ble tight recirculation cells of the boundary currents and for correspondence with the interior ranges defined in the obser-vational study of MZ02. The zonally averaged transports for the interior (INT) and the boundary (WBC) are calculated by vertically integrating the meridional velocity from the ap-proximate depth of the Ekman layer (50 m) to the depth of the 26.8 (26.5) isopycnal in the Southern (Northern) Hemi-sphere. Our results show a rather similar WBC transport vari-ability in REF-05 and REF-025, but significant differences between these solutions and the coarse-resolution case REF-2; results will be presented here for REF-05. Figure 9 shows transport time series for the WBC and INT branches aver-aged between 6◦ and 10◦ latitude. In the long-term mean (1958–2000) all transport components are equatorward, with 14.8 Sv (14.1 Sv) for the WBC and 9.7 Sv (6.8 Sv) for INT in the southern (northern) hemisphere. The characteristics of the temporal evolution are different between the northern and Southern Hemisphere. For the southern STC, interior and boundary transports are anticorrelated both at interan-nual and decadal time scales: the linear correlation coeffi-cient is r=−0.92 for the interannually smoothed time series; and the multi-decadal decline of the STC strength discussed above is governed by the decline of INT and partly compen-sated by a rise in WBC, i.e., in the strength of the NGCU. In the Northern Hemisphere a different behaviour is found: whereas on interannual time scales a similar partial compen-sation (r=−0.72) between INT and WBC holds as for the southern STC, there is no such tendency for the long-term trend, in apparent contrast to the model results of LF and CA. An interesting aspect of the transport time series is that extrema (of opposite sign) of WBC and INT, in both hemi-spheres, tend to occur in El Ni˜no years (e.g., 1965/1966, 1982/1983, 1997/1998): more specifically, during an El Ni˜no event the equatorward pycnocline transports become stronger at the western boundary, and weaker in the interior. The oc-currence of equatorward transport extrema during El Ni˜no events has already been discussed with respect to heat trans-port anomalies by Zebiak (1989) and Springer et al. (1990).
The partial compensation of the INT and WBC tenden-cies has been explained in previous model studies in terms of the adjustment of the tropical gyre circulation to changes in the local wind stress curl. Important elements noted in the model analysis of CA were the large zonal coherency of the Ekman pumping variability, leading to an efficient gen-eration of baroclinic Rossby waves. These are manifested in zonally-extended anomalies in the pycnocline depth, and thus, in opposite zonal density gradients over the western and
Sv Sv
Fig. 9. Interannually smoothed net equatorward transport in the STC density range in REF-05 across (a) 6◦S to 10◦S and (b) 6◦N to 10◦N ; total transport (black) separated into transport at the western boundary (WBC, red) and in the interior basin (INT, green).
b a
Fig. 10. Linear trend as a function of latitude for (a) southern and (b) northern cell; total trend (black) separated into trend at the western
boundary (red) and in the interior basin (green).
eastern portions of the basin, with largest differences cen-tered in bands around 10◦S and 13◦N.
An inspection of the latitudinal dependence of the WBC and INT transports indicates, however, that time series eval-uated for single sections have to be interpreted with caution. This is demonstrated in Fig. 10 for the linear, multi-decadal trends of the STC transports and their components. As dis-cussed by CA for the transport changes between two partic-ular periods (1960–76 and 1977–97; cf. their Fig. 16), the trends for both the WBC and INT portions are most pro-nounced around 10◦S and fade toward the equator. The lat-itudinal band of strongest transport changes corresponds to the band of strongest changes in pycnocline depth, related to the largest anomalies in the local Ekman pumping (Capo-tondi et al., 2003). The present model solution indicates that the net decline in the total STC transport, generally of the same sign as INT, fades with increasing distance from the equator. This is related to a poleward increase in the de-gree of compensation between the changes in INT and WBC,
which in the Southern Hemisphere become most pronounced south of about 10◦S. The Northern Hemisphere exhibits a more complex latitudinal dependency of the STC variabil-ity, analogous to the more complex gyre patterns associated with the presence of the ITCZ in the latitude band of about 7◦–12◦N. Largest changes in the wind-driven pycnocline depth in the model study of CA was found around 13◦N, corresponding to strongest changes in both INT and WBC transports. Figure 10b shows that the transport changes for both components strongly decline toward the equator, with a change of sign for the WBC trend around 9◦N; accordingly, there is some (but less effective than in the Southern Hemi-sphere) compensation between INT and WBC only poleward of that latitude, while the (weaker) changes between 8◦– 9◦N and 4◦N are of the same sign. Equatorward of this, the WBC is affected by the Indonesian Throughflow and the retroflection of the New Guinea Undercurrent. It is inter-esting to note that the latitude ranges of strongest changes in the WBC and INT transports roughly coincide with the
Fig. 11. Streamfunction of the vertically integrated flow (in Sv, REF-05) averaged over the time period 1958 to 2000; contour interval 10 Sv,
positive (clockwise) contours are marked yellow. The red boxes indicate the transition regions between tropical and subtropical gyre used for zonal averaging in Fig. 12 (south: 7◦S to 20◦S, 168◦E to 178◦E; north: 7◦N to 20◦N, 128◦E to 138◦E).
poleward boundaries of the tropical gyres. The mean stream-function (Fig. 11) shows the transition between the tropi-cal and subtropitropi-cal gyres in the western part of the northern (southern) hemisphere at 10◦–13◦N (8◦–12◦S), correspond-ing to the mean bifurcation latitudes of the North (South) Equatorial currents as discussed in Sect. 3 (cf. Fig. 3). The discussion of the oceanic adjustment to changes in the wind stress curl as given by CA focused on the changes in the in-tensity of these horizontal gyre patterns. Another aspect of the response behaviour unveiled by the present solution is, however, a variation in the latitude of the gyre boundaries (Fig. 12): in particular, comparison of the gyre transports be-tween El Ni˜no and La Nina phases exhibit little changes in maximum gyre transports, but considerable changes in the poleward extension of the gyres in the western part of the ocean basin; specifically, the bifurcation latitudes between poleward and equatorward flows at the western boundary vary by 3.5◦(2.5◦) for the northern (southern) tropical gyre, with a poleward shift during El Ni˜no phases. A variation in the northern bifurcation latitudes and its implications have previously been discussed by Kim et al. (2004) in a high res-olution ocean model study, noting an increase in the flow of NEC water into the MC during El Ni˜no years when the bifur-cation was found to shift to a more northerly position. The expansion and contraction of the poleward extent of the tropi-cal gyres readily implies that over certain latitude bands, even
without a change in the maximum gyre transports, a varia-tion in the transport of the western boundary currents has to be accompanied by opposite changes in interior meridional transports. More generally, the behaviour suggests an addi-tional aspect of the oceanic adjustment to variable Ekman pumping, which appears to be relevant for the conspicuous compensation between wbc and interior transport changes: it offers a simple rationale for the strong, non-lagged anti-correlation noted here and in previous model studies, as well as for the poleward increase in the individual components. What may be additionally attributed to this feature, is that the highest anticorrelations between WBC and INTERIOR transports are located in the latitude ranges most strongly af-fected by a wobbling of the tropical gyres, i.e., in the tran-sition region between the tropical and subtropical gyres: ac-cordingly, correlation values (with zero lag) on interannual time scales (i.e., based on detrended, interannually filtered, monthly time series) as depicted in Fig. 13 show a high de-gree of anticorrelation poleward of about 6◦–8◦latitude, but gradually decrease toward the equator in both hemispheres. Similar changes in the poleward gyre extent also appear as a characteristic of the decadal variability. Comparison of the barotropic stream functions for the decades 1961–1970 and 1981–1990 (Fig. 12) shows relatively weak differences in the Northern Hemisphere, but exhibits a prominent shift-ing from the first to the second period to the south of the
(a)
(b)
(c)
(d)
Fig. 12. Streamfunction in the transition regime between the tropical and subtropical gyres in the western Pacific, zonally-averaged over
the boxes indicated in Fig. 11, black: mean over years 1958–2000; (a) and (c) red: El Ni˜no phases (June to March 1972/1973, 1982/1983, 1997/1998 average), blue: La Ni˜na phases (June to March 1970/1971, 1973/1974, 1988/1989 average); (b) and (d) red: 1981 to 1990 average, blue: 1961 to 2000 average
bifurcation latitude of the SEC in the Southern Hemisphere, consistent with the increasing NGCU and decreasing interior transports noted above. These patterns, and their similarity to the behaviour on interannual time scales, suggest that the compensatory character of meridional transport changes at the boundary and in the interior may be rationalized in terms of an oceanic adjustment to variable wind forcing involving a wobbling of the poleward extent of the tropical gyres and concomitant changes in the bifurcation latitudes of the NEC and SEC flows.
5 Summary and discussion
In this study the question of remotely forced contributions to the temperature variability in the equatorial Pacific, i.e. the possible role of low-frequency changes in the transport of the STCs, was addressed in model simulations utilizing different implementations of the global ORCA-LIM model, forced by recently developed atmospheric forcing fields based on mod-ified reanalysis products for the period 1958 to 2000. Our sequence of experiments included model versions with
horizontal meshes varying from coarse, non-eddy resolving (2◦ and 0.5◦) to eddy-permitting (0.25◦), the latter permit-ting a much improved representation of both the zonal equa-torial current structure (e.g., with an emergence of Tsuchiya Jets) and of the western boundary currents (where signifi-cant changes occurred between the 2◦and 0.5◦simulations, but comparatively minor ones between 0.5◦and 0.25◦). In contrast to the resolution dependencies of the mean current structures and transports, the model solutions revealed rel-atively little sensitivity of the low-frequency variability in equatorial SST; more specifically, both the 0.5◦- and 0.25◦ -simulations closely reproduced the observed SST variabil-ity in the Ni˜no3-region. Further investigation of the mecha-nisms involved in this variability was thus based mainly on two sets of 0.5◦-experiments with different, artificial pertur-bations in the atmospheric forcing: one set aiming at an iso-lation of the effect of wind-driven circuiso-lation changes; the other set re-visiting the issue of the relative contributions of equatorial vs. off-equatorial (i.e., equatorward and poleward of about 5◦N/S) atmospheric forcing. The solutions con-firmed previous model suggestions of a significant influence
2 3 4 5 6 7 8 9 10 11 12 −1 −0.8 −0.6 −0.4 −0.2 0 0.2 degrees latitude correlation coefficient southern hem. northern hem.
Fig. 13. Correlation between transport anomalies at the western
boundary and in the interior on interannual time scales as a function of latitude.
of off-equatorial, wind driven changes on the low-frequency, near surface temperature variability in the equatorial Pacific. Particular findings are:
– interannual-decadal equatorial temperature variability is tightly related to the EUC transport, and nearly com-pletely explained as an effect of wind-driven changes in the tropical circulation;
– the variability at interannual (ENSO) time scales is pre-dominantly governed by near-equatorial wind forcing, whereas a significant part of the variability on decadal time scales (i.e., about 50% of the variance over the in-tegration period) is related to off-equatorial forcing, and thus, to changes in the equatorward transport of subtrop-ical thermocline water as characterized by the strength of the Northern and Southern Hemisphere STCs; – the net changes in STC transport involve much larger
changes in the interior and WBC transports, which par-tially compensate each other at both decadal and in-terannual time scales in the Southern Hemisphere and at interannual time scales in the Northern Hemisphere, with transport extrema (i.e., maximum equatorward thermocline transport in the interior) coinciding with El Ni˜no episodes.
The interpretation of variability features obtained from ocean model simulations subject to a prescribed atmospheric state has to account for at least two issues: the effect of compromising potentially important feedback mechanisms in air-sea interaction, and possible errors in the prescribed atmospheric fields. With respect to the former, the main choice for ocean modelling studies has been the use of
bulk formulations for the sensible and latent air-sea heat fluxes (including the use of linearized expressions, such as proposed by Barnier et al., 1995 or, originally, by Haney, 1971). An alternative for modelling studies specifically of the ocean’s response to variable wind stresses (for example, Hazeleger et al., 2004) has been coupling to an atmospheric mixed-layer model. The present forcing configuration involves a rather comprehensive bulk formulation for the thermal forcing, following recent design considerations for ”Coordinated Ocean-ice Reference Experiments” (CORE, Griffies et al., 2007), using atmospheric state data developed by Large and Yeager (2004) based on adjusted NCEP/NCAR reanalysis products (see also Large, 2007). As in the model studies of CA and Cheng et al. (2007) this implies a damping of SST toward given values, so that SST effectively becomes a diagnostic rather than prognostic variable, rendering it rather useless for diagnosing effects of ocean dynamics. In order to identify, at least qualitatively, dynamical influences on SST, Nonaka et al. (2002) chose a climatological thermal forcing (i.e.,a restoring of SST to monthly-mean values), al-lowing interannual SST changes only to be generated (albeit damped) by either equatorial or off-equatorial wind-forced changes in the upper-layer circulation.
In the present study we chose an alternative approach, by not considering the variability of SST, but of the temperature below the mixed layer (at 80 m depth): in the reference experiments with interannual variability in both thermal and wind forcing, this near-surface temperature (NST) closely followed the SST variability; however, compared to the SST, the NST was found much less constrained by the local thermal forcing, thus allowing to diagnose effects of wind-driven transport variability. The presence of a significant effect on decadal NST variability by lateral transport changes associated with the strength of the STCs is complementary to previous model results: to the study of Nonaka et al. (2002) who showed a response of equatorial SST to decadal STC variability forced by off-equatorial trade wind variations (against the damping of the local (in their case, climatological) heat fluxes); and to the study of Cheng et al. (2007) who demonstrated the leading role of an increasing STC strength for the cooling of the equatorial Pacific after the mid-1990s, against the heating effect of the surface heat flux anomalies during that period.
With respect to possible biases in the atmospheric state data the main concern, in a study of forced tropical variability, has to be the accuracy of surface wind products and computation of wind stress. The CORE forcing involves a correction of known biases in NCEP winds using adjustments derived from comparison with satellite vector winds from QSCAT (Large and Yeager, 2004). A potential problem not affected by that correction is the presence of artificial trends in the wind fields: comparison by Alory et al. (2005) of an (ORCA2-) model simulation with sea level data revealed a spurious trend in the Pacific trade winds before the mid-1970s, implying that the simulated decline in the
STC strength during that period involves a strong artificial component. This was also demonstrated by Schott et al. (2007) who showed that the large decreasing trends in the tropical Ekman divergence resulting from NCEP/NCAR wind stresses as well as in the interior STC transport con-vergence are significantly reduced in GECCO assimilation results which involved an adjustment of wind stress as a key part of the minimization of model – data misfits. According to these studies the absolute trends in STC strength compo-nents, obtained in the present model solution, of −14.5 Sv (−3.5 Sv) in the interior and +9.5 Sv (−2.5 Sv) at the western boundary for the southern (northern) cell are likely to be overestimated. Irrespective of possible biases in the quan-titative simulation of multi-decadal changes in the tropical circulation, especially during periods before the mid-1970s, the present sequence of ocean model experiments provides a viable basis for elucidating the mechanisms governing this variability. This holds in particular for the conspicuous partial compensation of equatorward thermocline transport changes in the ocean interior and western boundary currents which has repeatedly been noted in previous studies and is replicated in the present simulations. Within the southern cell the interior and WBC transport changes are anticor-related at decadal as well as at interannual (and even, not examined further in this study, seasonal) time scales, while there is no decadal compensation within the northern cell. Additionally, in contrast to the total STC transport, the WBC and interior transport variations are found to be correlated with ENSO: during an El Ni˜no event, when the transport of the EUC is weak due to the relaxation of the trade winds, the equatorward transport within the STCs is stronger at the western boundary, but weaker in the interior. This indicates that while the time-mean transport is concentrated in the WBC, the variability of the interior transport may be more important in determining the EUC transport, and thus, the eastern equatorial NST variations. Previous explanations for the anticorrelation between WBC and interior transport changes involved the spinning up and down of the tropical gyre circulation in response to variations in wind stress curl (LF) and the adjustment of the ocean by westward propagating Rossby waves (CA). Our analysis suggests that a wind-driven variability in the tropical gyres may lead to op-posite tendencies in WBC and interior transports not only by a change in maximum gyre transport, but also by a variation in the poleward extent of the gyres: the latter phenomenon provides the main rationale for the tight anti-correlation on both interannual (ENSO) and (in the Southern Hemisphere) on multi-decadal time scales in the present model simulation.
Edited by: B. Barnier
References
Adcroft, A., Hill, C., and Marshall, J.: Representation of topogra-phy by shaved cells in a height coordinate ocean model, Mon. Weather Rev., 125, 2293–2315, 1997.
Alory, G., Cravatte, S., Izumo, T., and Rodgers, K. B.: Validation of a decadal OGCM simulation for the tropical pacific, Ocean Model., 10, 272–282, 2005.
Barnier, B., Siefridt, L., and Marchesiello, P.: Thermal forcing for a global ocean circulation model using a three-year climatology of ECMWF analyses, J. Marine Syst., 6(4), 363–380, 1995. Barnier, B., Madec, G., Penduff, T., Molines, J.-M., Treguier,
A.-M., Beckmann, A., Biastoch, A., B¨oning, C., Dengg, J., Gulev, S. Le Sommer, J., Remy, E., Talandier, C., Theetten, S., and Maltrud, M.: Impact of partial steps and momentum advection schemes in a global ocean circulation model at eddy permitting resolution, Ocean Dynam., 56(5–6), 543–567, 2006.
Blanke, B. and Delecluse, P.: Variability of the tropical Atlantic ocean simulated by a general circulation model with two dif-ferent mixed layer physics, J. Phys. Oceanogr., 23, 1363–1388, 1993.
Butt, J. and Lindstrom, E.: Currents off east coast of New Ireland, Papua-New Guinea and their relevance to regional undercurrents in the western equatorial Pacific Ocean, J. Geophys. Res., 99, 12 503–12 514, 1994.
Capotondi, A. and Deser, C.: Why are there Rossby wave maxima in the Pacific at 10◦S and 13◦N?, J. Phys. Oceanogr., 33, 1549– 1563, 2003.
Capotondi, A., Alexander, M. A., Deser, C., and McPhaden, M. J.: Anatomy and Decadal Evolution of the Pacific Subtropical-Tropical Cells (STCs), J. Climate, 18(18), 3739–3758, 2005. Chang, P., Yamagata, T., Schopf, P., Behera, S. K., Carton, J.,
Kessler, W. S., Meyers, G., Qu, T., Schott, F., Shetye, S., and Xie, S. P.: Climate Fluctuations of Tropical Coupled Systems – The Role of Ocean Dynamics, J. Climate, 19, 5122–5174, 2006. Cheng, W., McPhaden, M. J., Zhang, D., and Metzger, E. J.: Re-cent Changes in the Pacific Subtropical Cells Inferred from an Eddy-Resolving Ocean Circulation Model, J. Phys. Oceanogr., 37, 1340–1356, 2007.
Fichefet, T. and Morales-Marqueda, M. A.: Sensitivity of a global sea ice model to the treatment of ice thermodynamics and dy-namics, J. Geophys. Res., 102, 12 609–12 646, 1997.
Gent, P. R. and McWilliams, J.: Isopycnal mixing in ocean circula-tion models, J. Phys. Oceanogr., 20, 150–156, 1990.
Griffies, S., B¨oning, C. W., and Treguier, A. M.: Design Con-siderations for Coordinated Ocean-Ice Reference Experiments, WGSF/WCRP Flux News, 3, 3–5, 2007.
Haney, R. L.: Surface Thermal Boundary Condition for Ocean Cir-culation Models, J. Phys. Oceanogr., 1(4), 241–248, 1971. Hazeleger, W., de Vries, P., and van Oldenbourgh, G. J.: Do
tropi-cal cells ventilate the Indo-Pacific equatorial thermocline?, Geo-phys. Res. Lett., 28(9), 1763–1766, 2001.
Hazeleger, W., Seager, R., Cane, M., and Naik, N. H.: How can tropical Pacific ocean heat transport vary?, J. Phys. Oceanogr., 34, 320–333, 2004.
Huang, B. and Liu, Z.: Pacific subtropical–tropical thermocline wa-ter exchange in the National Cenwa-ters for Environmental Predic-tion ocean model, J. Geophys. Res., 104 (C5), 11 065–11 076, 1999.
Flow from the Subtropical to the Equatorial Pacific Ocean, J. Phys. Oceanogr., 29(12), 3073–3089, 1999.
Johnson, G. C., Sloyan, B. M., Kessler, W. S., and McTag-gert, K. E.: Direct measurements of upper ocean currents and water properties across the tropical pacific during the 1990s, Progr. Oceanogr., 52, 31–61, 2002.
Kim, Y. Y., Qu, T., Jensen, T., Miyahima, T., Mitsudera, H., Wang, H.-W., and Ishida, A.: Seasonal and interan-nual variations of the North Equatorial Current bifurcation in a high-resolution OGCM, J. Geophys. Res., 109, C03040, doi:10.1029/2003JC002013, 2004.
Kleeman, R., McCreary, J. P., and Klinger, B. A.: A mechanism for generating ENSO decadal variability, Geophys. Res. Lett., 26(12), 1743–1746, 1999.
Large, W. and Yeager, S.: Diurnal to decadal global forcing for ocean and sea-ice models: the data sets and flux climatologies, NCAR Technical Note: NCAR/TN–460+STR, CGD Division of the National Center for Atmospheric Research, 2004.
Large, W. G.: Core Forcing for Coupled Ocean and Sea – Ice Mod-els, WGSF/WCRP Flux News, 3, 2–3, 2007.
Lee, T. and Fukumori, I.: Interannual-to-decadal variations of the tropical-subtropical exchange in the Pacific Ocean: Boundary versus interior pycnocline transports, J. Climate, 16, 4022–4042, 2003.
Levitus, S., Boyer, T. P., Conkright, M. E., O’Brian, T., Antonov, J., Stephens, C., Stathopolos, L., Johnson, D., and Gelfeld, R.: World Ocean Database 1998, NOAA Atlas NESDID, 18, 1998. Liu, Z. and Philander, G.: Tropical-extratropical oceanic exchange
pathways, in: Ocean Circulation and Climate: Observing and Modeling the Global Ocean, edited by: Siedler, G., Church, J., and Gould, J., 247–257, Academic Press, 2001.
Liu, Z., Philander, S. G. H., and Pacanowski, R. C.: A GCM Study of Tropical-Subtropical Upper-Ocean Water Exchange, J. Phys. Oceanogr., 24, 2606–2623, 1994.
Lohmann, K. and Latif, M.: Tropical Pacific Decadal Variability and the Subtropical-Tropical Cells, J. Climate, 18, 5136–5178, 2005.
Madec, G. and Imbard, M.: A global ocean mesh to overcome the North Pole singularity, Clim. Dyn., 12, 381–388, 1996. Madec, G., Delecluse, P., Imbard, M., and Levy, C.: OPA 8.1
general circulation model reference manual, Notes de l’IPSL, Universit ´e P. et M. Curie, B102 T15-E5, 4 place Jussieu, Paris cedex 5, N◦S 11, 91 p., 1998.
McCreary, J. P. and Lu, P.: Interaction between the Subtropi-cal and Equatorial Ocean Circulations: The SubtropiSubtropi-cal Cell, J. Phys. Oceanogr., 24, 466–496, 1994.
McPhaden, M. J. and Zhang, D.: Slowdown of the meridional over-turning circulation in the upper Pacific Ocean, Nature, 415, 603– 608, 2002.
McPhaden, M. J. and Zhang, D.: Pacific Ocean cir-culation rebounds, Geophys. Res. Lett., 31, L18301, doi:10.1029/2004GL020727, 2004.
Nonaka, M., Xie, S.-P., and McCreary, J.: Decadal variations in the Subtropical Cells and equatorial Pacific SST, Geo-phys. Res. Lett., 29(7), 20–1–20–3, 2002.
Rothstein, L. M., Zhang, R.-H., Busalacchi, A., and Chen, D.: A Numerical Simulation of the Mean Water Pathways in the Sub-tropical and Tropical Pacific Ocean, J. Phys. Oceanogr., 28(2), 322–343, 1997.
Rowe, G. D., Firing, E., and Johnson, G. C.: Pacific Equatorial Sub-surface Countercurrent Velocity, Transport, and Potential Vortic-ity, J. Phys. Oceanogr., 30, 1172–1187, 2000.
Schott, F., Wang, W., and Stammer, D.: Variability of Pa-cific subtrobical cells in the 50-year ECCO assimilation, Geo-phys. Res. Lett., 34, L05604, 2007.
Schott, F. A., McCreary, J. P., and Johnson, G.: Shallow overturning circulation of the tropical-subtropical oceans, in: Earth Climate: The Ocean-Atmoshere Interaction, edited by: Wang, C., Xie, S.-P., and Carton, J. A., 261–304, American Geophysical Union, 2004.
Sloyan, B. M., Johnson, G. C., and Kessler, W. S.: The Pa-cific Cold Tongue: A Pathway for Interhemisheric Exchange, J. Phys. Oceanogr., 33(5), 1027–1043, 2003.
Smith, S. R., Legler, D. M., and Verzone, K. V.: Quantifying Uncer-tainties in NCEP Reanalysis Using High-Quality Research Ves-sel Observations, J. Climate, 14, 4062–4072, 2001.
Springer, S. R., McPhaden, M. J., and Busalacchi, A. J.: Oceanic Heat Content Variability in the Tropical Pacific During the 1982 –1983 El Ni˜no , J. Geophys. Res., 95, 22 089–22 101, 1990. Steele, M., Morley, R., and Ermold, W.: PHC: A Global Ocean
Hy-drography with a High-Quality Arctic Ocean, J. Climate, 14(9), 2079–2087, 2001.
Toole, J. M., Millard, R. C., Wang, Z., and Pu, S.: Observations of the Pacific North Equatorial Current bifurcation at the Philippine coast, J. Phys. Oceanogr., 20, 307–318, 1990.
Tsuchiya, M.: Subsurface countercurrents in the eastern equatorial Pacific Ocean, J. Marine Res., 33, 145–175, 1975.
Tsuchiya, M., Lukas, R., Fine, R., Firing, E., and Lindstrom, E.: Source waters of the Pacific Equatorial Undercurrent, Progr. Oceanogr., 23, 101–147, 1989.
Wyrtki, K. and Kilonsky, B.: Mean water and current structure dur-ing the Hawaii-to-Tahiti Shuttle Experiment, J. Phys. Oceanogr., 14, 242–254, 1984.
Zebiak,S. E.: Oceanic heat content variability and El Ni˜no cycles, J. Phys. Oceanogr., 19, 475–486, 1989.