Static and dynamic validation
S. Paeme*, A. Pironet*, J.G. Chase**, B. Lambermont*, P. Kolh*, P. Lancellotti*, P.C. Dauby*, T.Desaive*
* Cardiovascular Research Center, University of Liege, Liege, Belgium
** Department of Mechanical Engineering, University of Canterbury, Christchurch, New Zealand
Abstract: A minimal cardiovascular system (CVS) model including mitral valve dynamics has been previously validated in silico. It accounts for valve dynamics using a second order differential equation to simulate the physiological opening valve law. This second order equation is based on output heart signals and is very difficult to match its anatomical or physiological parameters, making this model difficult to interpret and to particularise to pathological situations.
In contrast, a simple non-linear rotational spring model of the motion of the mitral valve, located between the left atrium and ventricle, has been validated. A measured pressure difference curve was the model input, which provides an applied torque to the valve chords. Various damping and hysteresis states were investigated to find a model that best matches reported animal data of chord movement during a heartbeat. This model is based on simple physiological behavior modeling, defining parameters that are directly linked with physiological or anatomical data, and is thus more physiologically relevant.
This research describes a new closed-loop CVS model integrating the simple non-linear rotational spring model. This new model is shown to fit the static and dynamic heart behaviour observed, as an initial validation of its relevance in a larger CVS model.
Keywords: cardiovascular system model, valve dynamics, mitral valve, cardiac cycle
1. INTRODUCTION
Mathematical models of the cardiovascular system (CVS) vary significantly in complexity and objectives. They range from simple Windkessel models (Burkhoff et al., 1988) to complex network models (Shim et al., 2008) and finite element models (Kerckhoffs et al., 2007).
This research improves a “minimal cardiac model” of the CVS (Smith et al., 2004) by adding a detailed mitral cardiac valve model. This model is based on a “pressure-volume” (PV) lumped element approach. It divides the CVS in several chambers described by PV relationships. This method requires limited parameters, allowing easy and rapid simulation for patient- specific identification of disease state at the bedside (Desaive et al., 2007). The mitral valve model eliminates simpler Heaviside formulations (Paeme et al., 2011).
This research focuses on improving the minimal CVS with a simple cardiac valve model to obtain a CVS model that better matches the reality and is easy to interpret. The valve model is a simple non-linear rotational spring. It has been validated on a published dataset.
This work was supported by the F.R.I.A. (Belgium), the University of Canterbury and the French Community of Belgium (Actions de Recherches Concertées Académie Wallonie-Europe)
This model is based on simple physiological behavior modeling, defining parameters directly linked with physiological or anatomical data (Moorhead et al., 2011). This new combined multi-scale model is validated by its ability to fit static and dynamic heart behaviour.
2. METHODS
2.1 The cardiovascular system model (CVS)
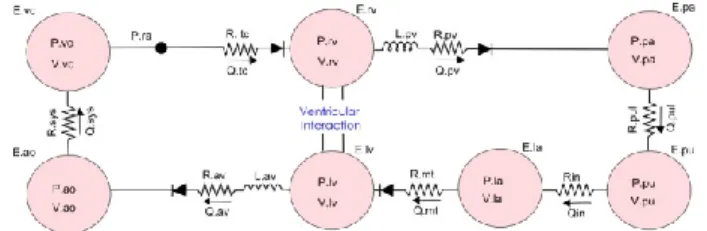
The CVS model has seven elastic chambers for the left and right ventricles, the left atrium, the vena cava, the aorta, the pulmonary artery and veins (Figure 1).
Figure 1: CVS model made up of 7 elastic chambers and 4 "open on pressure close on flow" law valves
First described without the atrium by Smith et al (Smith et al., 2004), it has been validated in silico and in several animal model studies (Smith et al., 2005, Starfinger et al., 2007, Starfinger et al., 2008b, Starfinger et al., 2008a, Paeme et al., 2011). Resistances (R), inductors (L) and diodes model the
resistance of the flows through the arteries, the effects of inertia, and the cardiac valves.
The cardiac chambers are modeled using pressure-volume (PV) relationships. To account for myocardial activation, a time-varying elastance driving function is used over a single heartbeat, defined:
(1)
Three differential equations describe the rate of change of the cardiac chamber volume, and the inflow (Qin) and outflow (Qout) for each chamber:
(2) (3) (4)
where Pup, Pdown and P are the upstream, downstream and chamber pressures, Lout and Lin respectively the outer and inner inductors, and Rout and Rin the outer and inner resistances. These equations are valid for all seven chambers. The initial CVS model assumes the 4 cardiac valves only exist in two different states: open or closed (Smith et al., 2004). A Heaviside formulation is used to capture valve status, as “open on pressure, close on flow” (Smith et al., 2004, Hann et al., 2005).
2.2 The mitral valve model
The drawback of the Heaviside formulation is that it does not take into account the physiological time scale of the valve aperture (Saito et al., 2006). Therefore, the CVS model is not able to fully capture valve dysfunction, which has important clinical implications.
This research uses a simple dynamic model of the stiffness of the valve leaflets to characterize the fundamental effects on flow and pressure. The valve is treated as a non-linear rotational spring or a hinge with the change in angle under pressure driven flow being related to the stiffness and damping of the valve defined (Moorhead et al., 2011).
(5)
where is the valve opening angle, c is the damping coefficient due to the blood surrounding the leaflets, FK(θ) is
the non-linear restoring force, is the transmitral pressure, and α is a torque constant converting differential pressure into an input torque on the valve.
2.3 Coupling both models
Based on the expression of the resistance in a cylindrical flow, the mitral resistance is modified to be a function of the mitral aperture:
(6)
In the same way, we adapt the expression of the inertance:
(7)
Where represents blood density, represents the blood column length through the mitral valve and the blood viscosity.
The variation of the mitral flow Qmt is also updated to take into account the variation of the mitral aperture:
(8)
This approach introduces the mitral valve opening area A, related to the new state variable, , the opening valve angle. The cross section is assumed circular:
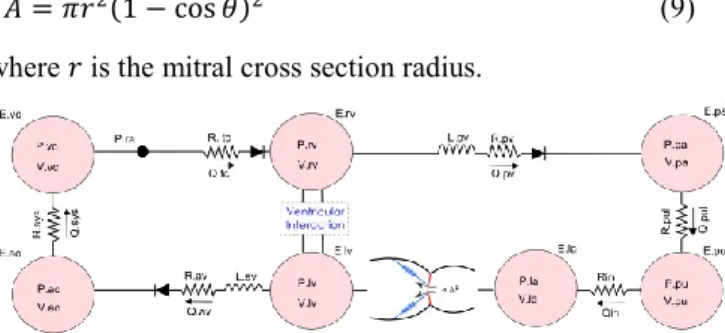
(9)
where is the mitral cross section radius.
Figure 2: CVS model made up of 7 elastic chambers and the non-linear rotational spring model of the mitral valve We simulate the model (Figure 2) with Matlab (The MathWorks, USA) and solve the system of ordinary differential equations with the ode45 routine.
3. RESULTS
3.1 Static response validation
The model should be capable of simulating a variety of basic CVS trends in a physiologically accurate manner. Figure 3 plots the steady state left and right ventricle pressure and volume evolution for the closed loop model. This plot can be compared with the Wiggers diagram (Guyton, 1991). The model is seen to capture the major CVS dynamics including variations in left ventricle pressure, aortic pressure and ventricle volume
Figure 3: hemodynamic static response of the simulated CVS model – Pressure evolution in the left and right heart – Volume evolution in the left and right ventricle Normal motion of the mitral valve during a cardiac cycle has been analyzed by Saito et al. (Saito et al., 2006). From this qualitative analysis and quantitative values from literature (Mynard et al., 2011, Szabó et al., 2004, Flewitt et al., 2007, Bowman et al., 2004, Courtois et al., 1988, Nelson et al., 2010), normal mitral aperture evolution and transmitral blood flow during diastole has been reconstructed. Figure 4 describes the two E-wave and A-wave peaks corresponding to the passive and active filling of the ventricle, due to atrial contraction. Between these peaks, the driving force of the blood, the pressure difference between both parts of the valve, cancels out. This time period is named diastasis.
Figure 4: Physiological evolution of the transmitral blood flow and the mitral valve opening area during the opening period of the mitral valve (HR=60/min)
Figure 5 plots the evolution of the transmitral blood flow and the evolution of the mitral valve aperture area. Comparing to Figure 4, the model is seen to capture the complex opening and closing dynamic behavior of the mitral valve with the 3 periods during the opening phase. Although the parameters of the model are adjusted to correspond to a trend and not by fitting the output model signals to a single set of data, the trends all match.
Figure 5: hemodynamic static response of the simulated CVS model - evolution of the transmitral blood flow - evolution of the mitral valve opening area
Since the ultimate goal is simulation of human heart function, particularly in response to changes in therapy, tests to validate simple trends are carried out comparing model outputs with known physiological trends. Figure 6 shows the effect of varying ventricle contractility, a measure of cardiac pump function (Kass and Maughan, 1988). Contractility is varied in the model by changing the end systolic elastance (Ees) (Burkhoff and Tyberg, 1993). Typically, an increase in contractility results in an increase in cardiac output, which correlates with an increase in stroke volume (SV), assuming heart rate remains constant. Figure 6 plots a PV diagram for 3 different contractilities showing the desired increase in stroke volume as contractility increases.
Figure 6: Effect on left and right pressure-volume loops of changes of contractility
Figure 7: Effect on left and right pressure-volume loops of changes of the systemic resistance
A second test shows the effect of changing the systemic circulatory resistance. Clinical data shows that an acute increase in resistance results in reduced cardiac output that varies with the magnitude of the change (Slinker and Glantz, 1989). Figure 7 shows the closed loop model output, as systemic resistance is increased, and decreased. As systemic resistance decreases, stroke volume increases, meaning an increase in cardiac output. The opposite trend occurs as the resistance is increased.
Figure 8 shows the rise in pressure in the aorta as a result of increased peripheral resistance and the resulting decreased
cardiac output (CO), which illustrates the increase in blood pressure (BP) often seen in patients with narrowed or blocked arteries, and the resulting increased systemic resistance. Hence, both figures illustrate that the model captures well-known, basic clinical behavior in response to changes in systemic resistance.
Figure 8: Response of aortic pressure in response to changes in systemic resistance
Figure 9: Change in stroke volume and PV diagram for a change in thoracic pressure
Finally, the average thoracic cavity pressure in humans is normally about -2mmHg, however if this pressure is increased, as occurs during positive pressure mechanical ventilation, cardiac output is decreased (Guyton, 1991). As shown in Figure 9, the model is capable of simulating the effect of this common intervention.
3.2 Dynamic response validation
The multi-scale CVS model presented has been shown to simulate the static response of the cardiovascular system to changes in state, but the transient dynamic response has not yet been verified. This dynamic response verification focuses on ventricular interactions which are important CVS interactions that contribute significantly to CVS dynamics (Weber et al., 1982). More understanding of the physiological interactions will improve the capability to diagnose and treat CVS dysfunction.
Slinker and Glantz (Slinker and Glantz, 1989) analyzed the transient effects of both direct and series ventricular interaction on CVS dynamics. This research was also carried out on anaesthetized dogs, but the heart remained connected to the circulation system, thus including series interaction between ventricles. This approach takes advantage of the time lag between direct and series interaction when investigating the effect of changing right ventricle state on left ventricle function.
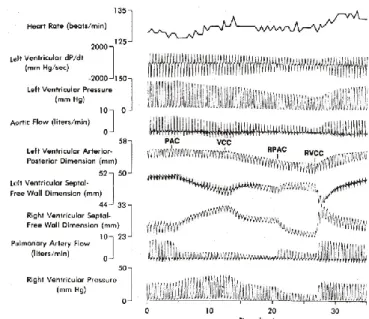
Figure 10: Hemodynamic CVS responses to sequential constrictions and releases of the pulmonary artery and vena-cava (Slinker and Glantz, 1989)
To verify that the minimal model captures the experimental dynamics, in spite of the lack of specific information, the model parameters used in Section 3.1 for the static trend verification are used. The heart rate is changed to 130 beats per minute to match the experiments and the pericardium effects are removed by setting the elastance to a negligible value (P0,pcd = 10−6). The pulmonary artery constriction is simulated by increasing the pulmonary valve resistance (Rpv) by a factor of 20. Similarly, the vena-cava constriction is simulated by increasing the tricuspid valve resistance (Rtc) by a factor of 4. These factors for varying the resistances were found by trial and error to approximately match the performance magnitudes of the data in (Slinker and Glantz, 1989). Figure 10 shows the main results obtained by Slinker and Glantz (Slinker and Glantz, 1989). The experiment shown involved constricting the pulmonary artery after about 4 seconds (PAC) followed by vena-cava constriction after about 12 seconds (VCC). At 20 seconds the constriction on the pulmonary artery is released and after about 27 seconds the vena-cava constriction is released.
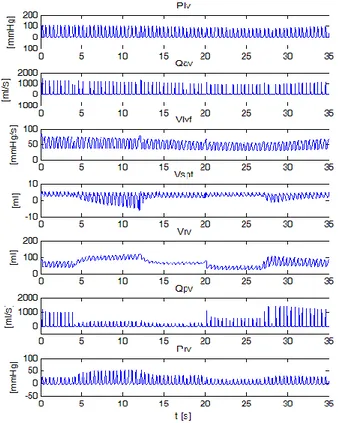
Figure 11: Hemodynamic CVS responses simulated using the presented model
Figure 11 plots the results of a simulation carried out on the CVS model to simulate the experimental results of Figure 10. Comparing these plots highlights the ability of the CVS model to capture all of the trends measured experimentally. Note that the magnitudes of each variable do not match the experimental results due to the lack of detailed information available and the use of generic human parameters. However, by capturing these trends the model is shown to accurately capture the dynamics of ventricular interaction in the CVS. Figure 12 plots the variation in left ventricle end-diastolic area, which is assumed to be proportional to left ventricle end-diastolic volume during the experiment. The black dots are experimental data. The solid and dashed lines plot the results of a statistical analysis (Slinker and Glantz, 1989) to capture the changes, and are not experimental data.
Figure 13 plots the variation in simulated left ventricle
volume (Vlv) using the CVS minimal model. It shows a good
match between experimental and model results. This means that our multi-scale model behaves as expected physiogically.
Figure 12: Experimentally determined change in left ventricle end-diastolic area (Slinker and Glantz, 1989)
Figure 13: Simulated variations in left ventricle volume (blue) and end diastolic volume (black line)
4. CONCLUSIONS
This work describes a new multi-scale closed-loop model of the cardiovascular system that accounts for progressive mitral valve aperture. Simulations show good correlation with physiologically expected results for healthy valves in static and dynamic simulations. The large number of valve model parameters indicates a need for emerging, lighter and minimal mitral valve models that are readily identifiable to achieve full benefit in real-time use. These results suggest a further use of this model to track, diagnose and control valve pathologies.
REFERENCES
Bowman, A. W., Frihauf, P. A. & Kovacs, S. J. 2004. Time-varying effective mitral valve area: prediction and
validation using cardiac MRI and Doppler
echocardiography in normal subjects. Am J Physiol Heart
Circ Physiol, 287, H1650-7.
Burkhoff, D., Alexander, J. & Schipke, J. 1988. Assessment of Windkessel as a Model of Aortic Input Impedance.
Burkhoff, D. & Tyberg, J. V. 1993. Why does pulmonary venous pressure rise after onset of LV dysfunction: a theoretical analysis. American Journal of Physiology, 265, H1819-28.
Courtois, M., Kovacs, S. J., Jr. & Ludbrook, P. A. 1988. Transmitral pressure-flow velocity relation. Importance of regional pressure gradients in the left ventricle during diastole. Circulation, 78, 661-71.
Desaive, T., Ghuysen, A., Lambermont, B., Kolh, P., Dauby, P. C., Starfinger, C., Hann, C. E., Chase, J. & Shaw, G. M. 2007. Study of ventricular interaction during pulmonary embolism using clinical identification in a minimum cardiovascular system model. Conf Proc IEEE
Eng Med Biol Soc, 2007, 2976-9.
Flewitt, J. A., Hobson, T. N., Wang, J., Jr., Johnston, C. R., Shrive, N. G., Belenkie, I., Parker, K. H. & Tyberg, J. V. 2007. Wave intensity analysis of left ventricular filling: application of windkessel theory. Am J Physiol Heart
Circ Physiol, 292, H2817-23.
Guyton, A. C. 1991. Textbook of medical physiology, Philadelphia, Saunders.
Hann, C. E., Chase, J. G. & Shaw, G. M. 2005. Efficient implementation of non-linear valve law and ventricular interaction dynamics in the minimal cardiac model.
Computer Methods and Programs in Biomedicine, 80,
65-74.
Kass, D. A. & Maughan, W. L. 1988. From 'Emax' to pressure-volume relations: a broader view. Circulation, 77, 1203-12.
Kerckhoffs, R. C. P., Neal, M. L., Gu, Q., Bassingthwaighte, J. B., Omens, J. H. & Mcculloch, A. D. 2007. Coupling of a 3D finite element model of cardiac ventricular mechanics to lumped systems models of the systemic and pulmonic circulation. Annals of Biomedical Engineering, 35, 1-18.
Moorhead, K. T., Paeme, S., Chase, J. G., Kolh, P., Pierard, L., Hann, C. E., Dauby, P. C. & Desaive, T. 2011. A simplified model for mitral valve dynamics. Computer
Methods and Programs in Biomedicine.
Mynard, J. P., Davidson, M. R., Penny, D. J. & Smolich, J. J. 2011. A simple, versatile valve model for use in lumped parameter and one-dimensional cardiovascular models.
International Journal for Numerical Methods in Biomedical Engineering, n/a-n/a.
Nelson, M. D., Haykowsky, M. J., Petersen, S. R., Delorey, D. S., Cheng-Baron, J. & Thompson, R. B. 2010. Increased left ventricular twist, untwisting rates, and suction maintain global diastolic function during passive heat stress in humans. Am J Physiol Heart Circ Physiol, 298, H930-7.
Paeme, S., Moorhead, K. T., Chase, J. G., Lambermont, B., Kolh, P., D'orio, V., Pierard, L., Moonen, M., Lancellotti, P., Dauby, P. C. & Desaive, T. 2011. Mathematical multi-scale model of the cardiovascular system including mitral valve dynamics. Application to ischemic mitral insufficiency. Biomed Eng Online, 10, 86.
Saito, S., Araki, Y., Usui, A., Akita, T., Oshima, H., Yokote, J. & Ueda, Y. 2006. Mitral valve motion assessed by high-speed video camera in isolated swine heart. Eur J
Cardiothorac Surg, 30, 584-91.
Shim, E. B., Jun, H. M., Leem, C. H., Matusuoka, S. & Noma, A. 2008. A new integrated method for analyzing heart mechanics using a cell-hemodynamics-autonomic nerve control coupled model of the cardiovascular system. Progress in Biophysics and Molecular Biology, 96, 44-59.
Slinker, B. K. & Glantz, S. A. 1989. Beat-to-beat regulation of left ventricular function in the intact cardiovascular system. American Journal of Physiology, 256, R962-75. Smith, B. W., Chase, J. G., Nokes, R. I., Shaw, G. M. &
Wake, G. 2004. Minimal haemodynamic system model including ventricular interaction and valve dynamics.
Medical Engineering and Physics, 26, 131-9.
Smith, B. W., Geoffrey Chase, J., Shaw, G. M. & Nokes, R. I. 2005. Experimentally verified minimal cardiovascular system model for rapid diagnostic assistance. Control
Engineering Practice, 13, 1183-1193.
Starfinger, C., Chase, J. G., Hann, C. E., Shaw, G. M., Lambermont, B., Ghuysen, A., Kolh, P., Dauby, P. C. & Desaive, T. 2008a. Model-based identification and diagnosis of a porcine model of induced endotoxic shock with hemofiltration. Mathematical Biosciences, 216, 132-9.
Starfinger, C., Chase, J. G., Hann, C. E., Shaw, G. M., Lambert, P., Smith, B. W., Sloth, E., Larsson, A., Andreassen, S. & Rees, S. 2008b. Model-based identification of PEEP titrations during different volemic levels. Computer Methods and Programs in Biomedicine, 91, 135-144.
Starfinger, C., Hann, C. E., Chase, J. G., Desaive, T., Ghuysen, A. & Shaw, G. M. 2007. Model-based cardiac diagnosis of pulmonary embolism. Computer Methods
and Programs in Biomedicine, 87, 46-60.
Szabó, G., Soans, D., Graf, A., J. Beller, C., Waite, L. & Hagl, S. 2004. A new computer model of mitral valve hemodynamics during ventricular filling. European
Journal of Cardio-Thoracic Surgery, 26, 239-247.
Weber, K. T., Janicki, J. S., Hunter, W. C., Shroff, S., Pearlman, E. S. & Fishman, A. P. 1982. The contractile behavior of the heart and its functional coupling to the circulation. Progress in Cardiovascular Diseases, 24, 375-400.