UNIVERSITE DE SHERBROOKE
Faculte des sciences appliquees Departement de genie chimiqueOPTIMISATION EXPERIMENTALE DE LA SPHEROIDISATION DES POUDRES
METALLIQUES ET CERAMIQUES PAR PLASMA INDUCTIF
EXPERIMENTAL OPTIMIZATION OF THE SPHEROIDIZATION OF METALLIC
AM) CERAMIC POWDERS WITH INDUCTION PLASMA
Memoire de maitrise es sciences appliquees Specialite: genie chimique
A ma famille
A la memoire de mon grand-pere, LeoRESUME
Une etude experimentale de 1'efficacite de spheroi'disation des procedes par plasma inductif a ete completee. L'objectif principal etant d'obtenir des modeles qui pourraient etre utilises pour predire 1'efficacite de spheroidisation pour differents types de poudres sous differentes conditions d'operation des systemes de plasma inductif. Les techniques de microscopie optique, microscopie electronique a balayage, sedigraphie et de diffraction rayon-X ont ete utilisees pour 1'analyse des poudres originales et des poudres traitees.
Des poudres de silice, cTalumine, d'oxyde de chrome, de zircone et de carbure de tungstene ont ete utilisees pendant les experiences. Pour Ie traitement par plasma inductif, deux installations differentes on ete utilisees. La premiere installation pouvait foumir une puissance maximale de 100 kW et operait avec une frequence de 0.3 MHz et la seconde pouvait foumir une puissance maximale de 50 kW et operait avec une frequence de 3 MHz. Les conditions d'operation on ete choisies pour minimiser les reactions et 1'evaporation des particules.
Les poudres traitees demontraient un phenomene de fomiation occasionnel de cavites intemes dans les poudres traitees et un leger changement dans Ie diametre moyen des particules traitees. Le modele theorique predit de fa9on satisfaisante I'efflcacite de spheroidisation des poudres apres que 1'efficacite energetique maximale a ete atteinte. La dependance des parametres du model sur les proprietes thermodynamiques des poudres et sur les parametres d'operation du plasma a ete demontree.
ABSTRACT
An experimental study of the spheroidization efficiency of powders in an induction
plasma process was completed. The main objective being to develop a model which could be subsequently used for the prediction of the spheroidization efficiency for various powders under a wide range of plasma operating conditions. Throughout the study, optical microscopy, scanning electron microscopy, sedigraphy and X-ray diffraction were used to analyse the original and plasma treated powders.Silica, alumina, chromium oxide, zirconia and tungsten carbide powders were the subject of systematic experimentation using two different plasma installations. One of the installation had a maximum available power of 100 kW with an operating frequency of 0.3 MHz while the other had a maximum available power of 50 kW with an operating frequency of 3 MHz. Operating conditions were varied such to minimize reactions and evaporation of powders.
The presence of internal cavities was observed in the treated particles along with a slight change in the mean particle diameter of the powders. The proposed model successfully predicts
the spheroidization efficiency of the particles beyond a defined critical point known as the
maximum energy efficiency point. The model parameters are shown to depend on the thennodynamic properties of the powders and on the induction plasma operating parameters.ACKNOWLEDGEMENTS
I would like to express my appreciation to all who have contributed to the completion of this thesis. I would specially like to thank Prof. Maher I. Boulos for his support both information wise and financially. His latitude in enabling me to work in many areas even beyond the field of study, the experiences and extra learning opportunities offered are greatly appreciated.
All the members of the Plasma Technologies Research Centre (CRTP) were also of great resource. In particular, I would like to express my thanks to Serge Gagnon along with Marc Couture who both shared their experience and gave me all the support and information required to successfully design many reactors and complete my experimental work. Their patience is greatly appreciated.
The software wise support of Benoit Cote and Patricia Foumier are also appreciated for they were essential in moments were either megabytes or time were rare.
Finally, I want to thank all other students, both at the undergraduate and graduate level, which made life in the Sherbrooke area more than a simple enjoyment by offering a large variety of possibilities to unwind.
TABLE OF CONTENTS
RESUME ... ii
ABSTRACT ... . ... iii
ACKNOWLEDGEMENTS ... ... iv
TABLE OF CONTENTS ... v
LIST OF FIGURES ... viii
LIST OF TABLES ... x
1. INTRODUCTION ... 1
2. LITERATURE REVIEW ... 5
2.1 H.F. Induction Plasmas ... 5
2.1.1 H.F. Induction Plasma Characteristics ... 6
2.1.2 H.F. Induction Plasma Modelling ... 9
2.1.3 H.F. Induction Plasma Torches and Installations ... 10
2.2 Thermophysical Properties ... 11
2.2.1 Thermophysical Properties of the Plasma ... 12
2.2.2 Thermophysical Properties of the Powders ... 12
2.3 Heat Transfer mechanisms ... 13
2.3.1 Conduction ... 13
2.3.2 Convection ... 15
2.3.3 Radiation ... 15
2.4 Energy Balance ... 16
2.5 Dynamics of the Powder Spheroidization ... 17
2.5.1 Heat Transfer Controlled Phenomenon ... 18
2.5.2 Mass Transfer Controlled Phenomenon ... 19
2.6 Spheroidization of Powders ... 19
3. DEVELOPMENT OF SPHEROIDIZATION MODELS ... 23
3.1 Energy Transfer Model ... 23
3.1.1 The Minimum Energy Requirements ... 23
3.1.2 Energy Transferred From the Plasma to the Particle ... 25
3.1.3 The Melting and Spheroidization Efficiencies ... 26
3.2 Empirical Model ... 30
3.3 Experimental Evaluation of the Model Parameters ... 31
3.3.1 Mean Diameter Based Empirical Model ... 32
3.3.2 Thermophysical Properties Based Empirical Model ... 33
4. EXPERIMENTAL APPARATUS AND OPERATING CONDITIONS ... 35
4.1 Plasma Spheroidization Installations ... 35
4.1.1 Induction Plasma Torch ... 35
4.1.2 Power Generators ... 39
4.1.3 Spheroidization Chambers ... 39
4.1.4 Powder Collection Systems ... 40
4.2 Powder Feeders ... 41
4.3 Analysis Techniques ... 42
4.3.1 Degree of Spheroidization ... 42
4.3.2 Composition Analysis ... 43
4.3.3 Porosity Analysis ... 44
4.3.4 Particle Size Distribution ... 44
4.4 Operating Conditions ... 45
4.4.1 Thermophysical Properties of the Powders ... 45
4.4.2 Plasma Operating Conditions ... 46
5. RESULTS AND ANALYSIS ... 48
5.1 Spheroidization Efficiency ... 48
5.3 Minimal Evaporation of the Particles ... 54
5.4 Absence of Reactions ... 55
5.5 Theoretical Energy Efficiency ... 64
5.6 Empirical Models ... 67
6. SUMMARY AND CONCLUSIONS ... 73
6.1 Recommendations for Further Studies ... 76
LIST OF FIGURES
Figure 2.1 H.F. Induction plasma generation within the confinement tubes with an
induction coil ... 6
Figure 2.2 Minimum sustaining power attained by induction plasmas of different gases at different pressures as a function of the operating frequency ... 9
Figure 3.1 Temperature history of the particle during heating versus its specific enthalpy 24
Figure 3.2 The maximum temperature for particles of various size with infinite residence time in an argon plasma of various average temperature ... 27Figure 3.3 Dependency of the diameter of various powders as a function of the residence time ... 29
Figure 4.1 Schematic representation of the 3 MHz experimental set-up ... 36
Figure 4.2 Schematic representation of the 0.3 MHz experimental set-up ... 37
Figure 4.3 Schematic diagram of the induction plasma torch ... 38
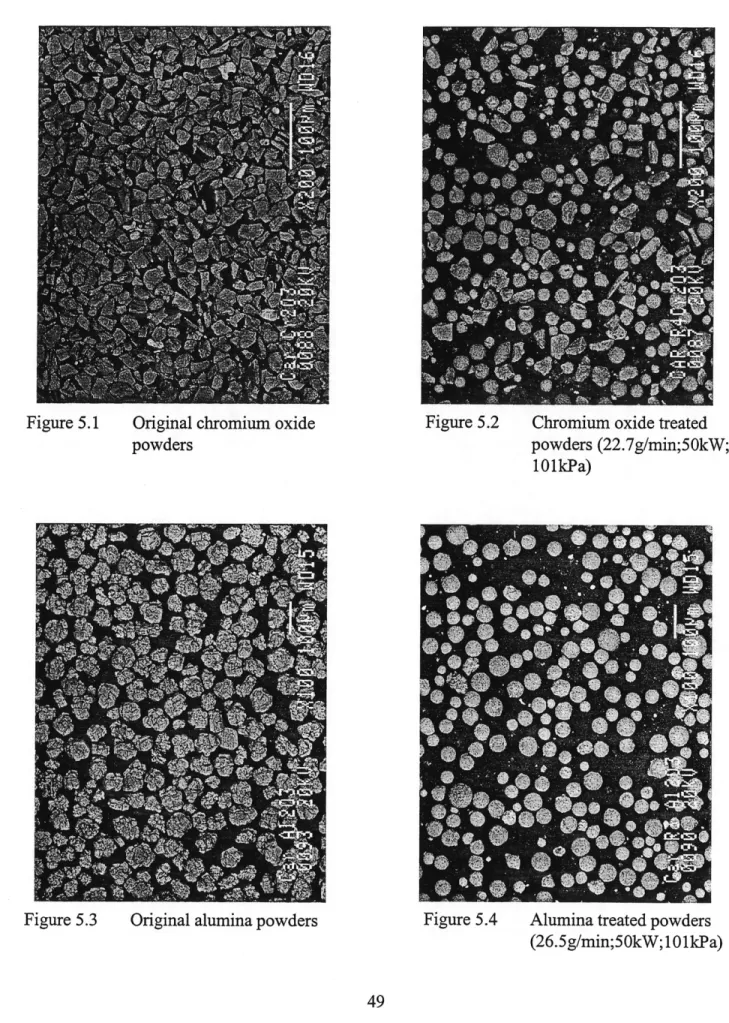
Figure 5.1 Original chromium oxide powders ... 49
Figure 5.2 Chromium oxide treated powders (22.7g/min;50kW;101kPa) ... 49
Figure 5.3 Original alumina powders ... 49
Figure 5.4 Alumina treated powders (26.5g/min;50kW;101kPa) ... 49
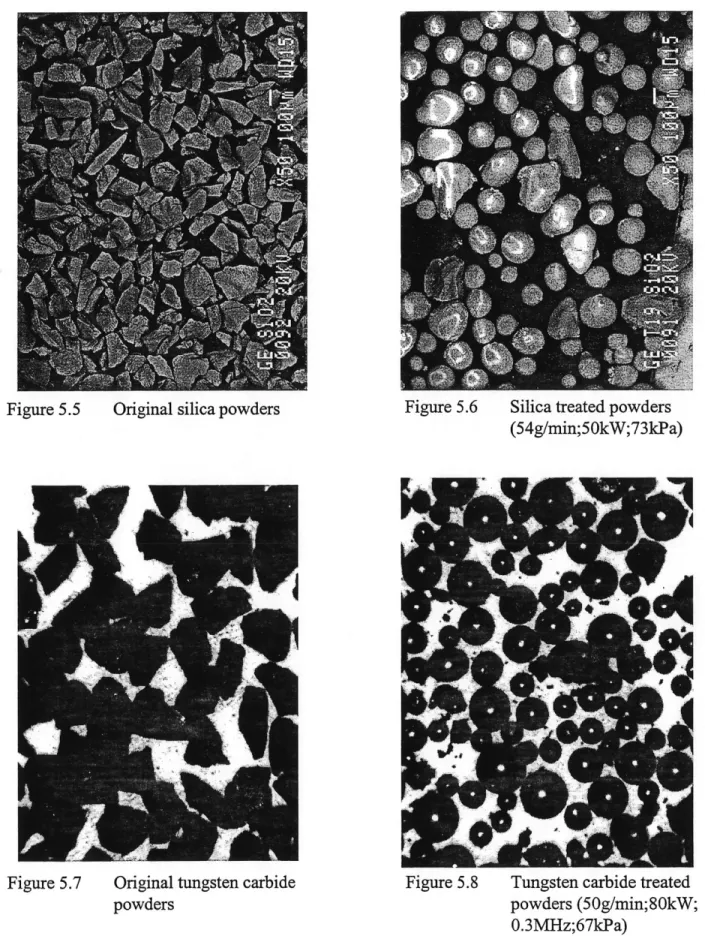
Figure 5.5 Original silica powders ... 50
Figure 5.6 Silica treated powders (54g/min;50kW;73kPa) ... 50
Figure 5.7 Original tungsten carbide powders ... 50
Figure 5.8 Tungsten carbide treated powders (50g/min;80kW;0.3MHz;67kPa) ... 50
Figure 5.9 Original zirconia powders ... 51
Figure 5.10 Zirconia treated powders (28.6g/min;50kW;101kPa) ... 51
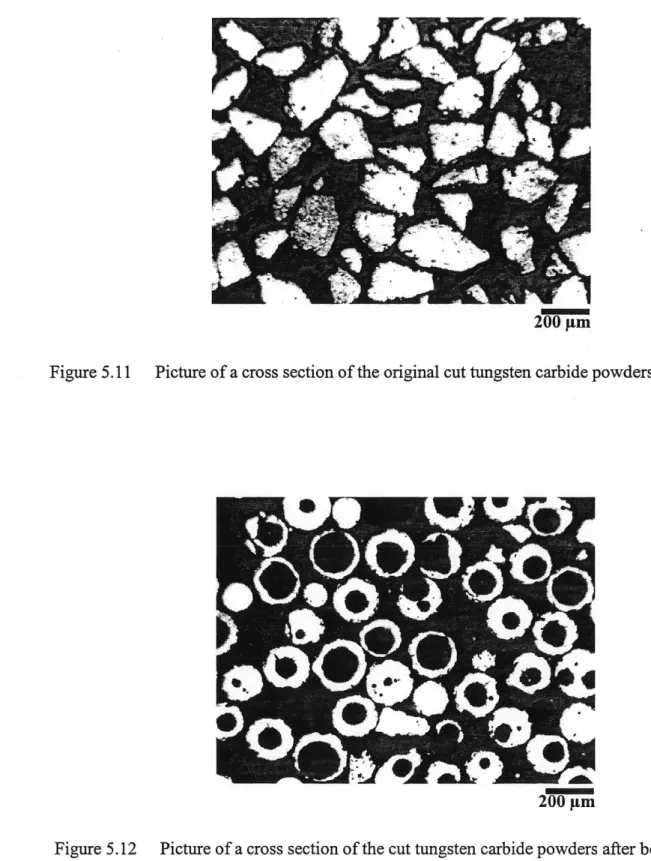
Figure 5.11 Picture of a cross section of the original cut tungsten carbide powders ... 53
Figure 5.12 Picture of a cross section of the cut tungsten carbide powders after being treated by induction plasma ... 53
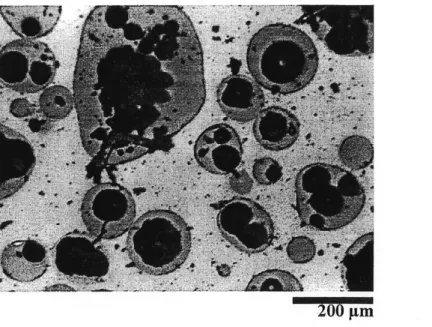
Figure 5.13 Picture of a cross section of the cut silica powders after being treated by induction plasma ... 54
Figure 5.15 X-ray diffiraction analysis of the plasma treated zirconium oxide powders .. 56 Figure 5.16 X-ray diffraction analysis of the original aluminum oxide powders ... 57 Figure 5.17 X-ray diffraction analysis of the plasma treated aluminum oxide powders .. 57 Figure 5.18 X-ray diffraction analysis of the original chromium oxide powders ... 58 Figure 5.19 X-ray diffraction analysis of the plasma treated chromium oxide powders .. 58
Figure 5.20 X-ray diffraction analysis of the original silica powders ... 59
Figure 5.21 X-ray diffraction analysis of the plasma treated silica powders with the
amplitude scaled up ten folds relative to the original powders X-ray analysis 59 Figure 5.22 X-ray diffraction analysis of the original tungsten carbide powders ... 60 Figure 5.23 X-ray diffraction analysis of the plasma treated tungsten carbide powders .. 60 Figure 5.24 Thennodynamic equilibrium diagram of a C-H-W system demonstrating the
preference of the W2C phase to the WC phase at high temperatures (above
1500 K) ... 63
Figure 5.25 Energy efficiency of set #3; 80 kW, 0.3 MHz, set #4; 100 kW, 0.3 Mhz and
set #5; 50 kW, 3 MHz, all being S102 powders ... 64
Figure 5.26 Energy efficiency of set #7; Si02,set#8; A1203,set#9; Cr203andset
#10; Zr02, all with identical operating conditions of 50 kW and 3 Mhz .... 65 Figure 5.27 Spheroidization efficiency of the model and the actual experimental results . 66
Figure 5.28 Spheroidization efficiency as predicted by the empirical model for set #1
through set #4 ... 68
Figure 5.29 Spheroidization efficiency as predicted by the empirical model for set #5 and
set #7 through set #10 ... 68
Figure 5.30 Spheroidization efficiency as predicted by the diameter based semi-empirical
model for silica powder with experimental conditions of set #6 ... 70Figure 5.31 Spheroidization efficiency as predicted by the thennodynamic property
based semi-empirical model for set #7 through set #10 which represents the
LIST OF TABLES
Table 4.1 Thermophysical properties of the powders ... 45
Table 4.2 Experimental operating conditions ... 47
Table 5.1 Values of the Z parameter ... 66
Table 5.2 Values for the parameters of the empirical model ... 67
Table 5.3 Parameter of the diameter based semi-empirical model ... 69
CHAPTER 1
INTRODUCTION
Since the earliest theoretical and experimental research in plasma technologies, some basic applications have been the subject of numerous investigations. The gradual widening of the fields of applications has been constant since. The earliest and simplest application was the heat treatment of particulates. This was the first step which could be easily used to evaluate the performance of this new high temperature technology. A technology which could be used with relatively small experimental or industrial set-ups. The following developments have included high performance materials with generally high melting temperatures. Some of the applications
beyond the spheroidization of particles which have been developed are the spraying of high
temperature resistant coatings and coatings with other specific properties which fulfilled the specific requirements of industries. These can be for protection from magnetic fields, electric fields, for the rebuilding of cutting tools or high performance machinery as for example, the rebuilding of specialized ball valves. In recent years, more specific applications have been developed. These include the coating ofbioactive implants, the production of ultra fine powders and plasma chemical synthesis. One of the latest research areas developed with a very wide application field is the treatment of wastes.All these tecbiological advancements are done with a wide range of plasma generating techniques. The main plasma generation technique chosen for a specific procedure is dependant on the temperatures required. This is only one of the factors since there is a great number of variables which can influence the choice as the residence time required and the size or
accessibility of the apparatus for example. The main principles of plasma generation are thermal arc plasmas which can be with or without transferred arcs and thermal radio frequency discharges
also known as high frequency induction plasmas [PFENDER et al., 1985]. Both have their
particular advantages which usually determines which is used for the process in question.For the spheroidization and densiflcation of particles, h.f. induction plasmas is the preferred plasma generation method due to the longer residence time possible for the particles in the plasma and also it's ability to avoid the contamination of the product. The absence of contamination is because this plasma generation technique lacks the presence of electrodes unlike arc generation. The erosion of the electrodes introduces a foreign substance into the reactive system. This latest characteristic is of extreme importance in the production of high purity. Another characteristic of the induction plasma system is the easy introduction of the raw product in the core of the plasma. Most other methods must introduce the particulates from the outer regions of the plasmas. It must however be noted that recent advances in arc generation can now allow for the central injection of the particulate. It does however require a complicated and expensive torch design.
The spheroidization and densification of powders was one of the first uses of the plasma technology. It has therefore been very extensively studied theoretically. Mathematical modelling have been performed over the years in order to describe quantitatively the phenomenons involved in the process and to predict the outcome of the treatment. The optimization and prediction of the product output and quality is the essential information for industries. This is mainly due to the high cost of the technology and the desire to minimize pre-production lengthy experimentation
necessary for parameter optimization. The modelling of the induction plasma process has described quite well the phenomenons which occur during the processing of the materials. However, the prediction of the degree of melting and densification of the powder requires a good
knowledge of the thermophysical properties of the material being treated which are not always
available except for well studied materials. Most industrial applications are oriented towards the
development of new advance materials with scarcely available physical properties. Otherproblems with modelling is that many approximations or simplifications which are usually made
in the numerical calculations. Experimentally determined models can be used, on the other hand,to predict the resulting spheroidization and densification efficiencies and to predict the optimal
operating conditions for a process. For the model to be practical, it should incorporate theprincipal thermophysical properties of the material treated. From this model, the spheroidization
and densiflcation efficiency and it's limits for a particular powder could be known based on the properties of the powders for a given set of plasma operating conditions.Chapter 2 is dedicated to a literary review ofh.f. induction plasma and the review of the necessary thermophysical properties which separates into distinct categories the powders. It also includes a review of the heat transfer methods to detennine which are significant and what simplifications can be used in the model. The heat transfer methods are used to determine the energy balance but a discussion of the dynamics will also be completed. Chapter 2 ends with a review of previous works on powder spheroidization and densification. Chapter 3 will introduce
mathematical models and their physical limits based on the properties of the particles for the
process. It also introduces empirical equations which have been experimentally determined for the optimization and prediction of the spheroidization efficiency. Chapter 4 presents in detailsthe experimental set-ups used for the completion of the experiments. Chapter 5 will present the experimental results with an analysis of the treatment efficiency as a function of the powder feed rate. The results are compared with the predictions of the empirical models used. A summary and conclusion are presented in chapter 6.
CHAPTER 2
LITERATTOE REVIEW
In the first part of this chapter, the generation ofh.f. induction plasmas is presented. It is
followed by a presentation of the thermophysical properties which influence the spheroidization
process as well as the controlling heat transfer mechanisms.2.1 H.F. Induction Plasmas
The earliest plasmas which were generated without electrodes appeared in the early sixties
in the works of [REED, 1961]. He showed that a gas flowing in a cylindrical quartz tube could
be maintained as a stable plasma at atmospheric conditions when submitted to an electromagnetic inductor. Since these early experiments, many others were performed to study h.f. induction plasma and also its applications to possible processes. Many of both the induction plasma and itsapplications have been completed since as presented by [BOULOS, 1991 and 1992, YOSHIDA et
al, 1983 andFAUCHAIS, 1980].
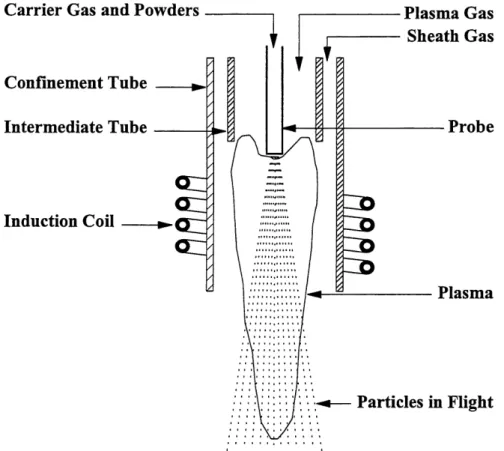
For an induction torch as presented in Figure 2.1, the energy coupling between the electric generator and the plasma itself is done by a cylindrical induction coil. This eliminates the possibilities of product contamination by the plasma generation apparatus itself. This latest property of the induction torch also allows for the use of a wider variety of gases since the is no risks of these gases interacting with parts of the torch. It therefore opens widows of opportunities on many other chemically reactive systems.
Carrier Gas and Powders Confinement Tube Intermediate Tube
Induction Coil
Plasma GasSheath Gas
Probe PlasmaParticles in Flight
Figure 2.1 H.F. Induction plasma generation within the confinement tubes with an induction
coil
2.1.1 H.F. Induction Plasma Characteristics
The induction plasmas have particular characteristics which are dependent of the operating conditions of the plasma torch and which can influence the process. The modification of each of the plasma torch parameter affects the efficiency of the torch and may also interactively modify other parameters if they are not maintained constant.
The power of an induction torch will determine the energy available to the process. However, in order to maintain a stable plasma, there is a minimum power required which is dependant on the other operating parameters of the induction torch as presented by [POOLE et
al., 1973]. The minimum sustaining power for a torch can range anywhere from a few watts to millions of kilowatts. Once the plasma is ignited and is stable, the increase of the power will result in the increase of the ionization of the plasma gas and subsequently will increase the energy available for the process. Regular h.f. electric generators can provide any power required up to its maximum capacity resulting in the possibility of a wide range of operating powers.
The frequency is actually the parameter which defines the h.f. induction plasmas. As mentioned earlier, it is also known as radio frequency plasmas and therefore sets the operating
frequency in the range of 20 kHz up to 10 MHz. The frequency is also a variable which affects
what is known as the skin dept. The skin dept is the thickness of the external cylindrical shell of
the resulting load. It is the region of the plasma where the temperatures are the highest.The frequency unlike the power can not be varied as easily. The induction plasma electric generators are build with a certain frequency which can be slightly modified. However, they are usually maintained a the predisposed frequency and other operating parameters are modified if different plasma conditions are required. This also results in different minimum operating power and pressures for different installations.
The pressure is an external parameter in that it must be controlled from the process chamber. Even though it is external, it has as much influence on the resulting plasma flame as does the power. The pressure has a physical effect on the plasma flame as it can increase it size or density. As for the power, there is also a maximum pressure allowable such to maintain a constant plasma. Reactor chambers may operate above or below atmospheric pressure depending
on the process requirements. The only complications are to maintain the desired pressures without contaminating either the inner or outer environments.
The other major parameter which influences the resulting plasma flame is the composition of the gases used in the torch. Argon is the gas with one of the lowest ionization energy which is readily available. It is generally the plasma gas used to start the induction torches as the minimum power and the maximum pressure required for the ignition of the plasma are optimal as presented in [POOLE et al., 1973]. Other gases as the sheath gas and the carrier gases are also introduced in the system for the process optimization and torch protection purposes.
The subsequent introduction of other gases or simply the substitution of the argon for other gases allows for a change in the thermophysical properties of the plasma gases. The main thermophysical properties of the gases which are of importance during the plasma induction process are the plasma density, enthalpy, specific heat, viscosity, thermal conductivity and the
electric conductivity as presented in [BOULOS et aL, 1994].
The other implications of the replacement of the plasma, carrier or sheath gases is that it allows for the introduction of gases not for their thennophysical properties but for reactive characteristics. With this possibility, many reactions have been studied and completed as
presented by [PROULX et al, 1991a, GUO et al, 1995 and JIANG et al, 1995].
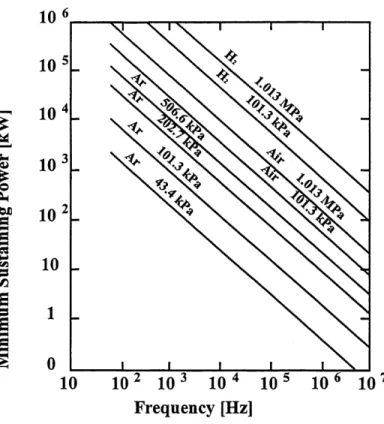
All four major parameters which affect the plasma flame properties and their minimum required operating conditions can be described graphically as shown in Figure 2.2.
-^ s-<u
^
0^
OJD GM
^
-1-1 <w s »3g
I
10 102 103 10 4 105 10 6 10 7
Frequency [Hz]
Figure 2.2 Minimum sustaining power for induction plasmas of different gases at different pressures as a function of the operating frequency
2.1.2 H.F. Induction Plasma Modelling
Since the early discovery of induction plasmas, modelling attempts have been done with ever increasingly powerful computers. In the early stages, the modelling was focused on the
behaviour and properties of the plasma flame as presented in [BOULOS, 1976]. Combining the
equations of motion, energy, electric and magnetic fields along with many assumptions many characteristics of the plasma induction process were determined. The flow fields which gave velocity profiles, the temperature, electric and magnetic fields were all obtained and therefore described fairly completely the plasma flame.The introduction of particulate into the plasma flame complicated the modelling as it had
and interactive behaviour with the plasma flame as presented by [BOULOS et al., 1974 andPROULX et aL, 1985]. The introduction of particles into the plasma had for a purpose to melt
them to spheroidized powders. However it was found that this particle loading had a very large cooling effect on the plasma flame and the amount of cooling had to be determined. New resultshad to be obtained as the particles distributions and paths within the plasma torch where now of
significant importance.The introduction of foreign matter in the plasma torch also brought new thermophysical
changes to the plasma as it can be seen in [ESSOLTANI et al., 1993 and 1994]. The modelling
had to include the change in thermophysical properties of plasma due to the presence of metallic vapours or any other impurities brought by the desired reaction. This will become ever more complex as the latest investigations for induction plasma technologies rely on the introduction of multiphase, multicomplexe compounds as in waste treatment or suspension plasma spraying.2.1.3 H.F. Induction Plasma Torches and Installations
Induction plasma installations can generally be found in ranges of 10 to 100 kW. Some 400kW installations are however operational. The dimensions of the torch can vary from 3.5 to
10 cm diameter for the inner walls which are water cooled surrounded by a 3 to 7 turn induction coil. The radio frequency generally used for induction plasma generation varies between 200 kHz and 40 MHz. The plasma confining cylindrical tubes are now made of ceramics due to their improved thermal shock resistance which gives rise to longer life spans [BOULOS, 1991].
The gases are introduced in various modes and velocities. The plasma gas (central gas) is introduces tangentially and axially to stabilized the plasma discharge. The sheath gas is introduced axially with high velocities to reduce the thermal load on the inner surface of the plasma confinement ceramic tube. The earner gas is injected axially in the centre of the torch
with an injection probe which is cooled with high pressured water. It is injected centrally since it
is the region with the highest temperature. The total volumetric flow rate of gases can vary between 100 and 150 slpm depending on the plasma power rating.The maximum temperatures attained in r.f. induction plasma torches can vary between 8000 to 12000 K and the residence time of the gases can range from 10 to 20 ms.
All these required installations and operating materials (gases, electricity, water cooling, pressure maintain) do represent many expenses. This is why the r.f. induction plasma technology is generally known as an expensive tecbiology. However, this is why it is used mainly in areas of high performance materials or where it is absolutely necessary. In the first case, there is a high added value to the product which renders the process economically viable. In cases where the technology is necessary, the product must be treated and it is one of the few technologies available to complete the task. It is why the used of the induction plasma technology must be
well evaluated before using it as presented by [JACQ et al., 1992].
2.2 Thermophysical Properties
To understand the heat transfer which occurs in the plasma, the thermophysical properties of the system are required. These can be divide clearly in two different categories when it comes
to the heat treatment of particulate. The first category is the thermophysical properties of the plasma itself while the other category is the thermophysical properties of the powders.
2.2.1 Thermophysical Properties of the Plasma
The thennophysical properties of the plasma are dependant on the major parameters mentioned in section 2.1.1. Since they are also a function of temperature, most properties vary within the plasma itself. This complicates the macroscopic evaluation of such a process, hi a real space analysis, the density, enthalpy, specific heat, viscosity, thermal conductivity and electric
conductivity are different at every point in the plasma torch (neglecting the cylindrical
symmetry). The amount of data required in such an analysis is astronomical as it is presented in[BOULOS et al, 1994].
Another aspect which complicates the evaluation of the properties of the plasma is that depending on the plasma operating condition, the temperature profile changes as seen in
[MOSTAGfflMI et aL, 1985 and 1990 and BOULOS, 1976]. This means that for every different
torch or power supply of a different frequency, all of the plasma thermophysical properties willchange.
2.2.2 Thermophysical Properties of the Powders
Unlike the properties for the plasma flame, a set of thennophysical properties are unique for every different powders. Some of the properties are characteristic of powders to the point of separating them in different categories. That is the case for ceramics powders and metallic
powders which can be primarily differentiated by their thermal conductivity. The metallic
powder usually having much higher thermal conductivity as mentioned in [DIGNARD et al.,
1997a].
The basic properties which are of interest for the process and that are known and readily available are the thermal conductivity, the density, the specific heat, the melting temperature, the vaporization temperature, the latent heat of fusion, the latent heat of vaporization and the particulate size or diameters as presented in [DIGNARD et al., 1997b]. There are many more other properties known but that are of less or negligible importance. All these parameters and thermophysical properties of the plasma are needed for the evaluation of the plasma particle heat transfer phenomenon.
2.3 Heat Transfer mechanisms
In the plasma processing of materials, there are three major heat transfer mechanisms which account for the energy transfer between the plasma, its surroundings and the particulate which are to be treated. The three major mechanisms are the heat transfer by conduction, by
convection and by radiation [ESSOLTANI et al., 1993].
2.3.1 Conduction
In the plasma processing of powders, heat conduction phenomenon are observed either between the plasma and the inner walls of the plasma confinement tube, between the plasma and
the particles, within the plasma itself due to the high temperature gradients and in the particles
themselves. Since the process considered involves the melting and resolidification of the particles, the transfer of the energy from the plasma to the particle and the heat distribution withinthe particles are the controlling phenomenon that affect directly the spheroidization efficiency. The transfer from the plasma to the particle is governed by the classic heat transfer equation
modified for this application which is presented in Equation 2-1 obtained from [BOURDBSf et al.,
1983]:
q=^(T»-Ts) . (2-1)
Where <J is the heat flux to the surface of the particle, k is the integrated mean thermal
conductivity of the plasma gas, ^0 is the particle diameter, Tco is the free stream plasma temperature and Ts is particle surface temperature.To obtain the temperature in the particle, the transient heat transfer equation must be
applied to particle itself. This will allow to determine a temperature profile within the particle
and therefore determine if the whole particle was molten by the process. Unless the particle has an infinite conductivity, there shall always be a temperature gradient between the particle's surface temperature and the particle's central temperature. The equation has to be solved with boundary conditions and gives a temperature profile as a function of the radius. However, if the Biot number is lower than 0.02, the temperature gradient can be neglected as proven in2.3.2 Convection
An equation for the convection heat transfer is quite easily obtainable. It is actually included in the equation for heat transfer by conduction. Since it also depends on the temperature difference between the surface and the free stream temperature, the contribution of the heat transfer by convection is included in the overall heat transfer coefficient h. It must be noted that in h.f. induction plasmas, the velocities of the gases are generally quite low ranging from 10 to 40 m\s as shown in [BOULOS, 1976]. It can therefore be seen that the heat transfer by convection is much less than the heat transfer by conduction.
2.3.3 Radiation
Radiation within a plasma can get quite complicated. In some cases, up to 45% of the
initial plasma energy is lost to the surroundings by radiation as presented in [PROULX, 1991b].
When heat transfer from the particles to the surrounding is involved, the radiative heat transferequation is presented as Equation 2-2 from [BOULOS, 1978]:
q = ea(TJ - T^) (2-2)
Where G is the particle emmissivity and o" is the Stefan-Boltzmann constant and To. is the ambiant walls temperature.
However, even though the effect of radiation on the plasma energy balance itself is important, it turns out that the importance of the radiation to the heat transfer to the particles can
be neglected unless the particles' surface temperatures exceed 2000. This is particularly
important when dealing with the melting of high melting point refractory materials. Radiation
heat transfer is also greatly influenced by the presence of metallic vapour in the plasma asshowed by [ESSOLTANI et al, 1990,1993 and 1994 and VARDELLE et al, 1990] which
increases considerably radiative energy losses from the plasma.2.4 Energy Balance
When the particulate matter is introduced into the plasma, the resulting powders will be completely spheroidized if a certain thennodynamic stage was reached during the process. This critical point is the minimum requirement for the spheroidization process to be completed. It does however, for optimization purposes, also represent a point beyond which overheating of the particles results in a waste of energy and of material due to the subsequent evaporation of the
particle as is presented in [MCKELLIGET, 1992 and BOURDIN, 1983].
The equilibrium point that is required is obviously material dependant. It is not a tme
equilibrium but simply a stage where there is no more fusion of the particle. The only changing
parameters from this point on is the temperature of the particle, up to its evaporation point, followed by changes in the size of the particle due to the evaporation of its outer surface. This latest phenomenon is one which is not desired during such processes. The determination of the energy required to reach this equilibrium point is done with an energy balance on the initial particles. Equation 2-3 represents the total energy required to first heat the particle to the melting temperature and to then completly melt the particle. The particle is then free to assume its spherical shape due to the minimization of the surface energy as presented in [MUNZ, 1996].q = mCpdm - TQ) + mlm (2-3)
Where q is the energy transfer required to the particle to reach the critical point, ^ is the mass of
the particle, Cp is the specific heat of the material, Tm is the melting temperature of the
material, 10 is the initial temperature of the particle and ^m is the latent heat of fusion of the
material.The energy transferred to the particle does not however distribute itself as mentioned by
the equation. As shown by [BOURDIN, 1983], since the conductivity of materials are never
infinite, there is an actual gradient of temperature within the particle. There is the heating of the liquid phase to a temperature higher than that of the melting temperature and in cases of large temperature gradients, there can be an evaporation of a fraction of the material.Deviation from Equation 2-3 can occur depending on the thennophysical properties of the material considered. It must therefore simply be used as a reference point for comparison. Other factors as for example the kinetics of both the energy transfer and the mass transfer within the particle itself can also be limiting.
2.5 Dynamics of the Powder Spheroidization
As mentioned earlier, even though the thermodynamic state wanted is known, there is still the questions of dynamics. In the induction plasma processing of powders, their is two distinct
dynamics phenomenon present as shown in [PROULX et al., 1985 and 1987, MUNZ, 1996 and
BOULOS, 1978]. There is the dynamics which control the energy transfer and the dynamics which control the mass transfer.2.5.1 Heat Transfer Controlled^henomenon
The key parameter of the heat transfer dynamics is the residence time of the particles in the plasma discharge. It is known that for h.f. induction plasmas, the average residence time for a
particle can vary from 5 to 20 milliseconds as presented by [COULOMBE, 1994]. However, in
the same plasma, the particles will not all travel by the same pathways. This has for effect to create many different residence times for various particles with an exposure to differenttemperatures as seen in [PFENDER, 1989, PROULX et al., 1987 and BOULOS, 1978]. The
different trajectories are also greatly affected by the size of the particle
Other parameters which influence the residence time are recirculations present in the plasma due to the magnetic field and the inter particle collisions which are frequent under dense
loading conditions as previously shown in [MOSTAGHIMI et al., 1985].
Knowing the average residence time for r.f. induction plasmas, it is possible to estimate the quantity of energy which may be transferred to the particles. This can be done using the thermophysical properties of the particles and plasma combined with a chosen average residence time for the particular torch. The result can be used to determine if either the heat transfer
dynamics or the thermodynamic critical point will be the limiting factor for the processing of the
selected powder.2.5.2 Mass Transfer Controlled Phenomenon
The dynamics of mass transfer determine the time required for the complete melting of the particle. The thermophysical properties which are involved in such calculation are the molten liquid's density, surface tension and viscosity as presented by [CUFT, 1978]. The main dimensionless numbers used to determine the final shape of the particles are the Reynolds number, the Morton number and the Eotyos number. Even though the optimal final shape relative to the minimization of energy is spherical, forces from the drag, impurities or internal motion for example may affect the final shape of the particles.
However, as mentioned, most thermophysical properties are not available for such calculations. Previous experiments have very rarely shown final shapes other than spheres. If other shapes as ellipses are in the resulting powders, the usual observation is that the particle did not have the time to completely melt during the heating process. This is why most estimation of spheroidization efficiency of systems on particles are usually done experimentally as done by
[DIGNARD, 1997a, 1997b and 1998, FAN, 1994 and JIANG, 1994].
2.6 Spheroidization of Powders
Previous works have been done on the spheroidization of particles both experimentally and theoretically. Theoretical works, mostly numerical calculations, have been focused on the energy transfer to the particles during the induction plasma or arc plasma processes. There is
very little modelling which can predict if the particles will be spheroidized or more precisely,
determining the actual spheroidization efficiency of the plasma as seen in [MCKELLIGET, 1992,
BOULOS, 1978, PROULX et al., 1985 and 1987, and PFENDER, 1989]. This lack of practical
results requires attempts at an experimentally determined technique which could be used to predict and therefore optimize the spheroidization of particles..
Many experimental studies have also already been completed in the area of
spheroidization of particles as done by [ISHIGAKI et al., 1991, FAN, 1994 and JIANG, 1994].
However, most experimental approaches are directed at only one material since their experimental studies were aimed at subsequent use of the information. Their objectives were mostly oriented at the future deposition of the powders into substrates. The approach is thatknowing that the particles have been spheroidized, the critical point (thermodynamically) has
been attained and consequently a complete melting of the particles is assumed when 100% spheroidization efficiency is obtained.In the last decade, the production of high added value powders with constant size, properties and quality has been increasing. This trend follows the development in high performance materials and therefore creates also a demand for high quality pure raw products. From this avenue, the necessity for the obtention of tools for the prediction and optimization of the spheroidization efficiency for many materials gains ever more importance.
2.7 Densification of Powders
The densification of the powders while processing them by induction plasma has for long been an added advantage to the plasma technology. It is well known experimentally for the densification ofagglomerates. The undensifled original powders can be initially agglomerated by
techniques like spray-drying and consequently submitted to a plasma treatment to densify the
powders as presented in [PAWLOWSKI, 1995].
The densification of agglomerates by induction plasmas has also opened new fields in the areas of suspensions plasma processing. This process is the precursor to suspension plasma spraying. The process enables to create either powders from a mixture of reactive components
which are stabilized in a suspension as shown in [BOUYER, 1997'a, and 1997b]. In the first steps
of the process, the mixture is atomized for the rapid evaporation of the liquid and to allow the formation of small spherical shells which can subsequently be densified.There is however a physical limit to the possible densification of the powders other than
the theoretical density of the original materials. This has been theoretically studied and also
supported by experimental work as presented by [KLIMA et al., 1997]. A mathematical model was developed to determine the radius of the cavity which could remain at the interior of the spherical particle after the heat treatment. The initial parameters on which this theory is based isthe difference in densities between the material in its solid phase and in its liquid phase. The
formation of this cavity is initiated during the cooling of the particles. As the exterior of the
molten sphere solidifies, the pressure in the remaining melted material will decrease and eventually possibly create a cavity. The possible cavity would be due to the bubbling of the remaining molten material. Equation 2-4 can be used for an estimation of the radius of the resulting cavity within the obtained sphere.R
4—^1 --^)T ^-^
~ ~p^) ^
Where ^c is the radius of the final cavity, ^-0 is the radius of the initial droplet (molten
material), Pm is the density of the melted phase and Ps is the density of the solid phase. These
results mean that a spherical powder could in some cases, be less dense than the theoretical density of the material. It must be noted that the possibility of reabsorption of a gas was not considered. This latest assumption is applicable to the case of induction plasma processes sincethe solidification of the particles is rapid. This joined to the relatively low diffusion coefficients
of liquid materials of metals as presented by [SCHEmEL, 1954 and WILKE, 1949] could explain
the presence of cavities within some processed spherical powders.CHAPTERS
DEVELOPMENT OF SPHEROIDtZATION MODELS
The development of models which can predict the spheroidization efficiency of the
injected powders as a function of the powder feed rate is required. A model based on the energy transfer equation and other phenomena occurring during the process would be preferred to an empirical model. However, even if such a model will be developed, the previous lack of similar models even by numerical analysis can presume that the empirical models will be useful.3.1 Energy Transfer Model
An initial description of occurring phenomenons is required before modelling them. The changes with which the model is concerned occur within the particles. The initial energy
transferred to the particle will be used for the heating of the material up to its melting
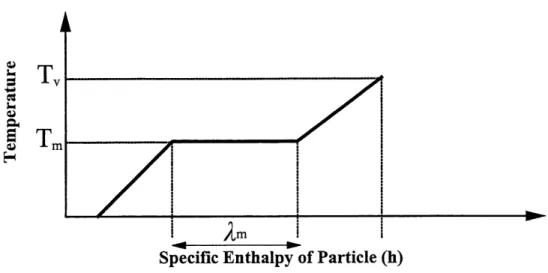
temperature. Thereafter, the melting of the solid phase into the liquid phase will occur. Even though the heating of the liquid phase and the subsequent evaporation of some material are not desired, they do occur since no material has an infinite thermal conductivity. These fours steps are described in Figure 3.1 by presenting the temperature profile of the particle as a function of its specific enthalpy for a case of infinite thermal conductivity.3.1.1 The Minimum Energy Requirements
With the first two stages of this process, and estimation of the required energy to be transferred to the particles can be obtained. Since this resulting value is particular for every
§
SB i-y?
»-1 <uft
I
<u •A-mH
t
^
I
I
I
Am i
Specific Enthalpy of Particle (h)
Figure 3.1 Temperature history of the particle during heating versus its specific enthalpy
different material used, it is a limiting parameter for the process. The minimum energy transfer to the particles can therefore be described by Equation 3-1.
Q=rh'Cp(Tm-TQ)+m^m
(3-1)
Where Q is the minimum energy transfer required, m is the powder feed rate, Cp is the specific heat of the material, T-m is its melting temperature, TQ is the initial temperature of the powder and ^m is the latent heat of fusion of the material.
The total energy transfer required for the complete melting of a powder will therefore increase linearly as a function of the powder feed rate. However, since the energy available from the plasma diminishes with an increasing load because of the cooling effect, a net reduction of the melting and therefore spheroidization efficiency will occur after a critical value of the powder
feed rate. This value will be attained when the energy which can be absorbed from the plasma is equal to the minimum energy transfer required by the particles. Beyond this critical point, the spheroidization efficiency will decrease with the increase of the powder feed rate.
3.1.2 Energy Transferred From the Plasma to the Particle
Now that a critical parameter has been determined for the particles, the energy which can be transferred to the particles must be determined. To do so, an evaluation of the efficiency of the r.f. induction plasma installation must be done. Two methods can generally be used. Firstly, if an average temperature for the plasma discharge can be determined, a general energy balance can be used. Using the assumption that during the travel of the particle through the plasma, the integral mean value of the thermal conductivity across the boundary layer is the only spatially varying plasma parameter, the heat net flux to the particle, ^, can be describe by Equation 3-2.
q=f^-Tp)-w(TJ,-Tt) (3-2)
Where K is the integrated mean thermal conductivity of the boundary layer, d^ is the powders mean diameter, Tco is the plasma average temperature, e is the emissivity, 0" is the Stefan-Boltzman constant, Tp is the particle temperature and Ta is the ambiant wall
temperature.
However, since the average temperature changes with increasing powder feed rate due to the cooling effect of the loading, this method can only be used for comparison between similar
plasma loading conditions. It can not be used to predict the process efficiency as a function of the powder feed rate without an estimation of the resulting average temperature changes caused by the overloading. Equation 3-2 can however be used to determine a parameter describing the energy transfer to a single particle for a desired average temperature.
3.1.3 The Melting and Spheroidization Efficiencies
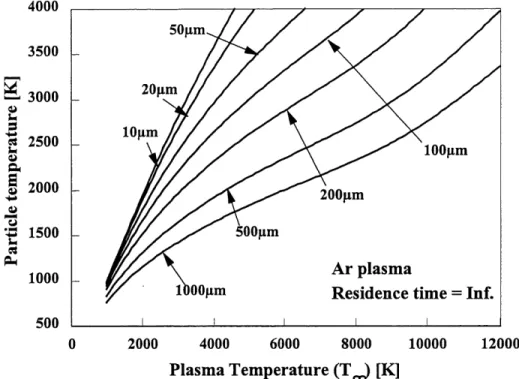
The energy transferred to a single particle can be used to determine if a specific powder with its thermophysical properties can actually be melted by the induction plasma. Since most of the heat losses from the particles are by radiation, it is normal to expect that larger particles can not attain an equilibrium temperature equivalent to smaller particles. This can be observed when simulating the heating of particles in a plasma with an infinite residence time. The results represent the maximum equilibrium temperatire than can be attained by a particle of known size
independently of the particles thermophysical properties except for its emissivity. The effect of
the size of particles on this possible equilibrium temperature is show in Figure 3.2 for particles with an emissivity of 1 in a pure argon plasma.From the results in Figure 3.2, we can see that an average residence time has to be known or estimated since not all particles can be melted as shown. It is known however, that residence times ranging from 5 to 20 ms are common for r.f. induction plasmas. So for an estimate of the maximum energy transferred to the particle, a value of 10 ms is taken. Comparing this heat flux to the minimum energy required represented in Equation 3-1, we obtain Equation 3-3. Equation 3-3 represents an estimate of the ratio between the energy transferred to the particle and the minimum energy required for the melting and spheroidization of the particles.
4000
3500|-^ 3000
<y ^ 3'§ 2500
u&
§ 2000
-4-» <u•g 1500
rt PH1000
500
SOnm. ZOpm lOfim lOOOnm 1 500pm 1 200pm Ar plasma Residence 1 lOO^m time = Inf. 12000 4000 6000 8000 10000
Plasma Temperature (T^) [K]
12000
Figure 3.2 The maximum temperature attained by particles of various size with infinite residence time in an argon plasma of various average temperature
6mA/
•i
Ratio =
^ J l^-Tp)-^(TAp-JAa)dt
(3-3)
mM[Cp(Tm-To)+im]
Where A t is the residence time chosen (10 ms), P is the density of the powder and tf is the time
required to melt the particle or the residence time if the time required to melt the particle is greater than the residence time.If the ration is much lower than 1, the melting of all the powders will not be possible. However, if the ratio is equal to 1, the melting of the powders at low feed rates is possible since the ratio is not a function of the feed rate. It must be noted that as it is defined, the ration can not be greater than 1. However, it can be seen that if the residence time is long enough for the
melting of the particles, the ratio is as mentioned equal to 1. As the diameter for the particle is increased, a maximum diameter at which the particle can be melted will be attained and the
efficiency of the system will subsequently diminish which is represented by the reduction of the
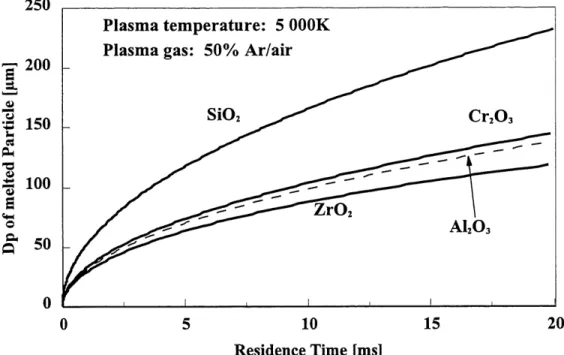
ratio. This is due to the ratio being a function of the powders mean diameter. We can also notice that the ratio is dependant on the plasma average free stream temperature. It is therefore not accurate for cases where there is cooling effects due to the loading of the plasma. The importance of this effect can however be seen with Equation 3-3. By verifying the ratio with various free-stream plasma temperatures, the effect of a reduction in the average free-stream temperature by loading can therefore be observed. The only missing information is the actual amount of cooling due to the variation in feed rate.To evaluate the effect of the chosen residence time on the resulting efficiencies, an evaluation of the latest can be performed for the powders which will be used. Since the residence time required depends not only on the size of the particles but also on the themiophysical properties of the materials, both must be taken into account. From Figure 3.3 which represent the required residence time for various kinds of powders as a function of the mean diameter, it can be seen that there are limiting diameters for the powders. This limiting diameter represent the diameter where a small increase in this one results in a large required increase in the needed residence time. Since that in the experimental cases, the residence times are similar from one powder to the next, we therefore know which materials are most likely to have acquired a sufficient amount of energy for their complete melting.
250
s
.A D u •o h -«(^
^
<u -4-> uE
<4-< 0&
0'200
150
100
50
Plasma temperature: 5 OOOK
Plasma gas: 50% Ar/air
SiO
5 10
Residence Time [ms]
15
20
Figure 3.3 Dependency of the diameter of various powders as a function of the residence time
The second method which can be used to evaluate the melting and spheroidization efficiency is a macroscopic approach. It has been experimentally tested that 70% of the power generated by the r.f. induction plasma installation is actually transferred into plasma energy.
From [PROULX, 1987], it has been determined that 13 to 18% of the total plasma power could
be absorbed by the particles for certain cases. The main point to retain is that initially, at low feed rates, the percentage is actually lower. However, the equilibrium is quickly reach at a certain key feed rate and does not change significantly thereafter. These results do include the cooling of the plasma flame. Therefore, from the combination of both these estimates, we can obtain the maximum energy which can be absorbed by the particles for the particular system. Knowing the required energy to completely melt the particles, and estimate of the spheroidization percentage can be obtain. The only unknown parameter is the actual energy which can beabsorbed by the particles for a particular system. So once it is known that the particles have the required thermophysical properties and time to reach the spheroidization stage under no loading as shown by Equation 3-3, Equation 3-4 would allow the estimation of the spheroidization efficiency of the induction plasma process for the powders. It is the ratio of the transferred energy to the minimum energy required for the melting process. As the initial equations were estimate, a correcting factor which has to be determine will have to be used to optimize the
model.
0.11Z(Pw)
Efficiency = ^^'^\ "^ „, ,1 (3-4)
[mCp(Tm-To)+m^Where Pw is the power supplied by the generator and Z is the correction factor. It must be noted
that if the result is above 1, it simply reflects that the spheroidization efficiency should be 100%.
The factor of 0.11 present is simply the average of previous works such to minimize the importance of the correction factor.3.2 Empirical Model
The choice of the empirical model to be applied is initially based on the behaviour
expected for the experimental results. In the case of the spheroidization efficiency, we can expect for particles with thermophysical properties that allows them to be completely melted to have an efficiency of 100% until a critical feed rate is reached. After this critical feed rate, we can expect a gradual decrease in the efficiency of the system. It is also expected that an actual 0% efficiency will only occur at extreme feed rates due to the small but finite chance that a few particles withpreferential contact with the plasma flame will remain present. So the empirical model which will be used to attempt a prediction of the spheroidization efficiency is presented in Equation 3-5.
[l+(coF)2]n <3-5)
Where F is the powder feed rate in g/min, ^Q, <^, and n are the characteristic parameters of the equations. We can observe that for a case where there is an infinitely small feed rate (few or
single particle) the spheroidization efficiency is simply equal to ^Q which is 100% for particles
with thermophysical properties that allows the particles to be completely melted during its flight
through the plasma. The other two parameters do not have explicit physical representation as does ©0 which represent the efficiency of the system to melt a single particle.The model suggested does however apply itself only for one set of experimental data. This meaning that once a set of efficiencies has been obtain, the parameters of the model can in turn be determined by an optimization of the fitting. The obtain parameters can be applied in the future only for powders of identical thennophysical properties, diameter included. This is useful for a process where the raw powders properties are constant but it lacks any flexibility for variations in either diameter or thermophysical properties.
3.3 Experimental Evaluation of the ]V[odel Parameters
The use of semi-empirical model is to isolated one or many variable of the process in order to identify their effect on the observed parameter. For the spheroidization of particles, the
key parameters for the thermophysical properties of the powders are the density, the thermal conductivity, the specific heat, the melting temperature, the latent heat of fusion and the mean diameter of the particles. It must be noted that many other parameters could be identified but
limiting the number of variables has for purpose to simplify the resulting model.
3.3.1 Mean Diameter Based Empirical Model
The only parameter which can be isolated for the particles is the particles mean diameter as all the other thennophysical properties vary between the different material and can not be isolated. Therefore another model can presented as shown in Equation 3-6.
<^AF1
.^
(3-6)
[l^Dj^}adDP'
Where the subscript d relates to the model with the isolation of the mean diameter and ^x is the function which describes the effect of only the diameter on the efficiency of the system.
To obtain a relation for ^x, experiments of with identical plasma conditions must be performed. These experiments ought to vary only in the mean diameter of the particles. The particles will have to be of a certain material with known constant themiophysical properties. Once the effect of the diameter on the spheroidization efficiency is known, the function is introduced in the model and the new values of the parameters can be determine. It must be noted that this model will be useful when a process is used with constant plasma conditions and with powders of identical thermophysical properties. If the raw powders do change in mean diameter
during a period of production, the process can be re-optimized with the help of the model. The remaining parameters which can not be predicted is the other thermophysical properties mentioned earlier.
3.3.2 Thermophysical Properties Based Empirical Model
This model is the logical approach following the model presented in Equation 3-6. The
objective of this following model is to isolate the contribution of all the other themiophysical
parameters on each of the three model parameters. The remaining unknown parameters will therefore only be function of the operating plasma conditions as is shown in Equation 3-7.@TDjlpakbCcpTi^T(,
^ ^ ————^—^ (3-7)
) pSktC^T]n^iTX,[l+^TpSkhCp^m^r,Dj2F)^'^p p-—P±mw
Where the exponents of the thermophysical properties are constants and the subscript r relates to the model containing all the themiophysical properties.
The obtain model might look very complicated but since most parameters are constant,
the use of the model will be quite simple and relies only on the thermophysical properties of the
powders. It must be noted that to obtain the values of the constants presented in the model, experiments with various powders (i.e. different thermophysical properties) must be completed under identical plasma conditions. This latest condition is due to the necessity to identify the remaining unknown parameters @T,COT and HT- Once the experiments are complete, the fitting of the model on the data must be optimized while the constants a-j and q-x are identical for all thepowders used and therefore determining the effect of each individual thermophysical property on each original parameter of the model. The resulting model should therefore be useful to predict the process efficiency for any powders under the specified plasma conditions. The only parameters to be determined subsequently would be the three base parameters. Once these would be determine for a plasma operating condition, the prediction of the spheroidization efficiency could be obtained. The model can also be used to isolate the variable which have the greatest effect on the process by comparing the exponents of these.
CHAPTER 4
EXPERIMENTAL APPARATUS AND OPERATING CONDITIONS
In the first parts of this chapter, the spheroidization experimental set-ups shall be
described. It will be followed by a description of the powder feeders used during the processing
of the various powders. The equipment used for the analysis of raw and resulting powders will also be presented.4.1 Plasma Spheroidization Installations
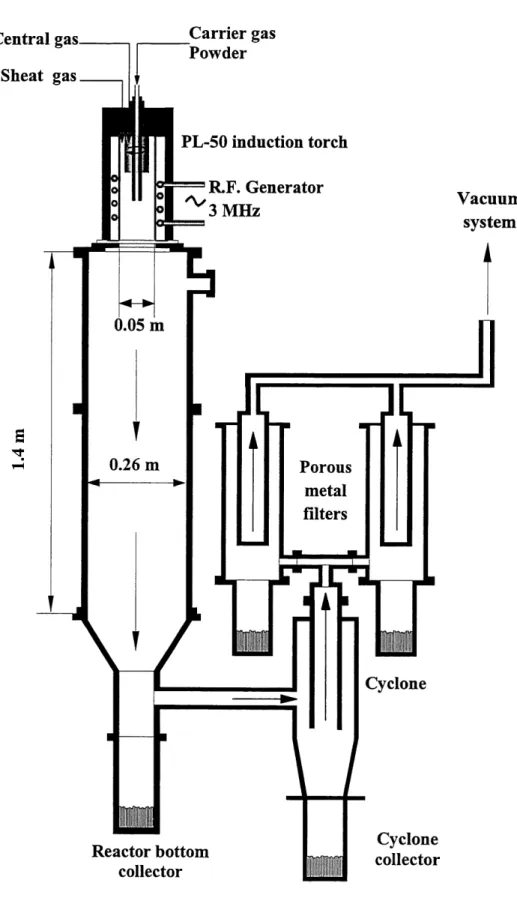
Figure 4.1 and Figure 4.2 are schematic representations of the two complete r.f. induction plasma installations used in the present study. Figure 4.1 represents the 3 MHz frequency set-up with a maximum available power of 50 kW. Figure 4.2 represents the 0.3 MHz frequency set-up with a maximum output power of 100 kW. Both installations also include an induction plasma torch, a vacuum system, a reaction chamber, powder collecting systems and controls for the gas
flow-rates.
4.1.1 Induction Plasma Torch
A schematic diagram of the plasma induction torch is presented in Figure 4.3. The inner walls of the torch are made of a cylindrical ceramic tube with an inner diameter of 50 mm. The ceramic wall is surrounded by the induction coil which had either four or five turns depending on the composition of the gases injected in the torch. The gases are introduced in the central region
of the torch through a distributor which is located at the top of the torch. The sheath gas (Q3) is
Central gas
Sheat gas
Carrier gas Powder PL-50 induction torch R.F. Generator3MHz
g
^-Vacuum system Porous metalfilters
S=F?S
JL
1^1
Cyclone Reactor bottom collector Cyclone collectorFigure 4.1 Schematic representation of the 3 MHz experimental set-up
36
Central gas
Sheath gas
PL-50 INDUCTION
TORCH
Carrier gas & powder
R.F. Generator 0.3MHz (^ i< (^1 Vacuum system
Figure 4.2 Schematic representation of the 0.3 MHz experimental set-up
37
4.22 mm ID 6.35 mm 01
^i 19 mm
Figure 4.3 Schematic diagram of the induction plasma torch
injected along the ceramic tube to reduce the heat flux to the inner walls of the tube. The plasma
gas (Q2) is introduced tangentially to stabilize the plasma discharge. The carrier (Ql) gas is
injected at the centre of the torch through a high pressure water cooled stainless steel probe. It is through the probe that the powders are injected along with the carrier gas. There is an added stainless steel constriction at the tip of the torch which stabilizes the plasma and links the torch to the reactor chamber. All parts of the torch are water cooled for the exception of the quartzconfinement tube. The tube delays the mixing of the sheath and plasma gases to avoid overloading the plasma region due to the high flow rate of the sheath gas.
The flow rates of the gases fed to the torch are regulated and monitor through gas flow meters for both induction plasma installations.
4.1.2 Power Generators
In the first h.f. induction plasma installation shown in Figure 4.1, the high frequency generator of model TAFA 32*50 MC was build by Lepel. The maximum available power output is 50 kW and its oscillator operates at a frequency of 3 MHz. The maximum plate courant is of
12 A and the maximum plate potential is of 12 kV. The power for the installation is regulated by
a simple rheostat.For the second h.f. induction plasma installation seen in Figure 4.2, the high frequency generator of model T-100-3-KC-TL was also build by Lepel. As mentioned, its maximum power is of 100 kW and the oscillator operates at a frequency of 0.3 MHz. The plate courant is maintained below 15 A and the plate potential may approach 13 kV. The power to the plasma torch is also regulated by a simple rheostat.
4.1.3 Spheroidization Chambers
The dimensions of the two spheroidization chambers are not identical as seen in Figure 4.1 and Figure 4.2. However, they both have walls which are made of pairs of concentric water-cooled, stainless steel tubes. Both reaction chambers have connection which can be
. iapted to the exit of the induction torch. The bottom of the chambers are used to collect the powders after they have been injected tb-ough the plasma. The presence of quartz windows in the chambers allows the operator to verify if the plasma is ignited and stable from the control panel of the power generator. Both reaction chambers are connected to the vacuum system and a powder collection system.
4.1.4 Powder Collection Systems
The laboratory is equipped with a vacuum pump which can be used for all the installations which require a vacuum. The installation seen in Figure 4.2 is simply connected to a cyclone for the collection of particles. The vacuum within the chamber is applied true the cyclone and therefore all exiting gases and powders flow into the cyclone where smaller particles can be collected.
The other induction plasma installation as seen in Figure 4.1 is also connected to a cyclone. However, the gases and the particles which escape the cyclone are then sent through two filters. The two filters are build ofporous metal and can capture particles as fine as 5p.m. The disadvantage to having filters after the cyclone is that since the vacuum is applied through the filters, the accumulation of fine particles on the filters increases the pressure drop accross the filter. After a certain operation period, the desired pressure in the chamber can no longer be maintained due to the particulate cake formed on the filters. The only material loss with this system is the particles which are smaller than 5p,m and the material which remained in the vapour
4.2 Powder Feeders
During all the experiments performed, a total of three different powder feeder were used. The necessity of having different powder feeder was due to the wide variety of powders and their different sizes. The powder feed rate required also determined which powder feeders could be
used.
The first powder feeder was used for its high feed rate capacity and because some powders had a very large average diameter. The largest of particles where in the range of 250-300 (im. The powder feeder was a screw feeder with a screw of 16 mm diameter which did allow for a high feed rates. The exit size of the powder feeder also allowed for a powder injection by gravitation alone. This feature minimized the velocity of the powders and consequently increased their residence time in the plasma flame. The disadvantage to this powder feeder was that its total mass was above 30 kg without any powders and could not be easily emptied. This complicated the evaluation of the powder consumption. Calibration curves based on the rotational speed of the screw had to be completed prior to the experiments.
The second powder feeder used was also a screw feeder. The diameter of the screw was 6.5 mm and therefore was preferred for fine powders. This powder feeder could also be easily emptied by tilting. This presented an easy way of determining the powder feed rates. The mass of powder in the powder feeder was simply weighed before and after each experiment consequently determining the amount of powder processed. A carrier gas had to be used to carry the powders pneumatically to the torch. Having a smaller screw did also reduce the maximum feed rate output therefore limiting the use of this powder feeder to low and medium feed rates.
The third powder feed rate used was a vibrating powder feeder. The amount of vibration would determined the resulting feed rate. The advantage of this powder feeder is that it could handle fine powders at very high feed rates. Therefore, this powder was used when the feed rates were to high for the small screw powder feeder. The vibrating feeder could also be weighed before and after experiments allowing for the determination of the powder feed rate. A carrier gas also had to be used to convey the powders to the torch.
4.3 Analysis Techniques
Many different equipment was used to perform various analysis of the original and
resulting powders. The parameters which had to be determined were the particles average diameters, the composition of the powders, the resulting degree of spheroidization and a verification of the presence or absence of cavities within the processed powders.4.3.1 Degree of Spheroidization
To obtain the degree of spheroidization of the resulting particles, image analysis was used. Initially, pictures of samples from the powders were taken. If the particles diameters were large enough, an optical microscope of model Metallux 3 manufactured by Leitz was used. If the optical microscope could not obtain clear pictures of the particles, an scanning electron microscope (SEM) of model JEOL JSM-840A was available. Once the pictures where obtained, they were analysed with an image analysis software. The Mocha software from Jandel Scientific was used. The spheroidization degree was evaluated on a numerical base rather than by mass percentage. The selection was done visually with two principal guidelines to confirm if particles where to be considered spherical. The first requirement was that the ratio of the shortest distance