HAL Id: tel-02861062
https://tel.archives-ouvertes.fr/tel-02861062
Submitted on 8 Jun 2020HAL is a multi-disciplinary open access archive for the deposit and dissemination of sci-entific research documents, whether they are pub-lished or not. The documents may come from
L’archive ouverte pluridisciplinaire HAL, est destinée au dépôt et à la diffusion de documents scientifiques de niveau recherche, publiés ou non, émanant des établissements d’enseignement et de
Modeling and simulation of droplets growing on
patterned substrates during dropwise condensation
Solmaz Boroomandi Barati
To cite this version:
Solmaz Boroomandi Barati. Modeling and simulation of droplets growing on patterned substrates during dropwise condensation. Other. Université de Lyon, 2018. English. �NNT : 2018LYSEM018�. �tel-02861062�
N°d’ordre NNT : 2018LYSEM018
THESE de DOCTORAT DE L’UNIVERSITE DE LYON
opérée au sein de
MINES Saint-Etienne
Ecole Doctorale
N° 488
Sciences, Ingénierie, Santé
Spécialité de doctorat
: IMAGE, VISION, SIGNALSoutenue publiquement le 09/10/2018, par :
(Boroomandi-Barati Solmaz)
Modeling and simulation of
dropwise condensation on textured surfaces
Devant le jury composé de :
Président : Gruy, Frédéric
Harmand, Souad Professeur, Université Valenciennes Rapporteure Mongruel, Anne Maître de conférence, Sorbonne Université Rapporteure
Gruy, Frédéric Professeur , Mines Saint-Etienne Examinateur
Pupier, Christophe R&D, Institut de Recherches En Ingénierie
des Surfaces (groupe HEF) Examinateur
Gavet, Yann Maître–Assistant, Mines Saint-Etienne Directeur de thèse Pinoli, Jean-Charles Professeur, Mines Saint-Etienne Co-directeur de thèse Valette, Stéphane Maître de conférence, École centrale Lyon Co-directeur de thèse
ABSI Nabil MR Génie industriel CMP
AUGUSTO Vincent CR Image, Vision, Signal CIS
AVRIL Stéphane PR2 Mécanique et ingénierie CIS
BADEL Pierre MA(MDC) Mécanique et ingénierie CIS
BALBO Flavien PR2 Informatique FAYOL
BASSEREAU Jean-François PR Sciences et génie des matériaux SMS BATTON-HUBERT Mireille PR2 Sciences et génie de l'environnement FAYOL
BEIGBEDER Michel MA(MDC) Informatique FAYOL
BLAYAC Sylvain MA(MDC) Microélectronique CMP
BOISSIER Olivier PR1 Informatique FAYOL
BONNEFOY Olivier MA(MDC) Génie des Procédés SPIN
BORBELY Andras MR(DR2) Sciences et génie des matériaux SMS
BOUCHER Xavier PR2 Génie Industriel FAYOL
BRODHAG Christian DR Sciences et génie de l'environnement FAYOL
BRUCHON Julien MA(MDC) Mécanique et ingénierie SMS
CAMEIRAO Ana MA(MDC) Génie des Procédés SPIN
CHRISTIEN Frédéric PR Science et génie des matériaux SMS
DAUZERE-PERES Stéphane PR1 Génie Industriel CMP
DEBAYLE Johan MR Sciences des Images et des Formes SPIN DEGEORGE Jean-Michel MA(MDC) Génie industriel Fayol DELAFOSSE David PR0 Sciences et génie des matériaux SMS
DELORME Xavier MA(MDC) Génie industriel FAYOL
DESRAYAUD Christophe PR1 Mécanique et ingénierie SMS DJENIZIAN Thierry PR Science et génie des matériaux CMP
DOUCE Sandrine PR2 Sciences de gestion FAYOL
DRAPIER Sylvain PR1 Mécanique et ingénierie SMS
FAUCHEU Jenny MA(MDC) Sciences et génie des matériaux SMS
FAVERGEON Loïc CR Génie des Procédés SPIN
FEILLET Dominique PR1 Génie Industriel CMP
FOREST Valérie MA(MDC) Génie des Procédés CIS
FRACZKIEWICZ Anna DR Sciences et génie des matériaux SMS
GARCIA Daniel MR(DR2) Sciences de la Terre SPIN
GAVET Yann MA(MDC) Sciences des Images et des Formes SPIN GERINGER Jean MA(MDC) Sciences et génie des matériaux CIS GOEURIOT Dominique DR Sciences et génie des matériaux SMS GONDRAN Natacha MA(MDC) Sciences et génie de l'environnement FAYOL GONZALEZ FELIU Jesus MA(MDC) Sciences économiques FAYOL GRAILLOT Didier DR Sciences et génie de l'environnement SPIN
GROSSEAU Philippe DR Génie des Procédés SPIN
GRUY Frédéric PR1 Génie des Procédés SPIN
GUY Bernard DR Sciences de la Terre SPIN
HAN Woo-Suck MR Mécanique et ingénierie SMS
HERRI Jean Michel PR1 Génie des Procédés SPIN
KERMOUCHE Guillaume PR2 Mécanique et Ingénierie SMS KLOCKER Helmut DR Sciences et génie des matériaux SMS LAFOREST Valérie MR(DR2) Sciences et génie de l'environnement FAYOL
LERICHE Rodolphe CR Mécanique et ingénierie FAYOL
MALLIARAS Georges PR1 Microélectronique CMP
MOLIMARD Jérôme PR2 Mécanique et ingénierie CIS
MOUTTE Jacques CR Génie des Procédés SPIN
NEUBERT Gilles FAYOL
NIKOLOVSKI Jean-Pierre Ingénieur de recherche Mécanique et ingénierie CMP
NORTIER Patrice PR1 Génie des Procédés SPIN
O CONNOR Rodney Philip MA(MDC) Microélectronique CMP
OWENS Rosin MA(MDC) Microélectronique CMP
PERES Véronique MR Génie des Procédés SPIN
PICARD Gauthier MA(MDC) Informatique FAYOL
PIJOLAT Christophe PR0 Génie des Procédés SPIN
PINOLI Jean Charles PR0 Sciences des Images et des Formes SPIN
POURCHEZ Jérémy MR Génie des Procédés CIS
ROUSSY Agnès MA(MDC) Microélectronique CMP
ROUSTANT Olivier MA(MDC) Mathématiques appliquées FAYOL
SANAUR Sébastien MA(MDC) Microélectronique CMP
STOLARZ Jacques CR Sciences et génie des matériaux SMS TRIA Assia Ingénieur de recherche Microélectronique CMP VALDIVIESO François PR2 Sciences et génie des matériaux SMS
VIRICELLE Jean Paul DR Génie des Procédés SPIN
EMSE : Enseignants-chercheurs et chercheurs autorisés à diriger des thèses de doctorat (titulaires d’un doctorat d’État ou d’une HDR)
Spécialités doctorales Responsables :
SCIENCES ET GENIE DES MATERIAUX K. Wolski Directeur de recherche MECANIQUE ET INGENIERIE S. Drapier, professeur GENIE DES PROCEDES F. Gruy, Maître de recherche SCIENCES DE LA TERRE B. Guy, Directeur de recherche SCIENCES ET GENIE DE L’ENVIRONNEMENT D. Graillot, Directeur de recherche
Spécialités doctorales Responsables
MATHEMATIQUES APPLIQUEES O. Roustant, Maître-assistant INFORMATIQUE O. Boissier, Professeur SCIENCES DES IMAGES ET DES FORMES JC. Pinoli, Professeur GENIE INDUSTRIEL N. Absi, Maitre de recherche MICROELECTRONIQUE Ph. Lalevée, Professeur
à jo u r : 0 3 /0 2 /2 0 1 7
Acknowledgement. . . xii
List of publications . . . xiii
Summary . . . 1
Résumé . . . 4
General introduction . . . 6
0.1 General issue . . . 6
0.2 Dropwise and filmwise condensation . . . 8
0.2.1 Effect of topography . . . 9
0.2.2 Effect of chemical coatings . . . 10
0.3 Dropwise condensation . . . 10
0.3.1 Droplets nucleation . . . 11
0.3.2 Droplets growth . . . 17
0.3.3 Steady state . . . 17
0.4 Spatial distribution . . . 18
0.4.1 Poisson point process and Matern hardcore . . . 19
0.4.2 Ripley’s function . . . 20
0.4.3 Fry plot . . . 23
0.5 Droplets temporal distribution . . . 24
0.6 Droplets size distribution function . . . 28
0.7 Algorithms for simulating dropwise condensation . . . 33
0.8 The aim of this study . . . 38
0.9 Conclusion. . . 41 0.9.1 English . . . 41 0.9.2 French . . . 41 1 Experimental Procedure 42 1.1 Introduction . . . 42 1.1.1 French . . . 42 1.1.2 English . . . 42 1.2 Experimental set-up . . . 43 1.3 Surface preparation . . . 44 1.4 Surface Characterization . . . 46
1.4.1 Surface characterization of the metallic molds . . . 50
1.4.2 Surface characterization of the polycarbonate samples . . . 53
1.5 Statistical analysis of sinusoidal surface characteristics . . . 62
CONTENTS
1.6.1 English . . . 68
1.6.2 French . . . 68
2 Image processing method 69 2.1 Introduction . . . 69
2.1.1 French . . . 69
2.1.2 English . . . 69
2.2 Image processing technique for the droplets on flat and sinusoidal surfaces . 72 2.2.1 Preprocessing . . . 72
2.2.2 Segmentation . . . 72
2.2.3 Reconstruction . . . 75
2.3 Image processing technique for the droplets on pillared surface. . . 75
2.3.1 Pillar characterization . . . 77 2.3.2 Image categorization . . . 80 2.3.3 Drop identification . . . 81 2.3.4 Algorithm verification . . . 87 2.4 Conclusion. . . 90 2.4.1 English . . . 90 2.4.2 French . . . 90
3 Modeling and simulation 91 3.1 Introduction . . . 91
3.1.1 French . . . 91
3.1.2 English . . . 92
3.2 Model that considers droplets as spherical-caps . . . 94
3.2.1 Initial nucleation . . . 95
3.2.2 Adsorption . . . 95
3.2.3 Coalescence . . . 99
3.2.4 Nucleation of new droplets. . . 101
3.2.5 Departure of big droplets . . . 102
3.2.6 Drop-size distribution function . . . 102
3.2.7 Algorithm for generating circular droplets on flat substrates . . . 105
3.3 Model that considers droplets as ellipsoids . . . 106
3.3.1 Adsorption . . . 108
3.3.2 Coalescence . . . 110
3.3.3 Algorithm for generating ellipsoidal droplets on pillared substrates . 115 3.4 Model that considers droplets as semi-ellipsoids . . . 117
3.4.1 Adsorption of semi-ellipsoidal droplets . . . 119
3.4.2 Coalescence of semi-ellipsoidal droplets . . . 122
3.4.3 Sliding of big droplets and equivalent radius . . . 123
3.4.4 Surface area . . . 123
3.4.5 Algorithm for generating semi-ellipsoidal droplets on sinusoidal sub-strates . . . 124
3.5 Conclusion. . . 125
3.5.1 English . . . 125
4 Results and discussion 127
4.1 Summary . . . 127
4.1.1 French . . . 127
4.1.2 English . . . 127
4.2 Results of the spherical-cap model on flat substrates . . . 127
4.2.1 Droplets growth procedure. . . 127
4.2.2 Droplets spatial distribution . . . 130
4.2.3 Effect of wall temperature . . . 131
4.2.4 Effect of initial nucleation site density . . . 134
4.2.5 Drop-size distribution function . . . 135
4.3 Results of the ellipsoidal model on pillared substrates. . . 139
4.4 Results of the semi-ellipsoidal model on sinusoidal substrates . . . 145
4.4.1 Droplets growth procedure. . . 145
4.4.2 Droplets spatial distribution . . . 152
4.5 Conclusion. . . 155 4.5.1 English . . . 155 4.5.2 French . . . 159 General conclusion . . . 162 Conclusion générale . . . 165 perspectives . . . 168
List of Figures
1 (a) Spherical droplets on a flat substrate, (b) ellipsoidal droplets on a tex-tured substrate. . . 2
2 Schematics of (a) a spherical-cap (b) an ellipsoid (contact angle with surface is 90◦), and (c) a semi-ellipsoid (contact angle with surface is θ). . . . . 2
1 Light reflection because of droplets formation on the glassy substrates. This phenomenon can happen on the interior side of the car light shields at the foggy days and will reduce the efficiency of illumination. . . 6
2 Changes in contact angle and radius of the droplet during evaporation [1]. Stage I: the radius of droplet is constant while, its contact angle is decreasing. Stage II: the droplet becomes smaller in the same contact angle. Stage III: both the radius and contact angle decrease at the same time. . . 7
3 (A) Cassie-Baxter and (B) Wenzel droplets on textured surfaces (image from [2]). . . 9
4 Optical images of the nucleation and growth of water condensation on var-ious super hydrophobic surface geometries [3]. . . 13
5 Control of droplet coalescence by changing the geometrical features sizes [3]. 14
6 Two methods for tessellation the surface of nucleation [4].(a) Voronoi di-agram based on the distances to the bubbles’ centers (red circles). One Voronoi cell with area Avor associated with the bubble center marked as a
filled red circle is shown. (b) Modified Voronoi diagram based on the dis-tance to the bubbles’ triple contact lines (pink lines). One modified Voronoi cell with area A associated with the bubble footprint (with area a) colored in pink is shown. . . 15
7 Effective parameters on the droplets nucleation density [5]. (a) Effect of contact angle without coating, (b) effect of coating layer thickness, (c) effect of contact angle on a coating with δ = 0.1µm and λ = 0.25W/m.K, (d) effect of thermal conductivity of the coating layer. . . 16
8 Changes of a specified parameter M during time. The blue level illustrates the amount or value M in the system. If this level does not change during time, the system is at steady state step. . . 18
9 The main idea of Ripley’s function is to count the number of points that are in distance r from center. . . 21
10 Ripley’s L function, the straight line represents the Ripley’s L function of Poisson point process. Positive and negative deviations from this line indicate dispersion and clustering of the points. . . 22
11 (a) Conical and (b) cylindrical elements for Kdir function. Meaning that
this cone or cylinder sweeps the area around a center point and detects the number of points in the sweeping area. Then, after 360◦ its radius increases
by a small amount like ǫ [6]. . . 22
12 An example of Fry plot with fitted an ellipsoid in the vacant zone at origin. Image from [7]. . . 23
13 Comparison of three PDFs for a certain rain drops within T = 600min and µ = 183drops/min [8]. The distribution of P (X = k) depends on the shape of f(µ(t)). . . 25
14 The PDF of a Poisson and Poisson mixture distribution for rain drops com-pared with real observed data over T = 900min and t = 10min in [8].
. . . 26
15 Coalescence model of two droplets . . . 32
16 Drop size distribution for condensation of saturated steam at 100oC with
Ns= 5×l06cm−2. A , ∆T = 1oC ; B, ∆T = 4oC. broken line, experimental
data [9]. . . 34
17 Flow diagram of computer simulation used by Earl et al. to simulate droplet growth [10] . . . 36
18 Flow diagram of computer simulation used by Burnside and Hadi to simulate droplet growth [11] . . . 37
19 Comparison of drop distribution between random fractal model and photog-raphy. (a) random fractal model, (b) close-up photography of condensing surface [12] . . . 38
20 Determination of P (probability of finding a droplet in a grid) [13]. P can be calculated as the fraction of area covered by the droplets at each instance. 39
21 Differences between shape of droplets on the flat and pillared surfaces, (a) spherical droplets growing on a flat surface, (b) elliptical droplets growing on a micrometric pillared surface. The small points in image (b) are the texturing patterns. . . 40
1.1 Illustration of experimental set up. (a) Top view, (b) Closer view of the humid chamber and CCD camera. The parts that are marked in (a) cor-respond to: 1) light for taking high quality images, 2) humid chamber, 3) gas inlet, 4) gas outlet 5) cold substrate, and 6) CCD camera, (c) schematic diagram of the whole system. . . 44
1.2 Four main steps of dropwise condensation including: (a) initial nucleation, (b) growth due to adsorption, (c) growth due to coalescence and nucleation of new small droplets, and (d) departure of big droplets. . . 45
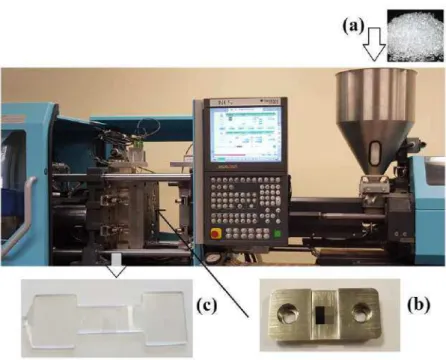
1.3 Illustration of the injection press system. (a) Polymer granulates, (b) metal mold (the small squares are the sinusoidal surfaces), (c) polymeric textured surfaces that will be used as substrates in dropwise condensation experiments. 46
1.4 Schematic illustration of pillars dimensions that are mentioned in table 1.1. 47
1.5 Optical microscope images of 6 polycarbonate pillared surfaces. The black points represents the pillars with radius and heights according to table4.1. The size of the substrate in all these images is 3.2mm × 2.7mm. . . 48
LIST OF FIGURES
1.6 Optical microscope images of 6 examples of polycarbonate sinusoidal
sur-faces. The size of the substrate in all these images is 3.2mm × 2.7mm. . . . 49
1.7 SEM microscopic images (magnification ×311) of the sinusoidal surfaces. λ and a here are the period and amplitude of the sinusoidal profiles. . . 51
1.8 Three dimensional images produces by the interferometric microscope. λ and a represent the period and amplitude of the sinusoidal profiles. . . 52
1.9 Two dimensional roughness profile of the configuration 30-5. This plot can be used to measure the roughness parameters . . . 53
1.10 SEM microscopic images of the sinusoidal surfaces on polycarbonate sam-ples. λ and a here are the period and amplitude of the sinusoidal profiles. . 55
1.11 Three dimensional microscopic illustration of 6 pillared substrates with 50× magnification. The colored bar on the right hand side of each image mea-sures the height of the pillars. Meaning that each color on this bar corre-sponds to a value on µm, so for measuring the height of each pillar it is enough to find the value corresponds with the color of it’s top head. . . 57
1.12 Illustration of two dimensional roughness profile of the six pillared sub-strates. At each graph, X is the distance between the pillars. . . 58
1.13 Illustration of two dimensional roughness profile of the six pillared sub-strates. At each graph, X and Z represent the radius and height of the pillars, respectively. . . 59
1.14 Illustration of contact angle measurement set-up. (a) the substrate sup-port, (b) the syringe for injection water droplets on the substrate, (c) light source, and (d) the CCD camera that acquires images of droplets sited on the substrate. . . 61
1.15 Contact angle of droplets on sinusoidal surfaces. λ and a being the period and amplitude of the sinusoidal profiles. In this images the sinusoidal profiles are perpendicular to the base lines of the droplets. . . 63
1.16 Pareto charts of the effects of λ and a on (a) θ and (b) Ra . . . 65
1.17 Residual plots of θ at α = 0.05. . . 67
1.18 Residual plots of Raat α = 0.05. . . 67
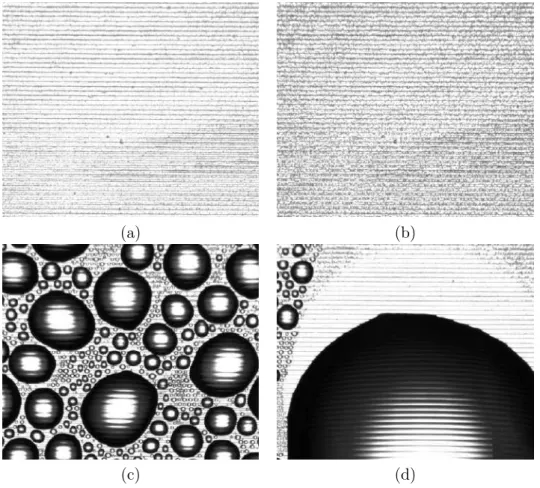
2.1 Droplets on the (a) flat and (b) sinusoidal substrates are distinguishable from the substrates. Due to similarity between the images on the flat and sinusoidal substrates, the same segmentation algorithm is used for the im-ages of these two kinds of substrates. . . 71
2.2 (a) A pillared surface without droplets. (b) Adsorbing and (c) coalescing droplets on the same pillared substrate. The droplets are not easily de-tectable from the pillars so a more complicated image processing technique is required. . . 73
2.3 Image pretreatment by Laplacian filtering. (a) Original image, (b) filtered image . . . 74
2.4 Reconstruction step. (a) Binarized image before reconstruction, (b) Dis-tance map, (c) Watershed partitioned image, (d) Binarized image after re-construction . . . 76
2.5 The segmented images of droplets growing on the flat substrate at different time steps (t = 10, 300, 700, 5000 s). These time steps correspond to initial
nucleation, adsorption, coalescence, and steady state steps.. . . 77
2.6 Schematic diagram of the image processing algorithm on pillared substrate . 78 2.7 Algorithm for pillar characterization . . . 79
2.8 Equivalent circle determination . . . 80
2.9 The changes in number of the major peaks in gray-tone histograms on time. Since the size of droplets is changing, the gray-tone histograms shows differ-ent number of peaks at differdiffer-ent time steps. Based on the number of these peaks we can categorize the droplets in the four categories: very small, small, medium, and big droplets. . . 81
2.10 Intensity histogram of (a) very small droplets at t = 100 s, (b) small droplets at t = 200 s, (c) medium droplets at t = 500 s and (d) big droplets drops at t = 1500 s. . . 81
2.11 Image of very small drops on a pillared surface. . . 82
2.12 Algorithm for very small drops. . . 83
2.13 Image of small drops on a pillared surface. . . 84
2.14 Algorithm for small drops. . . 84
2.15 Image of medium drops on a pillared image. . . 85
2.16 Algorithm for medium drops. . . 86
2.17 Image of big drops on a pillared image. . . 87
2.18 Algorithm for big drops. . . 88
2.19 Schematic diagram of parameters using for algorithm validation. The blue solid circle represents the real droplets captured in the original image and the red dashed circle is the droplet detected by the image processing algorithm. Therefore, T P represents the part of the real droplet that is detected by the algorithm, F P is the part detected falsely by the algorithm, F N shows the part which is not detected by the algorithm but presents in the initial image, and T N is the part that is not detected by the algorithm and dose not present in the original image. . . 89
3.1 (a) Spherical droplets on a flat substrate, (b) ellipsoidal droplets on a tex-tured substrate. . . 93
3.2 A spherical cap is a part of a sphere that is cut by a plain with distance h from the center of sphere and its contact angle with surface is not equal to 90◦. . . . 94
3.3 (a) Nucleation of the initial droplets that is completely randomly based on Poisson point process. (b) Ripley’s L function corresponding to this image is the same as Ripley’s L function of Poisson point process (F (x) = x). . . . 95
3.4 There are two main heat transfer resistances through a droplet: conduction resistance (RConduction) and convection resistance (RConvection). . . 96
3.5 Thickness of boundary layer dtat each point P of a sphere with temperature Ts that is immersed in a fluid of temperature T∞ depends on the angle between P and the bottom of the sphere ϕ. . . 99
3.6 Multiple coalescence: two big droplets adsorb each other and swallow the small droplets in their between. . . 101
LIST OF FIGURES
3.7 Probability density function (PDF) of number of droplets in each size range at three time steps: (a) t = 200s, (b) t = 2500s , (c) t = 5000s. . . 102
3.8 Schematic diagram of the simulation algorithm for generating circular droplets on flat substrate . . . 107
3.9 Comparison between the shape of small and big droplets on a pillared sub-strate. Small droplets tend to form more elliptical shapes due to adhesion with surface texturing, while big droplets present more spherical shapes in order to occupy less surface. The size of the image is 3.3mm × 2.7mm. . . . 108
3.10 Schematic of (a) spherical droplets and (b) ellipsoidal droplets in two planes (X-Y ) and (X-Z) and their corresponding equations. . . 109
3.11 (a) The difference between approaching two spherical droplets v.s two ellip-soidal droplets, (b) intersection of two touching ellipellip-soidal droplets. . . 111
3.12 Two ellipsoidal droplets approaching on the space between two pillars. For checking coalescence between these two droplets we can verify the existence of intersection between their projected images on each planes X-Y , X-Z and Y -Z. But, this calculation is done if the three dimensional Euclidean distance between the ellipsoids is inferior than the summation of their max-imum sizes. . . 112
3.13 Images of the real droplets growing on a pillared substrate at t = 100, 200, 400, 800. Two example zones are highlighted in these images that consist of droplets in ouch with pillars. It can be seen that if a droplet touches a pillar, they will stay in touch till the end of process. . . 114
3.14 Schematic diagram of the simulation algorithm for generating ellipsoidal droplets on pillared substrate . . . 116
3.15 (a) An ellipsoid (contact angle with surface is 90◦), (b) a semi-ellipsoid
(contact angle with surface is θ). On theory we consider that the semi-ellipsoid is cut of from the head of an semi-ellipsoid. . . 117
3.16 Semi-ellipsoid with contact angle θ is cut of from a bigger ellipsoid by angle γ and height h. . . 118 3.17 Sinusoidal surface parameters. . . 124
3.18 Schematic diagram of the simulation algorithm for generating semi-ellipsoidal droplets on sinusoidal substrates. . . 126
4.1 The evolution of the droplets during dropwise condensation at different time steps (t = 10 s (initial nucleation) , 100 s (growth due to adsorption), 700 s (growth due to coalescence), 5000 s (steady state)). (a) Binarized images of experimental results, (b) Results from simulation algorithm. . . 129
4.2 Changes in (a) droplet size and (b) droplets density during process time for simulation and experiments. The first vertical lines indicate the time that almost the rate of changes in radius and density are lowered (due to opposite effects of coalescence and nucleation of new droplets) and the second lines are the starting time of the steady state step. . . 130
4.3 Comparison between Ripley’s L functions of droplets at steady state relevant to the Poisson point process, experiments and simulation . . . 131
4.4 Average heat transfer coefficient v.s average size of droplets . . . 132
4.6 Evolution of average heat transfer coefficient and total heat flux v.s wall temperature . . . 133
4.7 Percentage of surface coverage at different times. . . 134
4.8 (a) Droplets size and (b) droplets densities during progress time for different initial nucleation site densities . . . 135
4.9 Surface coverage for different nucleation site densities v.s time . . . 136
4.10 The results of the three models (Rose, Abu-Orabi and empirical models) versus experimental data at different time intervals of adsorption step (t = 10, 30, 50 s). The empirical and the Rose models are able to predict the size distribution function of adsorbing and coalescing droplets respectively, while the model of Abu-Orabi is far from the experimental data at earlier stages. . . 137
4.11 The results of the three models (Rose, Abu-Orabi and empirical models) versus experimental data at different time intervals of adsorption step (t = 100, 300, 500 s). The empirical and the Rose models are able to predict the size distribution function of adsorbing and coalescing droplets respectively, while the model of Abu-Orabi is far from the experimental data at earlier stages. . . 138
4.12 The results of the three models (Rose, Abu-Orabi and empirical models) versus simulation data at t = 10s for 4 different initial nucleation densities. 139
4.13 The results of the three models (Rose, Abu-Orabi and empirical models) versus simulation data at t = 10s for 4 different substrate temperature. . . . 140
4.14 Illustration of 6 pillared surfaces after 1800s. The size of the substrate at each image is 3.3mm × 2.7mm. . . 141
4.15 Comparison between growth rate of experimental and simulation droplets on 6 different pillared surfaces. . . 143
4.16 Comparing the changes in droplets density between experimental and sim-ulation droplets on 6 different pillared surfaces. . . 144
4.17 Illustration of 6 sinusoidal surfaces at adsorption stage (around t = 10s). . . 147
4.18 Illustration of 6 sinusoidal surfaces at coalescence stage (around t = 1800s). 148
4.19 Illustration of 6 sinusoidal surfaces at steady state (around t = 8000s). . . . 149
4.20 Comparison between growth rate of experimental and simulation droplets on 6 different sinusoidal surfaces . . . 150
4.21 Comparison between density of experimental and simulation droplets on 6 different sinusoidal surfaces . . . 151
4.22 The evolution of droplets size measured by spherical-cap model and ellip-soidal cap model on 6 different sinuellip-soidal surfaces compared to experimental results . . . 153
4.23 The evolution of droplets density measured by spherical-cap model and ellip-soidal cap model on 6 different sinuellip-soidal surfaces compared to experimental results . . . 154
4.24 Fry plot of droplets spatial distribution on sinusoidal substrates at t = 1800s.156
4.25 Zoomed on the origin of Fry plot of droplets spatial distribution on sinusoidal substrates. . . 157
LIST OF TABLES
List of Tables
1.1 Size and distance between the pillars of each substrate. rt represents the
theoretical radius of pillars, dt is the theoretical center to center distance
between the pillars, and ht is the theoretical height of pillars. . . 47
1.2 Characteristics of each sinusoidal surface. λ and a being the period and amplitude of the sinusoidal profiles. . . 47
1.3 Roughness parameters of each sinusoidal surface on the metallic molds. λ(µm) and a(µm) denote the period and amplitude of the sinusoidal pro-files respectively, Ra is the average roughness, while Rt = Rp− Rv is the maximum amplitude of the sinusoidal profile and Rz is the average of Rton the surface. Rq in this table represents root mean square of the roughness profile and finally, Eave here is the average error between Rz and a. . . 54
1.4 Roughness parameters of each sinusoidal surface on the metallic molds using Fourier filter in order to avoid the highest and the lowest points that are not the real peaks and valleys. λ(µm) and a(µm) denote the period and amplitude of the sinusoidal profiles respectively, Rais the average roughness, while Rt= Rp− Rv is the maximum amplitude of the sinusoidal profile and Rz is the average of Rton the surface. Rqin this table represents root mean square of the roughness profile and finally, Eave here is the average error between Rz and a. . . 54
1.5 Roughness parameters of each pillared surface. . . 56
1.6 Roughness parameters of each sinusoidal surface on polycarbonate samples using Fourier filter in order to avoid the highest and the lowest points that are not the real peaks and valleys. λ(µm) and a(µm) denote the period and amplitude of the sinusoidal profiles respectively, while Rt= Rp− Rv will be the maximum amplitude of the sinusoidal profile and Rz will be the average of Rt on the surface. Rq in this table represents root mean square of the roughness profile and finally, Eave here is the average error between Rz and a. 60 1.7 Contact angle of droplets on pillared surfaces. . . 61
1.8 Average contact angle on each sinusoidal substrate. . . 61
1.9 θ experiments table designed by FFD. . . 62
1.10 Ra experiments table designed by FFD. . . 64
1.11 ANOVA table for studying the importance of effect of λ and a on θ for significance level α = 0.05. . . 66
1.12 ANOVA table for studying the importance of effect of λ and a on Ra for significance level α = 0.05. . . 66
2.1 Performance parameters of the algorithm for several image sets . . . 90
3.1 period and amplitude of the sinusoidal patterns.. . . 124
4.1 The mean and standard deviation of errors of the model for different con-figurations of pillars. . . 145
4.2 Comparison between total surface area and density of the initial droplets on 6 configurations of sinusoidal patterns. . . 146
Acknowledgement
Acknowledgement
It is a humbling experience to acknowledge those people who have, mostly out of kindness, helped along the journey of my PhD. I am indebted to so many for encouragement and support. This journey would not have been possible without the support of my family, professors and mentors, and friends.
To my family, thank you for encouraging me in all of my pursuits and inspiring me to follow my dreams. I am especially grateful to my parents, my sister and my brother who supported me emotionally and financially.
My sincerest thanks are extended to my advisors Dr. Yann Gavet, Prof. Jean-Charles Pinoli and Dr. Stéphane Valette for their continuous support of my Ph.D study and related research, for their patience, motivations, and immense knowledge. Their guidance helped me in all the time of research and writing of this thesis. I could not have imagined having a better advisors and mentors for my Ph.D study.
Besides my advisors, I wish to thank the members of my dissertation committee: Prof. Frédéric Gruy, Dr. Anne MONGRUEL, Prof.Souad Harmand, and Dr.Christophe Pupier, for generously offering their time, support and guidance throughout the preparation and review of this document.
Last but not the least, to my many friends specially Thomas Cavoué who made the biggest change in my life. Thank you for listening, offering me advice, and supporting me through this entire process. You should know that your support and encouragement was worth more than I can express on paper.
Also I would like to mention that this work was funded by LABEX MANUTECH-SISE (ANR-10-LABX-0075, within the program "Investissements d’Avenir" (ANR-11-IDEX-0007) operated by the French National Research Agency (ANR). The experimental set-up was developed by Nicolas Pionnier during his PhD thesis funded by PSA Peugeot-Citroen in the context of OpenLab VAT@Lyon between Peugeot-Citroen and LTDS laboratory.
List of publications
International journals
1. S. Boroomandi Barati, N. Pionnier, J.-C. Pinoli, S. Valette, and Y. Gavet, "Investi-gation spatial distribution of droplets and the percentage of surface coverage during dropwise condensation", International journal of thermal science, Volume [124], 2018, 356-365.
2. N. Pionnier, S. Boroomandi Barati, E. Contraires, R. Berger, M. Guibert, S. Be-nayoun, S. Valette, "Design of an environment controlled dew tracking setup to emphasize the role of the relative humidity on breath figures dynamics", Journal of EPJ Techniques and Instrumentation, Volume 5[2], 2018.
3. S. Boroomandi Barati, V. Rabiet, J.-C. Pinoli, S. Valette, and Y. Gavet, "Modeling and simulation the growth of ellipsoidal droplets during dropwise condensation on pillared surfaces", accepted for the publication at Journal of applied thermal engi-neering, 2018.
4. H. Martin, S. Boroomandi Barati, N. Pionnier, J.-C. Pinoli, S. Valette, and Y. Gavet, "Segmentation of gray scale images of dropwise condensation on textured surfaces", International journal of circuits, systems and signal processing, Volume 12[1], 2018. 5. S. Boroomandi Barati, J.-C. Pinoli, S. Valette, and Y. Gavet, "Differential and
av-erage approaches to Rose and Mei dropwise condensation models", International journal of mathematical models and methods in applied science, Volume[11], 2017, 40-46.
6. S. Boroomandi Barati, J.-C. Pinoli, S. Valette, and Y. Gavet, "Drop-size distribution function for small droplets during dropwise condensation", will be Submitted to the International journal of thermal science, 2018.
7. S. Boroomandi Barati, V. Rabiet, J.-C. Pinoli, S. Valette, and Y. Gavet, "Simula-tion the growth of ellipsoidal droplets during dropwise condensa"Simula-tion on Sinusoidal surfaces", Will be submitted to the International journal of heat and mass transfer, 2018.
Publications
International conferences
1. H. Martin, S. Boroomandi Barati, N. Pionnier, J.-C. Pinoli, S. Valette, and Y. Gavet, "Segmentation of gray scale images of dropwise condensation on textured surfaces", The 2018 International Conference on Applied Mathematics and Compu-tational Methods in Engineering, Venice, Italy April 28-30, 2018.
2. H. Martin, S. Boroomandi Barati, J.-C. Pinoli, S. Valette, and Y. Gavet, "Recogni-tion the droplets in gray scale images of dropwise condensa"Recogni-tion on pillared surfaces", 7th international conference on computer science, engineering and applications, 23-24 September Copenhagen, Denmark.
3. S. Boroomandi Barati, J.-C. Pinoli, S. Valette, and Y. Gavet, "Differential and aver-age approaches to Rose and Mei dropwise condensation models", 16th international conference on mathematical methods, mathematical models and simulation in science and engineering, Athens, Greece, April 9-11 2017.
4. S. Boroomandi Barati, J.-C. Pinoli, S. Valette, and Y. Gavet, "Modeling and simula-tion of ellipsoidal droplets growing on patterned substrates during dropwise condensa-tion", XVIII Spanish-French School Jacques-Louis Lions about Numerical Simulation in Physics and Engineering, 25-30 Juin 2018, Gran Canaria, Las Palmas.
National seminars
1. S. Boroomandi Barati, J.-C. Pinoli, S. Valette, and Y. Gavet, "Mathematical model of dropwise condensation on textured surfaces", 9ème Colloque Science et Technologie des Poudres, Compiègne, France, 3-5 July 2018.
2. S. Boroomandi Barati, N. Pionnier, J.-C. Pinoli, S. Valette, and Y. Gavet, "Spatial distribution of droplets during dropwise condensation ", 28em Journées Interna-tionales Francophones de Tribologie (JIFT), Saint Etienne, France, 27-29 April 2016. 3. S. Boroomandi Barati, J.-C. Pinoli, S. Valette, and Y. Gavet, "Random and geo-metric model of droplets nucleation on textured surfaces", Séminaire biennal labex manutech-sise 2017, Marcoux, France, 12-13 October 2017.
Honors and awards
1. The bourse of the "Société de Mathématiques Appliquées et Industrielles (SMAI)" for participation at summer school of Jacques-Louis Lions about Numerical Simulation in Physics and Engineering, 25-30 Juin 2018, Gran Canaria, Las Palmas.
Summary
Water droplets that are forming on the interior side of the car light shields in humid days reduce the efficiency of the lightening by reflecting the light beams passing through. The formation of these droplets is due to the process of condensation. The aim of this thesis is to develop a numerical simulation model to study the process of dropwise condensation on flat and textured substrates.
Condensation occurs when the temperature of a humid air mixture goes beyond its dew point, like when a cold substrate is in contact with humid air and water droplets start to nucleate and grow on its surface. In this case, condensation can occur either in dropwise or filmwise form. Dropwise condensation is preferred when higher heat transfer coefficient is needed like in heat exchanging devices and power generation refrigeration, when in optical purposes filmwise condensation is favored because of less light reflection.
One efficient and environmentally-friendly way to transit from dropwise to filmwise condensation and vice-versa is by applying special texturing patterns on the substrate. In this regard, we studied the droplets behavior on three types of substrates: flat surface, textured in form of pillars and textured in form of sinusoidal substrates. The experimental part was carried on the polycarbonate surfaces that were duplicated from a metal mold textured using laser technology. Then, the samples are mounted on a home-made conden-sation set-up developed previously. The results of these experiments are gray scale images that had to be segmented in order to get the information related to droplets growth rate, density and spatial distribution.
Comparison between the gray scale images taken from droplets growing on textured and flat surfaces shows considerable differences. The most important difference is that since the droplets can be easily canalized between the patterns, the shape of droplets changes from spherical to ellipsoidal as is shown in figure1. These ellipsoidal droplets can grow, contact and coalesce in a three dimensional configuration.
Therefore, three different models were developed during this thesis to describe droplets behavior:
1. a classical method that considers droplets as spherical-caps growing on a flat substrate (figure 2 (a)),
2. a method that considers elliptical droplets (contact angle = 90◦) growing on the
textured substrates (figure 2 (b)),
3. and a modified method that considers ellipsoidal-cap droplets (contact angle 6= 90◦)
The results of these three methods are validated by comparison with experimental data on a flat surface, six different configurations of pillared surfaces, and six configurations of sinusoidal patterns. The spatial distribution of droplets on both flat and textured substrates are studied using Fry plot and Ripley’s K directional methods as well. Moreover, a method for studying the density function of small droplets on flat surfaces is proposed by modifying the method of Abu-Orabi for the surface area and by neglecting the periodic surface renewal. Therefore, a simpler but more efficient model is developed to describe the size distribution function of small droplets at earlier stages. Earlier stages here means the time steps before sliding of the big droplets.
As was expected, by making texturing patterns on the substrates, we will be able to control droplets spatial distribution and more importantly their growth rate. Also, the three models proposed here are in acceptable agreement with experimental data with the error less than 10% depending on the model.
Résumé
Résumé
Les gouttelettes d’eau qui se forment du côté intérieur des phares des voitures pendant les jours humides réduisent l’efficacité de l’éclairage en réfléchissant les faisceaux de lumière passant à travers. La formation de ces gouttelettes est due à la condensation. Le but de cette thèse est de développer un modèle de simulation numérique pour étudier le processus de condensation en gouttelettes sur des substrats plats et texturés.
La condensation se produit lorsque la température d’un mélange d’air humide passe en dessous de son point de rosée, comme lorsqu’un substrat froid est en contact avec de l’air humide et que des gouttelettes d’eau commencent à germer et à se développer à sa surface. Dans ce cas, la condensation peut se produire par gouttelettes ou sous forme de film. La condensation en gouttelettes est préférée lorsqu’un coefficient de transfert de chaleur plus élevé est nécessaire, comme dans les dispositifs d’échange de chaleur et de réfrigération. Au contraire, pour les applications anti-bouée la condensation par film est favorisée afin de limiter la diffusion de lumière par les gouteletts.
Une manière efficace et écologique de passer de la condensation en gouttelettes à la condensation par film et inversement consiste à appliquer des motifs de texturation spéciaux sur le substrat. À cet égard, nous avons étudié le comportement des gouttelettes sur trois types de substrats : surface plane, texturée sous forme de piliers et sous forme de sinusoïdes. La partie expérimentale a été réalisée sur des surfaces de polycarbonate dupliquées à partir d’un moule métallique texturé par laser. Les échantillons sont montés sur un ensemble de condensation développé précédemment au laboratoire. Les résultats de ces expériences sont des images à niveaux de gris qui ont dû être segmentées afin d’obtenir l’information liée au taux de croissance des gouttelettes, à la densité et à la distribution spatiale.
La comparaison entre les images à niveaux de gris prises à partir de gouttelettes sur des surfaces texturées et plates montre des différences considérables. La différence la plus importante est que, puisque les gouttelettes peuvent être facilement canalisées entre les motifs, la forme des gouttelettes passe de sphérique à ellipsoïdale comme le montre la figure 1. Ces gouttelettes ellipsoïdales peuvent se développer, entrer en contact et se fondre dans une configuration tridimensionnelle.
Par conséquent, trois modèles différents ont été développés au cours de cette thèse pour décrire le comportement des gouttelettes :
1. une méthode classique qui considère les gouttelettes comme des calottes sphériques se développant sur un substrat plat (figure 2 (a)),
2. une méthode qui considère les gouttelettes elliptiques (angle de contact = 90◦)
3. et une méthode modifiée qui considère les gouttelettes à calotte ellipsoïdale (angle de contact 6= 90◦) croissant sur les substrats texturés (figure 2 (c)).
Les résultats de ces trois méthodes sont validés par comparaison avec des données expérimentales sur une surface plane, six configurations différentes de surfaces à piliers et six configurations de motifs sinusoïdaux. La distribution spatiale des gouttelettes sur les substrats plats et texturés est étudiée à l’aide de la méthode Fry et des méthodes fonctions de K directionnelles. De plus, une méthode pour étudier la fonction de densité de la taille des petites gouttelettes sur les surfaces planes est proposée en modifiant la méthode d’Abu-Orabi pour la surface et en négligeant le renouvellement périodique de surface. Par conséquent, un modèle plus simple mais plus efficace est développé pour décrire la fonction de distribution de taille des petites gouttelettes au debut du processus. La pherase debut du processus ici signifie les étapes de temps avant le glissement des grosses gouttelettes.
En réalisant des modèles de textures sur les substrats, nous sommes en mesure de contrôler la distribution spatiale des gouttelettes et, plus important encore, leur taux de croissance. De plus, les trois modèles proposés ici sont en accord acceptable avec les données expérimentales avec une erreur inférieure à 10% selon le modèle.
Introduction
General introduction
0.1
General issue
Moisture formation on the interior side on the windows, eye glasses, light shields and other glassy substrates during the foggy days has been always known as a natural process. But when it comes to lightening and optical devices, the formation of dew can become a serious problem: the water droplets reflect the light beams passing through the surface and can reduce for example the vision of the optical glasses or the efficiency of lightening in light shields. Figure 1 1 shows the light beams reflected by water droplets formed on a glassy
substrate. This is what can happen on the interior side of the car light shields at the foggy days or almost all the time in the countries that have humid environment. The formation of dew is because of the well-known process of "condensation".
Figure 1: Light reflection because of droplets formation on the glassy substrates. This phenomenon can happen on the interior side of the car light shields at the foggy days and will reduce the efficiency of illumination.
Condensation generally occurs when the temperature of a saturated air mixture goes below its dew point [14,15]. The growth or shrinking of droplets depends on the challenge between condensation and evaporation. At first, condensation occurs and water droplets form either on the substrate or as a mixture with vapor phase, but after a while some of the
1
water molecules with higher amount of energy move back to the vapor phase. Depending on the rate of the two processes, water droplets can either grow or disappear. Beysens et al. did considerable researches on the formation, determination and growth of dew under different situations [15,16,17,18].
Evaporation of the droplets generally occurs in 3 stages according to figure 2. At first, the spreading stage occurs, during which the droplet attains the maximum value of the base diameter and the contact angle reaches the value of advancing contact angle. For simple liquids this stage is very fast and evaporation can be neglected. Therefore, in most studies it is out of consideration and only three consequent stages of evaporation are taken into account [1]. During stage I the contact angle is decreasing while the radius of drop or the length of contact line is constant. Following the process at stage II, the droplet becomes smaller in the same contact angle and in the final stage both the radius and contact angle decrease at the same time [1]. These stages are presented in figure 2.
Figure 2: Changes in contact angle and radius of the droplet during evaporation [1]. Stage I: the radius of droplet is constant while, its contact angle is decreasing. Stage II: the droplet becomes smaller in the same contact angle. Stage III: both the radius and contact angle decrease at the same time.
Parsa et al. [19] reported two other stages after stage III named the mixed mode and the stick-slip stages. During the mixed mode sometimes both the radius and contact angle decrease simultaneously. In the stick-slip mode, the droplet is in the constant contact radius mode, but the contact line suddenly slips into a new position leading to a smaller
Introduction Dropwise and filmwise condensation contact radius when the contact angle reaches a threshold, minimum value (corresponding to a slip phase). Then, the droplet is again in the constant contact radius mode (stick phase) until the next depinning occurs.
The transfer point from stage I to stage II (tr) is related to the surface roughness and
hydrophobicity. On rougher surfaces, it is difficult for drops to slide on the surface and the decrease in radius happens later, so evaporation occurs mainly through the radius constant stage. While, for hydrophobic surfaces evaporation goes through the θ constant stage [1].
The problem appears when the rate of evaporation is less than condensation and water droplets do not disappear. Usually when outside is relatively colder than inside area and air relative humidity is high enough, droplets form and grow on the surface of interface between indoor and outdoor that can be a window, a light bubble or simply the eye glasses. The most important parameters affecting the rate of condensation and evaporation are: both air and substrate temperature, air pressure, air flow velocity [20], solid content and impurities in liquid droplets [21], heat transfer mechanism [22], size of initial droplets, surface hydrophobicity [1], and surface roughness[1]. Therefore, by (1) considering constant temperature for cold substrate and hot air, (2) neglecting the effect of impurities and (3) considering zero velocity of both phases, (4) under atmospheric pressure and (5) on the surface without coating, the only parameter that can be manipulated in order to control the rate of condensation and evaporation is the surface roughness as well as surface topography. In the following the condensation process on the solid substrates especially in dropwise mode will be presented with more details. Then, different aspect of dropwise condensation that have been studied up to now will be discussed.
0.2
Dropwise and filmwise condensation
Condensation can play a great role in improving the efficiency of the energy utilization systems and relieving pollution problems [23] and is widely used in heat transfer devices, power generation refrigeration, and waste heat recovery stations [24, 25]. There are two main types of condensation: dropwise and filmwise. The efficiency of all the above systems depends on the mode of condensation, because it has been proved that dropwise conden-sation has considerably greater heat transfer coefficient (about 5 to 7 times) with respect to the filmwise mode [26,27]. In dropwise condensation the surface of substrate is covered by liquid droplets[28], while the filmwise mode happens when the contact angle of liquid on the surface is low enough to form a stable liquid film [27].
Depending on the goal of process, each of dropwise or filmwise condensation can be more favorable. Dropwise condensation is preferred when higher rate of heat transfer is needed, for example in heat exchangers or when an easy-to-clean surface aims to reduces pollutant adhesiveness [29]. The problem that we are dealing with is the formation of liquid droplets in car light shields, which will cause the light reflection and as a result the decrease in the efficiency of illumination. In such cases, it is preferred to achieve the filmwise regime.
Stylianou and Rose [33] discussed different methods to describe transition mode from dropwise to filmwise condensation like, viscosity-limited coalescence mechanism or nucle-ation site saturnucle-ation mechanism. There are several ways to control the ratio of dropwise to filmwise condensations such as using hydrophobic or hydrophilic chemical coatings [34,35],
changing surface roughness and surface morphology [36].
Figure 3: (A) Cassie-Baxter and (B) Wenzel droplets on textured surfaces (image from [2]).
The definition of dropwise and filmwise condensations might bear in mind the concept of Cassie–type [30] and Wenzel-type [31] droplets. Cassie droplets sit on top of the roughness peaks with trapped air underneath, so they can be effectively removed from the surface [32]. Whereas, Wenzel droplets retain intimate contact with the solid surface (figure 3). Usually Cassie droplets lead to dropwise condensation and Wenzel droplets lead to filmwise mode, but it depends on the wettability of the surface as well as size of the texturing patterns. Meaning that, the Cassie and Wenzel drops usually happen on the surfaces with spacial chemical coatings with preferred wettability or when the size of roughness pattern is far smaller than the size of droplets (usually nano-metric patterns). In the case of the surfaces without chemical coating and bigger texturing patterns (usually micro-metric patterns), comparing Cassie and Wenzel droplets with dropwise and filmwise condensation is not appropriate.
0.2.1 Effect of topography
Medici et al. [37] investigated the effect of discontinuities (either due to surface roughness or due to different subcooling properties) on the rate of droplets growth. They stated that both of these discontinuities at outer edges will speed up the droplets growth rate. This is because more water vapor can be collected at the border, whereas geometrical discontinuities at inner edges, where less water vapor is collected will lower the droplet growth. Guadarrama-Cetina et al. [38] investigated the nucleation and growth of water droplets on the hexagonal micro-structure surface of desert beetles skin and they found the higher droplet nucleation rate in the valleys where dew forms primarily.
Qian and Ma [39] stated that nano-concave or convex topography can change nucleation pattern of droplets on a rough surface. Chen et al. [40] discovered that Cassie droplets are more stable than Wenzel type on the rough surfaces with nano-pillars. However, it is difficult to maintain Cassie droplets on a flat or macro pillared surfaces because the Cassie
Introduction Dropwise condensation state is meta stable and a transition from the Cassie to Wenzel state is often observed by an increase in driving force like temperature or pressure difference [41].
0.2.2 Effect of chemical coatings
Vemuri and Kim [34] reported the increase of about 8 times in condensation heat trans-fer rate on the hydrophobic coating of n-octadecyl mercaptan with respect to complete filmwise condensation under atmospheric pressure. Tiany et al. [35] compared the rate of droplets growth on two different coatings: a hydrophilic (contact angle = 73.9◦) and a
hydrophobic (contact angle = 110.8◦) one. Their results show that on the two substrates
the condensation starts by dropwise form, no matter how the surface wettability is. Then depending on the wettability of the surface the shape of droplets will be different: on the hydrophobic substrate the droplets will grow in circular shape, while on the hydrophilic substrate droplets will be shapeless after a while. Xiuliang and Cheng [5] studied the effect of coating thickness, thermal conductivity of coating and contact angle on the heat transfer during dropwise condensation. They also improved a thermodynamic model to calculate critical radius for dropwise condensation on a subcooled coated surface [42]. But, using chemical coatings is harmful to environment and wastes water. Therefore, in the current study it is more preferred to investigate the effective parameters on the rate of droplets growth by avoiding use of chemical coatings.
0.3
Dropwise condensation
A huge amount of works have been done up to now to describe theoretically and empirically what happens during the process of dropwise condensation (for example. Generally drop-wise condensation includes four main steps: nucleation of initial droplets (homogeneously or heterogeneously), growth due to adsorption, growth due to coalescence and at the same time nucleation of new droplets in vacant area of surface, and sliding of very big drops (in the case of vertical substrate). The result of the last three stages is the change in number of droplets as well as their size. In dropwise condensation, water droplets start to nucleate either in the air mixture or on the cold substrate of chamber walls. Regarding condensation on cold substrate, nucleation can occur uniformly (when there is no preference between different spots for nucleation) or ununiformly(preferentially on the surface imperfections) [44].
After nucleation step, the droplets grow due to two main mechanisms: when the droplets are smaller than critical radius (rc) they grow by absorbing water molecules from
the gas phase, while droplets bigger than rc grow mainly due to coalescence [45,46], which
means joining of the neighboring drops to form a new bigger drop. The concept of small and big droplets was firstly introduced by Abu-Orabi [47]. He proposed the critical radius as the half-spacing between active sites on the substrate and divided the droplets into small or adsorbing droplets and big or coalescing droplets by comparing their radius with rc. rc
can be calculated as follows, where N is the number of droplets and L is the side length of the square substrate:
rc=
r L2
Based on this method of droplets categorizing, Liu et al. [5] and Vemuri et al. [34] calculated total heat transfer and droplets nucleation density as the summation of these values for each group of droplets. Although coalescence is a mass conservative process, the area covered by daughter droplet is lower than the summation of area covered by it’s parents. This will lead to forming vacant area around daughter droplet, in which new small droplets can nucleate and grow. Both these steps will change droplets density and lead to a temporal distribution [48].
After a while very big droplets will form that can overcome the friction and slide from the substrate and clean off the droplets on their path. In this situation the droplets will disappear and new small droplets will form at their places. Therefore, there is another important definition in this case, maximum radius (rmax), which is the larger radius that
is achievable by a drop before sliding (in the case of vertical substrates). This parameter is a completely experimental factor that is in direct relationship with the surface topography, physical features of liquid, and the angle of substrate with horizon. For example Earl et al. [10] reported rmax = 0.1cm for water droplets sliding from the vertical surface of a
condenser. Ghosh et al. [172] studied different mechanisms affecting the surface removal step. According to their work, in the case of dropwise condensation from pure vapor the droplets bigger than the capillary radius of water (0.2Cm) will slide from the substrate.
In the following, after a brief explanation of different steps of dropwise condensation, the most important aspects of this process based on their roles in droplets growth and heat transfer rate, including droplets nucleation, temporal distribution and droplets size distribution function are going to be discussed. Then, the algorithms that were used for generating droplets will be introduced and finally the goals of this study will be introduced.
0.3.1 Droplets nucleation
Nucleation refers to the process of forming a new thermodynamic phase from a bulk phase that can occur homogeneously or heterogeneously [35]. In dropwise condensation nucle-ation means formnucle-ation of small droplets that are ready to grow. These small droplets can form either in the steam or gas bulk (homogeneous nucleation) or on the surface of a sub-strate or solid particles (heterogeneous nucleation). In this thesis we deal with nucleation of water droplets on substrate or a heterogeneous nucleation.
In dropwise condensation on substrate, if the droplets form on a completely flat surface with no preference, it will be a uniform nucleation. An ununiform nucleation occurs when there are some points due to pollutants or surface topography that are more potential to grow droplets. The arrangement of droplets on the surface plays a very important role in controlling the rate of droplets growth. Configuration of droplets on the surface will change the possibility of contact between droplets and as well, the rate of growth due to coalescence, and consequently the rate of producing vacant area after coalescence that will change the number of new small droplets nucleate at each step. The arrangement of droplets is in close relationship with surface wettability and roughness. Therefore, one of the ways to change droplets arrangement is to apply chemical coatings that can change surface wettability, or to make different topographies on the surface to arrange the places that are more preferred to grow droplets. Both of these parameters will affect the number of droplets that are able to grow on the surface.
Introduction Dropwise condensation types:
• homogeneous nucleation: nucleation on the bulk phase, • heterogeneous nucleation: nucleation on the cold substrate,
– uniform nucleation: nucleation on the cold substrate without any preferred points,
– ununiform nucleation: nucleation on the cold substrate with preferred points (for example on patterned or coated substrates).
Since in this study we are focused on the heterogeneous nucleation, in the following more explanations about the two forms of this process will be presented.
0.3.1.1 Uniform nucleation
Uniform nucleation occurs when the droplets nucleate completely randomly or as is said in the literature their distribution follows the Poisson point process (see section 0.4.1). Kostinski, Jameson and Larsen [49, 50, 8, 51, 52] have published many works in investi-gating the validity of the Poisson distribution for rain drops. In dropwise condensation on the flat surface also, because the initial droplets are fine and there is no preference between different spots to grow droplets, the assumption of Poisson point process can be considered as true. But, in the coalescence part the droplets in the neighboring volumes are not statistically independent and thus the distribution will not be uniform anymore. Therefore, it can be concluded that the spatial distribution of droplets at initial steps of condensation on flat surfaces can be assumed as uniform distribution, but at coalescence stage it will deviate from uniformity.
0.3.1.2 Ununiform nucleation
Ununiform dropwise condensation on textured surfaces is now more attractive to scientists because of the ability of controlling droplets configuration [53]. Therefore, this idea could also be interesting for optical applications. Indeed, this solution could make drops to form a continuous film or to drain quickly from the surface of headlights or glasses. There are some methods, by which the nucleation sites can form under controlled conditions. One of these methods is the so-called bottom-up approach to create localized hydrophilic tips on super hydrophobic surfaces [27]. In this method a hydrophobic or super hydrophobic surface is chemically treated to have controlled hydrophilic spots. These hydrophilic spots that can be inserted by different geometries will be the nucleation sites for droplets during dropwise condensation. One of the materials that is used for this purpose is polyvinyl alcohol (PVA) due to its ability to be adsorbed onto most hydrophobic surfaces from solution phase [3]. Such unique bottom-up approach can be investigated by other water-soluble polymers as well as aqueous suspension of nanoparticles like AgI instead of PVA [4]. In this method, the main mechanism is based on the Volmer’s classical nucleation theory and experimental nucleation studies that predict a higher condensation rate on the hydrophilic surfaces than hydrophobic ones. Thus, hydrophilic spots of PVA on a super hydrophobic surface can function as the spatial nucleation sites.
This spatial configuration can be extended on various topographical geometries, such as blade (figure 4(A) and (B)), honeycomb (figure 4 (C)) and brick topographies (figure
4 (D)). The two important parameters here are the shapes of geometric features which varies in figure 4 and their size which effects can be seen in figure 5. In figure 4
optical images of the nucleation and growth of water droplets condensation on various super hydrophobic surface geometries are presented. For each geometry the comparison between functionalized with PVA tips and un-functionalized patterns is illustrated. At figure 4(A) the first row shows an hydrophobic blade geometry without any hydrophilic functionalized tip. As a result, the droplets were formed and grew randomly, resulting in wetting films. The second row of figure 4(A) shows the hydrophobic blade geometry with the hydrophilic functionalized tips on the top of the blades. The results of condensation on these geometries can be seen in4 (B). It is obvious that nucleation sites followed the same shape of the PVA pattern and grew from DSi to Dw1 and Dw2. Condensation on 4
(C) honeycomb and 4(D) brick follows a similar pattern to the posts. At first that there is no functionalized tip, droplets form all around the surface without special interest, but after inserting the hydrophilic tips, the droplets follow the roughness pattern [3].
Figure 4: Optical images of the nucleation and growth of water condensation on various super hydrophobic surface geometries [3].
As it was mentioned above, both shape and size of geometry features are important in the shape of droplets spatial distribution. In figure 5, the control of droplet coalescence by changing the geometric features size is presented. PVA tip functionalization in three different sizes of the same geometries results in different droplet condensation patterns. In
5 (A) small blades were studied. In this pattern droplets formed on the middle of each blade, resulting in the uniform condensation of one centered droplet per blade. In 5 (B) blades of intermediate length are shown that lead to two droplets per blade in a dumbbell shape. Figure 5(C) indicates that a thin film of water nucleates on longer blades, which can break up into smaller droplets. These smaller droplets can coalesce and form large, uniformly positioned single droplets. Thus, it can be concluded that for bigger blades a random pattern of droplets will form, that their shapes and distribution are not under controlled conditions.
Introduction Dropwise condensation
Figure 5: Control of droplet coalescence by changing the geometrical features sizes [3].
Voronoi diagram
Lhuissier et al. [4] studied the formation of nano- or micro-gas bubbles that often form on hydrophobic solid surfaces in contact with an aqueous environment. Their mathematical method can also be used to study the nucleation of droplets during dropwise condensation on solid substrates. For studying the spatial distribution of the bubbles, they made two algorithms to track the area of each bubble, that considers a cell around each bubble’s zone and grid the surface with respect to these cells. Two methods were used for grinding the surface:
1. the first method is called standard Voronoi diagram, considers a surface with area Avor around each zone based on the distances to its center. So, just the points that
are closer to the center of each zone than the center points of the other zones are chosen as area of the bubble.
2. the second one, that is called modified Voronoi diagram (also known as Appolonius diagram), is based on the distances with the boundary of each zone. Therefore, it draws a surface with area A consisting of the points that are closer to the boundary of each zone with respect to the boundaries of the other zones.
These two definitions are equal only if the bubbles have the same size. Figure 6shows these two methods of grinding the surface. In 6 (a) standard Voronoi diagram is shown, in which the surface with area Avor is considered around the center of the bubbles, while
in modified Voronoi, figure 6(b), the surface was drawn around the boundary of bubbles. Lhuissier [4] considered the probability distribution function (pdf) of the normalized area of the cells (x = A/Aave) for Voroni diagram as a gamma distribution, which is
expected as a case of a random Poisson process for bubbles distribution: P (x) = 343
15 r 7
2πx
5/2e−7x/2. (0– 2)
But their experiments resulted in a broader distribution than the gamma process that shows inhomogeneity in the bubbles distribution. They explained this inhomogeneity by the nature of nucleation and growth of bubbles. If some bubbles nucleate and start growing
Figure 6: Two methods for tessellation the surface of nucleation [4].(a) Voronoi diagram based on the distances to the bubbles’ centers (red circles). One Voronoi cell with area Avor associated with the bubble center marked as a filled red circle is shown. (b) Modified
Voronoi diagram based on the distance to the bubbles’ triple contact lines (pink lines). One modified Voronoi cell with area A associated with the bubble footprint (with area a) colored in pink is shown.
before the others, they are likely to reach larger sizes than in the case where all bubbles would nucleate at the same time. So, their difference in size with respect to the mean is going to be more than the amount that was predicted by gamma process. At last, it resulted that the bubbles centers are not uniformly distributed and this shows that they interact with each other during nucleation and growth. More over, the size of bubbles is a strong function of their distance with their neighbors.
Effective parameters on the droplets nucleation density
Liu and Cheng [54] at first developed the Kim and Kim’s model [55] of heat trans-fer through a droplet by adapting population balance model to achieve the critical radius. Then, they developed a new model for dropwise condensation heat flux on a subcooled sur-face with coatings and used this model to investigate the effect of the following parameters on the droplets nucleation density on a surface with hydrophobic coating [5]:
• Degree of subcooling, which is the difference between gas saturated temperature and substrate temperature (∆Tsub= Tsat− Ts )
• Contact angle (θ) • Coating thickness (δ)
• Thermal conductivity of thickness (λ)
The results of their study can been seen in figure7. According to this figure for surface without coating, figure 7(a), the increase in contact angle does not affect apparently on the drop nucleation density on high degrees of subcooling, but in ∆Tsub lower than 4oC,
by increasing the contact angle the drop nucleation density decreases. This is because by increasing contact angle condensation is more difficult and the number of nucleation sites reduce. While as can be seen in figure 7(b) by adding a 0.1µm coating, the drop
Introduction Dropwise condensation nucleation density decreases with increasing contact angle. It is also worth pointing out that by increasing coating thickness and decreasing thermal conductivity of coating, drop nucleation density will decrease too. This is because of increasing the thermal resistance between substrate and gas phase. So the rate of heat transfer will decrease as well as the number of droplets by increasing coating thickness and decreasing thermal conductivity.
(a) (b)
(c) (d)
Figure 7: Effective parameters on the droplets nucleation density [5]. (a) Effect of contact angle without coating, (b) effect of coating layer thickness, (c) effect of contact angle on a coating with δ = 0.1µm and λ = 0.25W/m.K, (d) effect of thermal conductivity of the coating layer.
In this part, the uniform and ununiform nucleation process were introduced. Also, some interesting methods that used to achieve non uniform nucleation were explained briefly. This is shown that by applying texturing patterns, we are able to change the nucleation and growth rate of droplets. In this thesis we will use two texturing patterns that are not chemically functionalized to investigate their effect on droplets behavior.
![Figure 2: Changes in contact angle and radius of the droplet during evaporation [1].](https://thumb-eu.123doks.com/thumbv2/123doknet/11617926.304035/24.892.244.644.430.858/figure-changes-contact-angle-radius-droplet-evaporation.webp)
![Figure 7: Effective parameters on the droplets nucleation density [5]. (a) Effect of contact angle without coating, (b) effect of coating layer thickness, (c) effect of contact angle on a coating with δ = 0.1µm and λ = 0.25W/m.K, (d) effect of thermal conductiv](https://thumb-eu.123doks.com/thumbv2/123doknet/11617926.304035/33.892.140.753.253.803/figure-effective-parameters-droplets-nucleation-effect-thickness-conductiv.webp)

![Figure 17: Flow diagram of computer simulation used by Earl et al. to simulate droplet growth [10]](https://thumb-eu.123doks.com/thumbv2/123doknet/11617926.304035/53.892.179.697.148.899/figure-flow-diagram-computer-simulation-simulate-droplet-growth.webp)
![Figure 18: Flow diagram of computer simulation used by Burnside and Hadi to simulate droplet growth [11]](https://thumb-eu.123doks.com/thumbv2/123doknet/11617926.304035/54.892.230.654.158.821/figure-diagram-computer-simulation-burnside-simulate-droplet-growth.webp)