HAL Id: tel-01410227
https://tel.archives-ouvertes.fr/tel-01410227
Submitted on 6 Dec 2016HAL is a multi-disciplinary open access archive for the deposit and dissemination of sci-entific research documents, whether they are pub-lished or not. The documents may come from teaching and research institutions in France or abroad, or from public or private research centers.
L’archive ouverte pluridisciplinaire HAL, est destinée au dépôt et à la diffusion de documents scientifiques de niveau recherche, publiés ou non, émanant des établissements d’enseignement et de recherche français ou étrangers, des laboratoires publics ou privés.
multi-scale approach
Paul Villoutreix
To cite this version:
Paul Villoutreix. Randomness and variability in animal embryogenesis, a multi-scale approach. De-velopment Biology. Université Sorbonne Paris Cité, 2015. English. �NNT : 2015USPCB083�. �tel-01410227�
UNIVERSITÉ PARIS DESCARTES
École doctorale Frontières du Vivant
Aléatoire et variabilité dans l’embryogenèse animale,
Une approche multi-échelle
Par Paul Villoutreix
Thèse de doctorat de Biologie Mathématique
Dirigée par Giuseppe Longo et Nadine Peyriéras
Présentée et soutenue publiquement le 3 Juillet 2015
Devant un jury composé de :
Stéphane DOUADY Rapporteur CNRS, Paris VII
Sylvie MAZAN Rapporteure CNRS, UPMC
Franck VARENNE Examinateur CNRS, Université de Rouen
David MCCLAY Examinateur Duke University
Giuseppe LONGO Directeur de thèse CNRS, ENS
P
ARISD
ESCARTESU
NIVERSITY"Frontières du Vivant" PhD program
Randomness and variability in animal embryogenesis,
A multi-scale approach
PhD Thesis in Mathematical Biology
P
AUL
V
ILLOUTREIX
Prepared under the joint supervision of
Giuseppe L
ONGOand Nadine P
EYRIÉRASPublic defense - July 3rd, 2015 - Examining committee
Stéphane DOUADY Referee CNRS, Paris VII
Sylvie MAZAN Referee CNRS, UPMC
Franck VARENNE Member CNRS, Université de Rouen
David MCCLAY Member Duke University
Giuseppe LONGO Thesis advisor CNRS, ENS
Abstract
We propose in this thesis to characterize variability quantitatively at various scales during embryogenesis. We use a combination of mathematical models and experimental results
In the first part, we use a small cohort of digital sea urchin embryos to construct a prototypical representation of the cell lineage, which relates individual cell features with embryo-level dynamics. This multi-level data-driven probabilistic model relies on sym-metries of the embryo and known cell types, which provide a generic coarse-grained level of observation for distributions of individual cell features. The prototype is defined as the centroid of the cohort in the corresponding statistical manifold. Among several results, we show that intra-individual variability is involved in the reproducibility of the develop-mental process.
In the second part, we consider the mechanisms sources of variability during develop-ment and their relations to evolution. Building on experidevelop-mental results showing variable phenotypic expression and incomplete penetrance in a zebrafish mutant line, we propose a clarification of the various levels of biological variability using a formal analogy with quantum mechanics mathematical framework. Surprisingly, we find a formal analogy be-tween quantum entanglement and Mendel’s idealized scheme of inheritance.
In the third part, we study biological organization and its relations to developmental paths. By adapting the tools of algebraic topology, we compute invariants of the network of cellular contacts extracted from confocal microscopy images of epithelia from differ-ent species and genetic backgrounds. In particular, we show the influence of individual histories on the spatial distribution of cells in epithelial tissues.
Résumé
Nous proposons dans cette thèse de caractériser quantitativement la variabilité à différentes échelles au cours de l’embryogenèse. Pour ce faire, nous utilisons une combinaison de modèles mathématiques et de résultats expérimentaux.
Dans la première partie, nous utilisons une petite cohorte d’oursins digitaux pour construire une représentation prototypique du lignage cellulaire, reliant les caractéris-tiques des cellules individuelles avec les dynamiques à l’échelle de l’embryon tout en-tier. Ce modèle probabiliste multi-niveau et empirique repose sur les symétries des em-bryons et sur les identités cellulaires; cela permet d’identifier un niveau de granularité générique pour observer les distributions de caractéristiques cellulaires individuelles. Le prototype est défini comme le barycentre de la cohorte dans la variété statistique corre-spondante. Parmi plusieurs résultats, nous montrons que la variabilité intra-individuelle est impliquée dans la reproductibilité du développement embryonnaire.
Dans la seconde partie, nous considérons les mécanismes sources de variabilité au cours du développement et leurs relations à l’évolution. En nous appuyant sur des ré-sultats expérimentaux montrant une pénétrance incomplète et une expressivité variable de phénotype dans une lignée mutante du poisson zèbre, nous proposons une clarifica-tion des différents niveaux de variabilité biologique reposant sur une analogie formelle avec le cadre mathématique de la mécanique quantique. Nous trouvons notamment une analogie formelle entre l’intrication quantique et le schéma Mendélien de transmission héréditaire.
Dans la troisième partie, nous étudions l’organisation biologique et ses relations aux trajectoires développementales. En adaptant les outils de la topologie algébrique, nous caractérisons des invariants du réseaux de contacts cellulaires extrait d’images de micro-scopie confocale d’épithéliums de différentes espèces et de différents fonds génétiques. En particulier, nous montrons l’influence des histoires individuelles sur la distribution spatiales des cellules dans un tissu épithélial.
vii
Remerciements
Il serait surprenant qu’une thèse sur l’aléatoire ne comporte pas une composante de hasard, celle-ci a bénéficié de nombreuses rencontres plus ou moins fortuites. Ce sont toutes ces personnes que je souhaite remercier ici.
Mes remerciements vont en premier lieu à mes directeurs de thèse Giuseppe Longo et Nadine Peyriéras. Je les remercie de m’avoir soutenu tout au long de ces années de thèse. L’originalité de leurs travaux, leur ouverture d’esprit, leur énergie ont nourri ma cu-riosité scientifique et m’ont emmené vers des domaines nouveaux pour moi en biologie, en mathématiques, en philosophie.. Je pense en particulier à toutes les rencontres et dis-cussions passionnantes ayant eu lieu au cours des réunions CIM organisées par Giuseppe. Je pense aussi à l’exploration permanente de Nadine sa capacité à s’enthousiasmer et sa profonde réflexion. Je les remercie de m’avoir offert autant de liberté.
Je souhaite remercier plusieurs chercheurs qui ont nourri mon travail au fil des di-rections où mes recherches m’ont mené. Paul Bourgine pour ses intuitions, son enthou-siasme et sa curiosité insatiable, mon travail sur les oursins lui doit beaucoup. Gunnar Carlsson pour sa disponibilité, sa vivacité et pour m’avoir ouvert de nombreuses portes en mathématiques. Monica Nicolau pour m’avoir permis de passer plusieurs mois à l’université de Stanford. René Doursat pour sa patience face à mes notations parfois hasardeuses! Ses idées en modélisation des systèmes vivants et sa grande clarté et ouverture d’esprit sont très appréciables.
Les réunions avec les membres de mon comité de thèse ont été très bénéfiques. Je re-mercie particulièrement Franck Varenne pour ses encouragements répétés, Philippe Her-bomel pour son sens biologique, Michel Morange pour ses perspectives historique, Michel Bitbol pour m’avoir conforté sur la piste d’une "interprétation quantique" de la variabilité chez les squints.
Cette thèse n’aurait pu avoir eu lieu dans une autre école doctorale que Frontières du Vivant. Je remercie François Taddei d’avoir insufflé cette énergie interdiscplinaire à un nombre toujours plus en grand d’étudiants. Merci à Ariel Lindner, Claire Ribrault, David Tareste et Annemiek Cornelissen de m’avoir initié à la recherche au cours du Master AIV, et aussi Vincent Fleury et Annemiek pour leurs cours passionnés d’embryologie physique. Merci à Gilles Fleury de m’avoir soutenu à Supélec vers cette trajectoire particulière.
Je remercie vivement les membres du jury; Stéphane Douady et Sophie Mazan d’avoir accepté d’être rapporteurs et Franck Varenne et David McClay d’avoir accepté d’être
ex-aminateurs.
Une thèse se fait aussi en équipe, merci à Louise pour m’avoir initié à l’embryologie ex-périmentale, Thierry pour ses inventions perpétuelles, Dimitri pour son sens de la discus-sion et ses jumeaux, Matthieu pour ses loutres et ses topos, Julien De. pour ses embryons virtuels. Merci à tous les membres de la plateforme BioEmergences, Monique, Amparo, Yannick, Adeline B, Julien Du., Adeline R, Mathieu B., Clovis, Adil, Sylvia, Mark, Gaëlle, Barbara, Manu.
Merci également à l’Institut des Systèmes Complexes d’avoir financé et hébergé la ma-jorité de cette thèse. La diversité des personnes que l’ont peut y croiser est très appré-ciable. Je remercie notamment Elisa pour sa solidarité en fin de thèse et son accent ital-ien, Jean-Philippe pour son chic et son ouverture, Guillaume pour son flegme et ses con-seils avisés, Romain pour TuxKart, Mathieu L. pour son sens de l’improvisation, Fabien pour ses piétons et bien sûr toutes les personnes qu’on peut y rencontrer et qui en font un merveilleux lieu de travail, David, Laurence, Catherine, Marlène, Maud, Julie, Pierre, Mazyiar, Alexandre, Jean-Baptiste, Samuel, Salma, Wandé, Tam Kien et tous les autres..
Je suis très heureux d’avoir pu participer aux réunions CIM régulièrement organisées par Giuseppe et je remercie tous ceux qui font vivre ce groupe de recherche. Merci notam-ment à Maël pour avoir ouvert de nombreuses voies de recherches passionnantes et pour être toujours prêt à les partager, merci à Nicole pour ses perspectives kantiennes, merci à Matteo pour l’organisation du vivant et des carnavals, merci à Angelo pour ses éclairages philosophiques, merci à Ana et Carlos d’être toujours attentifs à la portée théorique des concepts biologiques.
Finalement merci à mes amis qui m’ont beaucoup entouré. Merci en particulier aux amis des Marsouins, Jehanne, Clément, Ariane, Antoine F. et Antoine D., Aleksandra, Jean, Aude, Tatiana, c’était pour moi un rendez-vous indispensable! Merci à Peva de m’avoir mis entre les mains le livre de Bailly et Longo lorsque je cherchais ma voie, merci à Linda pour le soutien et les encouragements pendant de nombreuses années, et bien sûr merci à ma famille qui a toujours été très présente pour moi.
Contents
General Introduction 1
I Characterizing normality
9
Introduction 11
1 Predicting sea urchin’s normal development from a small cohort of digital
em-bryos 21
1.1 Introduction . . . 21
1.2 A small cohort of digital sea urchin throughout their cleavage period . . . 22
1.3 Feature Extraction and Measuring . . . 24
1.4 Emergence of embryo-level dynamics from individual cell features . . . 24
1.5 Spatial modeling . . . 26
1.6 Discussion . . . 28
2 Variability in the sea urchin development: A multi-level data driven probabilistic model 31 2.1 Introduction . . . 31
2.2 Image acquisition and digital reconstruction . . . 32
2.2.1 Image acquisition . . . 33
2.2.2 Image processing . . . 33
2.3 Multi-level measures and rescaling . . . 34
2.3.1 Individual cell features . . . 34
2.3.2 Intermediate cell groups . . . 40
2.4 Observation and approximation of multi-level statistics . . . 41
2.4.1 Estimation of cell feature distributions in cell groups . . . 42
2.4.2 Cell volume and surface area dynamics . . . 45
2.4.3 Independence along the lineage . . . 47
2.5 Multi-level probabilistic model . . . 51
2.5.1 Prototype . . . 66
2.6 Biomechanical model description . . . 71
2.7 Comparison to experimental data . . . 78
2.7.1 Metrics . . . 78
2.7.2 Objective functions . . . 82
2.7.3 Initial State . . . 83
2.7.4 Validation - Parameter space . . . 83
3 Perspectives and open problems raised by the probabilistic model of develop-ment 85 3.1 The probabilistic model implies a monoid structure . . . 88
3.1.1 Monoid Structure . . . 88
3.1.2 Formalization as a dynamical system . . . 90
3.1.3 Fluctuation theory and robustness . . . 91
3.2 Parameters evolution . . . 92
3.2.1 Waddington’s epigenetic landscape . . . 92
3.2.2 Kupiec’s ontophylogenesis . . . 93
Conclusion 95
II Characterizing diversity
97
Introduction 99 4 Sources of biological diversity and randomness 101 4.1 Sources of variability in biology . . . 1024.1.1 Gene mutations . . . 102
4.1.2 Epigenetic and stochasticity . . . 105
4.2 Randomness and its formalisms in mathematics and physics . . . 109
4.2.1 Probability theory . . . 109
4.2.2 Randomness in algorithmic theories . . . 111
4.2.3 Randomness in dynamical systems and ergodic theory . . . 112
4.2.4 Randomness in quantum mechanics - Quantum mechanics as a gen-eralized probability theory . . . 115
CONTENTS xi
4.3 Variability and models in biology . . . 116
4.3.1 Models and simulation as tools for exploring some dynamics of the living . . . 116
4.3.2 Living organisms are organized objects involving different levels of or-ganization with heterogeneous dynamics . . . 119
4.4 Conclusion . . . 121
5 Variable phenotypic expressivity and incomplete penetrance of the zebrafish mu-tant line squintcz35 123 5.1 Introduction . . . 123
5.2 Materials and methods . . . 127
5.3 Results . . . 127
5.4 Discussion . . . 131
6 Biological diversity and quantum mechanics formalism 135 6.1 Introduction . . . 135
6.2 Variability in biology, emergence of new phenotypes . . . 136
6.2.1 Squint experiment - an incomplete list of phenotypes . . . 138
6.3 Correlating several observables . . . 142
6.3.1 Mendel’s model of inheritance: a formal analog of entanglement . . . . 143
6.4 Discussion . . . 145
7 Evolution and development: toward an ontogenetic tree 147 7.1 Introduction . . . 147
7.2 Reconstructing the ontogenetic tree of the Danio rerio embryogenesis . . . . 149
7.2.1 The concept of an ontogenetic tree . . . 149
7.2.2 Formalization of the tree . . . 151
7.2.3 Observing the phylotypic stage . . . 153
7.3 Discussion and conclusion . . . 156
Conclusion 157
III Quantifying biological shapes
161
8 Using persistent homology to quantify tissue shape and organization 165
8.1 Introduction . . . 165
8.2 Global characterization of epithelial tissues . . . 166
8.2.1 Network of cellular connectivity . . . 166
8.2.2 Complex networks approach shows some limitations . . . 169
8.2.3 Persistent homology . . . 170
8.2.4 Quantitative comparison by computing features on top of barcodes . . 174
8.2.5 Classification of tissues . . . 176
8.2.6 Summary . . . 179
8.3 Random surfaces with arbitrary degree distribution to model tissue topology 180 8.3.1 Use of a null model . . . 180
8.3.2 Topological hypotheses are necessary . . . 180
8.3.3 Randomly gluing polygons . . . 181
8.3.4 Topological characteristics of random surfaces . . . 182
8.3.5 Comparison of the null model and the data for each of the features . . 185
8.4 Discussion and Conclusion . . . 191
9 Tissue shape dynamics: cell proliferation and cell displacements 193 9.1 Introduction . . . 193
9.2 Time evolving networks . . . 195
9.2.1 Time evolution of static measurements . . . 195
9.2.2 Looking at spatiotemporal networks . . . 197
9.3 Using genealogy as a parameter - historical dependency of shape . . . 198
9.4 Conclusion . . . 200
Conclusion 201
General introduction
In the introduction of the Origin of species [49], Charles Darwin refers to the "Mys-tery of mysteries" for the question of how species evolve and replace each other. Almost two centuries later, this question remains of great importance and even if some major ad-vances have been made in the understanding of the mechanisms underlying evolution, the principle of descent with modification, which constitutes together with the principle of natural selection the grounds of Darwinian evolution, lacks a full comprehension. As a contribution to this problem, this work adresses the question of variation during embryo-genesis and development.
Multicellular organisms are the result of a morphogenetic process involving multiple levels of organization, from molecules to cells to tissues to organs, interacting in a com-plex manner. This comcom-plexity is witnessed by causal processes that can be bottom-up, for example from the molecular level to the cellular level through gene expression, and top-down, for example from the tissue level to the cellular level through mechanical con-straints. Moreover, an organism builds and maintains itself, it is self-organized. This idea of a self-organizing nature of living organisms can be traced back to Immanuel Kant’s
Cri-tique of Judgment [116]. He considered organisms as entities where "every part is thought
as owing its presence to the agency of all the remaining parts, and also as existing for the sake of the others and of the whole". Self-organization is at the very basis of complex sys-tems science [117] and requires specific methodological approaches for its understanding. The development of an organism is a dynamical phenomenon where any event occur-ring at a given scale at a certain time is involved in the subsequent stages of development at all level of organizations. Therefore any variation occurring in this process has con-sequences on other parts of the organisms at later stages. This integrated nature of the organism and its relations to variation had already been noticed by Charles Darwin who designated it as correlated variations in the fifth chapter of the Origin of species:
Correlated Variations - I mean by this expression that the whole organization is
so tied together during its growth and development, that when slight variations in any one part occur, and are accumulated through natural selection, other parts become modified.
The question remains as to how these correlated variations occur and shape the ex-ploration and generation of diversity.
Understanding the diversity of forms in the living begins with the question of the sources of morphological differences between individual organisms. Usually, differences between individual organisms are attributed to genetic differences and variation in environmental conditions. Recent experimental results suggest that other phenomena have to be ac-counted for when considering sources of diversity. One striking example is the work of Raj et al. in 2010 [181], where clonal organisms of a mutant strain of the worm
Caenorhab-ditis Elegans are grown in homogeneous environment and result in variable phenotypes.
In this example the phenotypic variation is ascribed to stochastic gene expression. The concept of stochastic gene expression [65] covers the processes involved in the variability of quantity of the protein expressed for a given gene. Many other mechanisms at various levels of organization are able to generate diversity; they will be described in more depth in the course of this dissertation. This raises the question of how to integrate this variety of mechanisms generating variability when considering organisms as a whole.
Recent progresses in biological imaging technology and other quantitative techniques have allowed to reconsider many biological phenomena. The observation of stochastic gene expression in single cells [65] is a major example of the breakthroughs made possible with technological developments. In the field of developmental biology, the development of in toto and in vivo microscopy technology such as 2-photon microscopy, or single pla-nar illumination microscopy, have opened new perspectives on the study of embryogene-sis. In particular the complete digital reconstruction of the cell lineage during the first few hours of the zebrafish development has been made possible by joint innovations in imag-ing techniques and image processimag-ing [163]. This kind of phenomenological reconstruc-tion provides informareconstruc-tion on developing organisms which had never been observed in a quantitative way before, leading to a reinterpretation of many of the processes. In addition to technical challenges, the very large datasets generated require new analytic method-ologies to extract significant information [149]. In the meantime, a reinterpretation of the relations between data and models is needed, new paradigms such as data-driven models and hypothesis-driven models have emerged during the last decade [119].
multicel-CONTENTS 3
lular organisms shed a new light on processes occurring during development. Phenom-ena that have been mostly qualitatively and verbally described can now be characterized quantitatively in order to understand underlying principles [208]. However, we largely lack concepts, methods and tools to use this data for deciphering biological complexity. On a theoretical and epistemological level, biological organisms are multi-scale objects involving several levels of organization that are usually described with heterogeneous the-oretical frameworks [33]. A central characteristic of biological objects is their historical na-ture, they are the result of both ontogenetic and phylogenetic trajectories, defining them as historical entities; they may not be reproducible identically. Indeed, phylogenetic tra-jectories are the result of an interaction and a co-constitution of organisms and their en-vironments involving single events and small numbers [86], [137], similarly ontogenetic trajectories can be considered as a sequence of symmetry breakings involving contingent events [135], [15]. This historicity and variability of biological objects is at the center of Darwinian theory of evolution and should be at the ground of our understanding of bio-logical organization. This is an epistemobio-logical specificity of biology contrasting with the
ahistoricity of most physical objects. On this aspect the following quote of the physicist
Max Delbrück is particularly illuminating:
The complex accomplishment of any one living cell is part and parcel of the [fact] that any one cell represents more an historical than a physical event. These complex things do not rise every day by spontaneous generation from the non-living matter - if they did, they would really be reproducible and timeless phe-nomena, comparable to the crystallization of a solution, and would belong to the subject matter of physics proper. No, any living cell carries with it the expe-riences of a billion years of experimentation by its ancestors. You cannot expect to explain so wise an old bird in a few simple words1
Following this line of thought, we will consistently discuss the relevance of the mathemat-ical concepts used and transferred from one discipline to the other by considering their epistemological justification.
Given the systemic nature of organisms and the variety of sources of variation, as well as the historicity of organisms, it is natural to ask for the characteristics of variability during embryogenesis. What makes individual singular? How variation in individuals influence variability at the population level? What are the relations between variability and
probabil-1. Max Delbrück - "A Physicist Looks at Biology", Address Delivered at the Thousandth Meeting of the Academy, 1949
ities? And variability and randomness? How to measure and quantify variation at several scales during development? Given the differences between individual specimen, can we define a normal prototypical development for a species?
We support the following thesis: variations at all scales during development shape the exploration of diversity of forms, specifically designed mathematical tools are re-quired to characterize and quantify these variations.
Characterizing normality In the first part, we will consider the concept of normality and reproducibility of development. The question will be to measure how similar and how different are embryonic developments of the same species in normal conditions. To this aim, we will use a data set of five digitally reconstructed sea urchin Paracentrotus lividus embryos at the single cell resolution. The specimens of this small cohort are developing from the 32 cells stage (4 hours post fertilization) to hatching (around 500 cells, 10 hours post fertilization). Using the BioEmergences worlkflow [70] their complete 3D+time cell lineage and the shape of each cell was obtained from 2-photon microscopy acquisitions. Using this large data set, we will investigate the different levels of variability. This variabil-ity is first witnessed within an organism among the cells and underlies cell differentiation, it is the intra-individual variability. This variability is then witnessed between specimen among the cohort and is the result of individual specific histories, it is the inter-individual variability. While intra-individual variability can be well characterized by considering dis-tributions of cell features, inter-individual variability requires to establish generic compa-rable features allowing to place individual specimen on the same footing without averag-ing out significant intra-individual variability.
Similar dynamical patterns are found at the level of the whole embryo and in each morphogenetic field. These patterns concern the evolution of the number of cells, the cell surface and volume and the number of neighbors. A preliminary linear spatio-temporal scaling is however necessary to make them fully comparable among specimen of the co-hort. The value of the coefficients defining this scaling are a first step to characterize inter-individual variability.
Variability in the distribution of individual cell features and symmetries of the embryos prevent to identify unique cells from one organism to the other. To compare embryos and characterize intra-individual variability, we define a generic coarse-grained level of obser-vation based on inherent symmetries and similar fates (Mesomere, Macromeres and Large and Small Micromeres). The corresponding group of cells are clustered according to this
CONTENTS 5
identity and generation. They form the unite of our study of variability in the sea urchin development. Cells are considered exchangeable within these groups: the description of the distribution of cell features is not affected by permutation of the cells. Therefore we rely on the de Finetti’s theorem to guarantee the use of empirical probability distribution as a good descriptor of individual cell feature distribution within a group of cells [8], [45].
Approximated parametric probability distributions within groups of cells and approx-imated independency of the cell features distributions between groups of cells is the basis for a multi-level data-driven probabilistic model of the cell lineage reproducing embryo-level dynamics for each specimen from measures of individual cell features. The same structure relating individual cell features and embryo level dynamics is found in each specimen. Parameters of the probability laws estimated empirically define uniquely in-dividual specimen. This structure serves as the basis for a prototypical model of develop-ment among the cohort representing invariant features while preserving intra-individual variability [186], [213]. We use the framework of Information Geometry [10], [159] to de-fine the prototype as the Kullback-Leibler centroid in the associated statistical manifold enabling to obtain a unique set of parameters representing the cohort.
In addition to representing quantitatively every measured cellular processes, this model addresses formally and quantitatively the question of regulation in development and the concept of morphogenetic field. Moreover it can be used to characterize a notion of struc-tural stability and irreversibility. Eventually, this multi-level data-driven probabilistic model will be employed as a basis for an hypothesis driven biomechanical model using the Meca-gen modeling platform. This model enables a spatial embedding of the prototypical cell lineage, the values of biomechanical parameters are obtained by parameter exploration strategies and matching with empirical data leading to a phenotypic phase diagram [55], [186].
Overall, this work provides a picture of development where the reproducibility of em-bryo level dynamics emerges from variability at the individual cell level. This picture con-trasts with the traditional view of the development as a finely tuned process. Chapter 1 describes this work at the broadest level, its reading doesn’t require a strong mathematical background. Chapter 2 provides a more mathematical description of the multi-level data-driven probabilistic model of the lineage and the construction of the prototype. Chapter 3 discusses some perspectives raised by the model such as a notion of irreversibility of des-organization implied by the structure found in the embryos and a formal characterization of robustness of development.
Characterizing diversity In the second part, we will study the emergence of diversity in evolution and how it is shaped by development. The question consists in how to relate variations at the individual specimen level to variation at the population level and how to characterize the influence of mutant development for diversification.
The variety of mechanisms at the origin of variation stimulate this question. In chap-ter 4, we try to characchap-terize variability in biology with respect to formalization in math-ematics and physics. The review of the main mechanisms sources of variation shows an heterogeneity of processes, from genetic mutations [139] to stochastic gene expression [65], through epigenetic changes [9]. The timescales at which they operate and their vari-ous mechanisms of inheritability are obstacles for their integration, although they all con-tribute to the generation of diversity. We then turn to mathematics and physics to explore the characteristics of the frameworks used for the formalization of uncertainty. Proba-bility theory offers a framework to handle events in a context of uncertainty but doesn’t provide any definition of randomness itself. This framework, following Kolmogorov’s ax-iomatisation, rely on the boolean algebra of sets to construct the set of events (σ-algebra) which is a model that may show some limitations, for example in the case of quantum me-chanics. Chaos theory and ergodic theory are two frameworks in classical physics which provide two different characterizations of randomness [14]. In both cases, it is an epis-temic concept. Quantum mechanics on the other hand rely on an objective use of ran-domness, as an intrinsic component of the object under study. The Hilbert space struc-ture used in quantum mechanics probabilities enables operations that were not possible in the Kolmogorovian framework such as a tensor product between space of possible cor-responding to different observables [19]. Finally, we will argue that, given the high com-plexity of biological organisms and the heterogeneous nature of the mechanisms source of variability, an alternative approach consists in using models to explore the repertoire of possibles although they will always provide an incomplete description of the space of possible.
The experimental study of the squint mutant line of the zebrafish Danio rerio will then bring an example of variable phenotypic expressivity and incomplete penetrance [169]. The results of a quantitative assessement of the distribution of phenotypes in the progeny of homozygote mutants shows a discrete list of phenotypes that may be incomplete and in unpredictable proportions. This experimental study is then the basis for an analogy with the mathematical framework used in quantum mechanics, since the traditional Kol-mogorovian framework shows some limitations when the description of the space of
pos-CONTENTS 7
sible is incomplete. The analogy rely on the possibility to use the Hilbert space vector space structure and the possibility to perform tensor products between spaces of possi-ble. By differentiating between uncertainty at the level of the observables, at the level of possible phenotypes and the probability of obtaining these observables, we will clarify some aspects of biological variation [211]. In particular, this framework can handle the emergence of new observable and the emergence of new phenotypic value for a given ob-servable. We obtain a formal analogy with entanglement in Mendel’s idealized scheme of inheritance that is interpreted as a trace of biological organization.
Finally, we will explore the concept of an ontogenetic tree, which is an attempt to or-ganize divergence patterns between developments among mutants of the same species [101]. This question relates to the concept of developmental constraints or canalization, and is a first step toward an understanding of how variability in development shapes the space of possible forms [5]. We show with a data set containing a large number of descrip-tion of mutant developments [29] that the zebrafish’s pharyngula stage is actually the stage from which the highest number of mutants begin to diverge. However, possible biases in the data set are discussed.
Quantifying shape In the third part, we focus on epithelial organization and on the traces left by individual histories. The relative universality of this structure allow to study variability among several species and within mutant developments. Epithelial morpho-genesis results from a sequence of events involving cell proliferation, cell movement, cell death and cell extrusion, leading consequently to a complex landscape. Using a data set of epithelial images, we will consider the quantitative characterization of the network of cel-lular contacts [67]. The network of celcel-lular contacts gives a good estimation of epithelial organization, however traditional tools from complex networks theories show some lim-itations for its study since this network is highly constrainted by the underlying topology of the tissue.
A similar problem arise when trying to characterize the structure of the cosmic web. It is an historical structure shaped by random events at various scales which forms a com-plex landscape. Using a discrete analog of the approach developed in [200], [38] we pro-pose to compute topological invariants of the network of cellular contacts by adapting the framework of persistent homology. To this aim, we begin by considering a discrete version of the level set functions on the network using the number of neighbors as the parameter. The number of neighbors is used as a measure of "density" in the network. Computation
of the sub and super level sets with varying threshold for the parameter number of neigh-bor generates two filtrations, i.e. two sequences of nested subspaces, from a network. These sequences unfold the structure of the network. For each value of the parameter, Betti numbers can be computed on the corresponding subspaces of the filtrations. These Betti numbers roughly measure the i-th dimensional holes in the considered space and are topological invariants. The sequence of Betti numbers values obtained when explor-ing the range of value of the parameter enable to compute a persistence diagram which is a topological signature of the network. This signature is automatically extracted from confocal images of epithelia from Drosophila and Chick embryos. It is used to compare and classify tissues.
To make sense of these topological signatures, we introduce a model of random tri-angulated surface. This model has the same number of neighbors distribution as the empirical network, nodes are linked randomly to form a triangulated surface. The topo-logical signature is computed on this model of random triangulated surface and enable to estimate the distance of empirical networks to a random spatial distribution of cells. Sig-nificant deviation from the random model is obtained for the different cases studied; non randomness of the spatial distribution is a measure of the influence of the morphogenetic process for the construction of the network of cellular contacts. It shows that events occur-ring at the individual cell level have an influence on the global morphology of the tissue. The role of Myosin II, an element of the cellular cytoskeleton, is estimated by comparing the results of the method on knocked out mutants and wild type embryos. Overall we show that the level of organization of the cell cannot be uncoupled from the tissue organization. This study is reported in chapter 8 and in [209], [212].
Finally, we consider the dynamical aspects of the network of cellular organization by proposing some perspective on possible characteristics that could be computed on devel-oping tissue. These dynamics involve the branching structure of the cell lineage as well as its spatial unfolding. They are described in chapter 9.
Part I
Characterizing normality
Introduction
In this part, we investigate the question of the reproducibility of development in nor-mal conditions. This question is crucial for developmental biology. Embryogenesis has been believed to be highly reproducible and finely tuned leading to the metaphor of the "execution of a program" encoded in the genes [111], [76].
In the last decade, the reproducibility of the development of the Drosophila early de-velopment has been quantified at several level of observation and has been shown to be highly reproducible in particular at early stages. At the genetic level the quantification of the morphogen concentration profiles such as Bicoid indicates a reproducibility with 10% variation, interpreted as a precise control over absolute concentrations and responses to small concentration differences. At the cellular level, the cell membrane lengthening dur-ing cellularization of the Drosophila is a highly reproducible process ([130], [72], [59]) al-lowing to calibrate measurements very accurately. At a more macroscopic level the fly wing vein patterns are highly reproducible, the precision is in the range of a single cell width [1].
For the sea urchin, Eric Davidson proposed the idea of an "invariant cell lineage" [51]. In the seminal article by Sultan and Horvitz the lineage of the nematode sea elegant
Caer-nohabidtis elegans has been shown to be reproducible at the single cell resolution [202].
However, until now, characterization of the development of the sea urchin at single cell resolution has not been performed. The work presented in this part concerns the quanti-tative study of sea urchin development at the single cell resolution.
Quantitative and integrative approaches in developmental
biology
Quantitative approaches in developmental biology require to integrate dynamics oc-curring at several scales. Several steps are needed to understand the mechanisms
ring at these various scales, from data acquisition, to reconstruction, to modeling. The BioEmergences platform2has been pioneer in this field. The approach conceptualized by Nadine Peyriéras and Paul Bourgine is summarized in the epistemological triangle as represented on figure 1.
Figure 1: BioEmergences epistemological triangle showing the various steps required from data acquisition, to phenomenological reconstruction, to modeling - Image courtesy of the BioEmergences platform see footnote 2
The first step consists in producing an accurate in toto and in vivo image acquisition of the embryo development. This step involve the development of efficient imaging tech-nologies. The most popular technologies are two-photon microscopy [57], [97] and light sheet microscopy [206], [166]. The concept of two photon microscopy consists in excit-ing fluorophores which can be of different kinds and are distributed at relevant places in the embryo using two photons reaching the desired energy level when they converge and superpose at the focal point. This technique enables deep imaging in living tissues. The concept of the light sheet microscopy consists in using a thin sheet of light instead of light focused on one point, this technique enables quicker image acquisition but require to ro-tate the sample. Fluorophores consist most of the time of fluorescent proteins which are translated from RNA injected at a precocious stage. These fluorophores commonnly fuse to the membrane of the cell or to the nucleus. These techniques enable to measure de-veloping embryo without perturbing their normal development. The data sets obtained
13
consist in 3-dimensional images at regular consecutive time steps [149], therefore 4D raw data as indicated on the bottom left of the epistemological triangle on figure 1.
The second step consists in extracting biologically relevant information from the 4D raw data sets. This step is done through image processing. In particular, the position of the cell nuclei at each time step is a relevant information to reconstruct the spatiotem-poral cell lineage [16], [163]. In many studies the shape of individual cells carries useful information [185]. From this phenomenological reconstruction, useful features can be ex-tracted, such as the position and velocity field of cells [147], other cinematic description of morphogenesis can be found in [132]. The accuracy of the phenomenological recon-struction can be assessed through visual inspection by experts using visual platform such as the MoveIt software [70].
Once the phenomenological reconstruction has been established for one or several embryos, it is useful to propose theoretical hypotheses to interpret the data. These hy-potheses can be extracted from the data [109], [108], [28]. Or they can be brought from ex-ternal knowledge, for example physical hypotheses or previous experimental results [55], [220], [219], [96], [18], [75], or information theoretic approaches such as the concept of complexity [79], [13].
The main question that remains is how to compare theoretical assumptions with em-pirical data, given the variability at all scales observed in developing embryos.
Multi-level approach for the study of the sea urchin early
em-bryogenesis
The sea urchin Paracentrotus lividus is a model organism widely used in developmen-tal biology. Sea urchin’s embryos have many advantages that led to this status of model organism. The eggs are easily accessible, fertilization can be controlled, embryo are trans-parent and develop quickly, enabling their observation with microscopy techniques [69]. The use of the sea urchin for embryology can be traced back to the XIXth century, be-ginning in 1847 with three publications documenting fertilization, "Sur le développement des oursins" (On the development of sea urchins) by Adolphe Dufossé, "Auszug aus einem Berichte des Akameikers v. Baër, aus Triest" (Excerpt from a report by the University Grad-uate von Baër in Trieste), by Karl Ernst von Baër and "Observations sur le mécanisme et les phénomènes qui accompagnent la formation de l’embryon chez l’oursin comestible" (Observations on the mechanism and phenomena accompanying the formation of the
embryo of the edible sea urchin), by Alphonse Derbès [31]. These studies were followed by a famous work by Oskar Hertwig on sperm and egg pronuclear fusion in 1876. In 1891, Hans Driesch used the sea urchin to perform experiments on development, showing that a complete embryo could develop from extracted cells refuting preformation and mosaic theories.
During the XXth century the sea urchin has been the basis for major discoveries. Tim Hunt and collaborators discovered the role of cyclins in the sea urchin development, which are key regulators of the cell cycle [68]. The sea urchin development has also been used as a basis for the comprehensive study of the gene regulatory network [53]. The most recent development of this approach can be found on the biotapestry website3.
Figure 2: Diagram representing the first steps of the sea urchin cleavage patterns, from [83]
As any multicellular organism, the sea urchin develop from a single fertilized egg. It undergoes a radial holoblastic cleavage, meaning that all the cell divide in a stereotypic way, with division axis either parallel or at right angle with what will become the animal vegetal axis. The first and second cleavages are both meridional and perpendicular to each other, as shown on figure 2. They are followed by an equatorial cleavage perpendicular to them. The three first cleavages divide cells symmetrically, leading to a symmetrical 8-cell blastula. The fourth division round is different of the first three, the animal and the vegetal tier don’t divide similarly. The cells of the animal tier divide meridionally into eight cells
15
with similar volumes called the Mesomeres cells. The cells of the vegetal tier don’t divide symmetrically, the division occur in the equatorial plan, producing four large cells called Macromeres, close to the Mesomeres, and four small cells called Micromeres at the vegetal pole. At this 16-cell stage where the morphological symmetry breakings occur, the cells are well identifiable. The next round of division is equatorial for the Mesomeres, forming two tiers of eight similar cells. The Macromeres divide meridionally, forming a tier of eight cells below the Mesomeres. The Micromeres divide somewhat later forming two sets of cells, four Large Micromeres and four Small Micromeres. The Small Micromeres divide once more, then cease dividing before the larval stage, see figure 3. When the embryo has attained the 32-cells stage, it has begun to form a blastocoel which is a proteinaceous fluid within the embryo, and during the next rounds of division which are less stereotypical, cells organize themselves as a single layered epithelium surrounding the blastocoel.
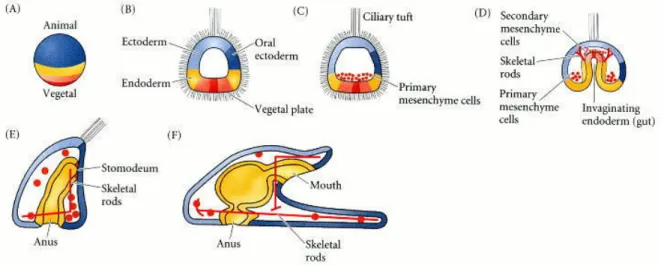
Figure 3: Normal sea urchin development, following the fate of the cellular layers of the blastula. (A) Fate map of the zygote. (B) Late blastula with ciliary tuft and flattened vegetal plate. (C) Blastula with primary mesenchyme. (D) Gastrula with secondary mesenchyme. (E) Prism-stage larva. (F) Pluteus larva. Fates of the zygote cytoplasm can be followed through the color pattern. (Courtesy of D. McClay.) - Image and caption from [83]
At the end of the cleavage period, which correspond to proliferation without cell death and without many cell movements within the blastula, the cells begin to undergo com-plex morphogenetic movements. Figure 3 shows a schematic drawing of this gastrulation movements which will later give rise to a free swimming pluteus larva.
The study of the sea urchin gene regulatory network (GRN) underlying development lead to the establishment of maps of interaction such as the one represented on figure 4 for
Mesomere cells during the period from 6 to 17 hours. Obtaining such a map require to test each gene individually. On the scheme, each gene is represented with its name (e.g. Nodal or Lefty), and the links between the genes represent interactions such as induction or inhi-bition. We can observe the modularity of this network which depend only on signals from Mesomere cells, except for some maternal inputs and the expression of the gene Wnt8 in the cells Veg2 (a subpopulation of the Macromeres lineage). The establishment of the gene regulatory network has been described in [53] and contains more than 40 genes. The dynamics in space and time of this gene regulatory network has been studied as a boolean computational model [171], it is argued in this article that the data underlying this gene regulatory network contains sufficient information to explain the complex developmental process of gene expression. The main limitation of this approach is that the spatial resolu-tion is coarser than the individual cell level where interacresolu-tions between genes take place. This limitation can be overcome with analysis at the single cell resolution such as the one presented in this part of the dissertation.
In the following we propose to investigate quantitatively the morphogenesis of the sea urchin Paracentrotus lividus from the 32-cells stage to more than 400 cells, by observing the phenomenology of individual cells, shape and proliferation dynamics.
17
Figure 4: Diagram representing the gene regulatory network of the Mesomeres during 6 to 17 hours post fertilization in the sea urchin Strongylocentrotus purpuratus from Eric Davidson’s website at Caltechhttp://sugp.caltech.edu/endomes/as of January 21, 2015
Overview of the part
The main object of this part of the dissertation is the comparative study of a small cohort of digitally reconstructed sea urchin embryos from in toto and in vivo 2-photon microscopy imaging. Using the BioEmergences workflow, the complete reconstruction of the cell lineage and individual cell shape is obtained for 5 wild type embryos. The question which is raised by this data set is how to characterize intra-individual variability which underlies cell differentiation and inter-individual variation associated to individual de-velopmental histories. Given the multi-scale nature of the embryonic development, the answer to this question depends on the level of observation chosen. Indeed, features at the individual cell level can be very variable from one individual to the other, whereas embryo-level dynamics appear highly reproducible.
The original approach that we develop to integrate these various levels of observation is summarized on figure 5. Based on the image acquisition and the phenomenological reconstruction, a set of features is obtained for each individual cells. These features are the length of the cell cycle, the division, the mean volume, the mean surface area, the mother/daughter volume or surface area ratio. Since we have access to the complete lin-eage, it is possible to follow their evolution through the genealogy. At a more macroscopic level, we can look at embryo-level dynamics such as the evolution of the number of cells through time, the evolution of the total cell volume, the evolution of the total cell surface area.
To integrate the various levels of observation, we defined an intermediate coarse-grained level of observation between individual cell features and embryo-level dynamics by clus-tering individual cell features into identifiable groups of cells. These groups are defined by common cell identity (Mesomeres, Macromeres, Large and Small Micromeres) and com-mon generation (number of cycles undergone since fertilization), hence identifiable in each specimen of the cohort. This generic coarse grained level of observation is the basis unite of our comparative study. It allows to compare individual characteristics without averaging out intra-individual variability.
The link between individual cell features is characterized with a data-driven multilevel probabilistic model relying on this intermediate level of observation. Individual cell fea-tures distribution can indeed be described and approximated through parametrized prob-ability distributions. These probprob-ability distributions are then combined using the branch-ing structure of the cell lineage. The parameters governbranch-ing the probability distributions
19
provide a signature of each individual specimen in the cohort. They are distributed in a statistical manifold where inter-individual comparison can be performed.
Figure 5: Scheme representing the proposed approach to quantify inter individual vari-ability in the sea urchin development and produce a prototypic model.
After having characterized intra- and inter-individual variability in the development of the sea urchin, it is interesting to ask for the possibility of representing uniquely the development in a quantitative manner. This question is answered by establishing a pro-totypical representation of the cell lineage as the centroid of the cohort in the statistical manifold. This prototype can then be used as a basis for an hypothesis based modeling of morphogenesis. Indeed, this prototype enables to integrate quantitative parameters val-ues in a biomechanical model, which can then be compared to empirical data on aspects
not belonging to the input of the model.
Chapter 1 describes the sea urchin’s development in a cohort of digitally reconstructed specimens. The specimens have been observed under normal condition and correspond to a typical range of variability occurring in a normal development. This chapter repre-sents a complete integrative approach for the study of development morphogenesis, as it combines empirical measures, digital reconstruction, data analysis. Establishment of a prototypical model for proliferation and cell volume dynamics enables to test biomechan-ical hypotheses through parameter exploration with a biomechanbiomechan-ical model.
Chapter 2 describes the data-driven multi-level probabilistic model underlying the analysis presented in chapter 1 in depth. It requires some mathematical background. The contribution of this chapter is the establishment of the prototype
Chapter 3 discusses some perspectives of the multi-level probabilistic for our under-standing of embryogenesis, such as the concept of irreversibilty of desorganisation during the considered period of development because of the lack of regulation of individual cell features.
Chapter 1
Predicting sea urchin’s normal
development from a small cohort of
digital embryos
AbstractThe quantitative comparison of developing sea urchin embryos from a small cohort of digital specimens is the basis for the construction of a prototypic cell lineage tree, sufficient to predict the spatio temporal cell organization of a normal sea urchin blastula. This is achieved i) by finding the statistical models fitting best the phenotypic macroscopic phenotypic features, ii) and embed the corresponding artificial prototypic cell lineage in the 3D space via a biomechanical model. The resulting 3D model is made to systematically explore a space of parameters to fit the experimental data in order to test biological hypothe-ses.1
1.1 Introduction
The question of finding the time and the locus for the apparition of differences be-tween individuals has irrigated the science of embryology ([111]). Large genetic screens have sought to find genetic determinants of these differences ([161], [92]). The construc-tion of the genetic regulatory network of the sea urchin should reveal the dynamics of
1. This chapter is an early version of a paper involving Barbara Rizzi, Louise Duloquin, Julien Delile, René Doursat, Paul Bourgine and Nadine Peyriéas - This study has been presented under various forms at the conferences "The developmental biology of the sea urchin" XXI and XXII, at Woods Hole, MA, USA (2012 - 2014) and at the Gordon Research Conference "Stochastic physics in biology" at Ventura Beach, CA, USA (2015)
these determinants during development ([53]). However, recent results have shown that the linear relation between genetic regulatory network and phenotype can be complicated by stochastic ([181]) effects. On the other hand, physical determination and constraints at the scale of the tissue or of the whole embryo canalize the space of possible shapes ([189], [94], [74]). Relating these two approaches, genetic determinants and physical con-straints at the scale of the tissue, requires to understand the relations between individual cell phenomenology and transformations at the whole embryo level. Phenomenological reconstruction of live embryo development ([163]) generates data that allow to investigate quantitatively such questions. We propose to use the full digital reconstruction of a small cohort of developing sea urchin to unfold the relations between cell, tissue and whole em-bryo dynamics.
The sea urchin has been studied as an animal model since over a century ([66], [144]). The study of early embryogenesis provides insight in differentiation of cells in the differ-ent layers ([53], [52]). The description of the morphogenetic changes associated to these differentiation processes are lacking a quantitative description. In particular the quanti-tative study of the sea urchin blastula development is a good model to tackle this problem because the morphogenetic changes are undergone smoothly by the embryo allowing live imaging over a long period of cleavage.
The full digital reconstruction of live specimen reveals simultaneously quantitative features at the individual cell level and at the scale of the whole embryo. The develop-ment is orchestrated by changes in size, shape, number, position and gene expression of cells. The question remains of how these quantities are related to each other and in which way do the macroscopic dynamics of the development emerge from the micro character-istics of the cells. Are the individual cell features aggregated together in a unique precise way that would create the precise patterns that we observe, suggesting a precise devel-opmental mechanism regulating the development, or the global dynamics emerge from loose relations between the cells, favoring robust emerging process.
1.2 A small cohort of digital sea urchin throughout their
cleav-age period
The quantitative comparison of the cell lineage and cell behaviors was achieved through the full reconstruction of digital specimens from 2-photon microscopy imaging of live em-bryos. Nuclear and membrane staining obtained by 1-cell stage injection ([70]) of
syn-23
(a)
(b)
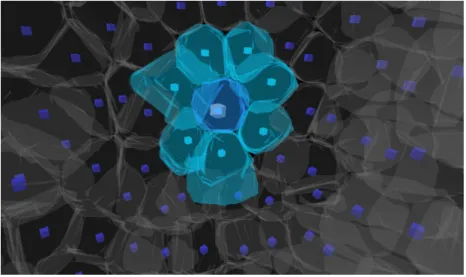
Figure 1.1: (a) Reconstruction of digital specimens from 3D+time in toto imaging. First line - Volume rendering of raw images from 2-photon laser scanning microscopy, H2B-mCherry and farnesylated eGFP staining. Second line - Nuclei detection and cell tracking. Coloured dots represent the cell positions, cell trajectories displayed as streamlines over the next 5 consecutive time steps. Third line - Surface rendering of segmented cell mem-branes. Color code: Mesomeres (blue), Macromeres (red), Large (pink) and Small (purple) Micromeres. (b) Temporal sequences covered by the imaging of the five different speci-mens analyzed in this study.
thetic mRNA encoding H2B-mcherry fusion protein and farnesylated eGFP respectively, was used to image embryos developing from the 32-cell stage until the hatching blastula stage (Figure 1.1 - 1st line). Image data sets were processed through the BioEmergences reconstruction workflow ([70]) to provide the complete cell lineage (Figure 1.1 - 2nd line) and the segmentation of cell shapes (Figure 1.1 - 3rd line). The visualization interface Mov-IT ([163]) was used to validate and correct the cell tracking and manually label cells according to their distribution in known populations ([11]).
1.3 Feature Extraction and Measuring
To define normal sea urchin’s development we used 5 developing specimens imaged in similar experimental condition with the same set up. Acquisition lasted from 2 to 8 consecutive hours with a time resolution of 2 to 4 min, beginning 4 to 5 hours post fertil-ization (32 cells - Figure 1.1 (d)). Cell lineage combined with cell segmentation provides the life length and division time of cells, as well as the volume and surface area (Chapter 2 -section 2.3.1). Mesomeres, macromeres and large and small micromeres cell populations were marked at the 32-cell stage.
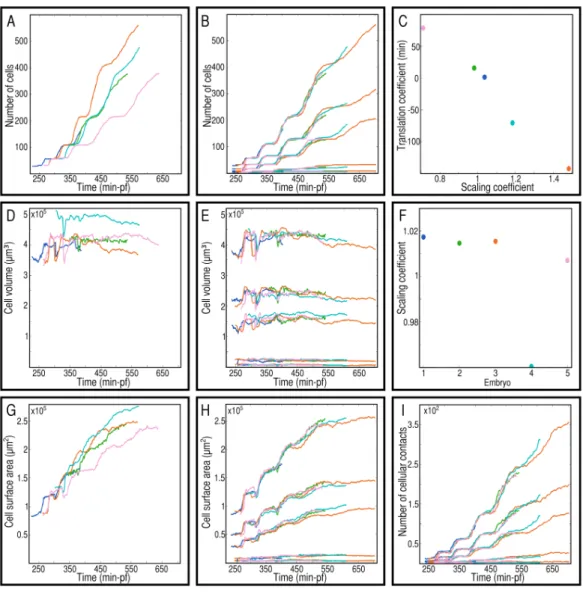
Morphological changes at the embryo-level are witnessed by the evolution of the num-ber of cells, the cell volume and the cell surface area (Chapter 2 - Figure 2.4 A, D, G). These dynamics have similar patterns in each specimen of the cohort. However spatio tempo-ral rescaling overcome a first level of interindividual variability, making these dynamics comparable from one embryo to the other, in whole embryo and in each morphogenetic field (Chapter 2 - Figure 2.4 B, E, H). It consists in an affine transformation of the time de-pendency (two parameters - Chapter 2 - Figure 2.4 C) and a linear transformation of the spatial dependency (one parameter - Chapter 2 - Figure 2.4 F).
To compare quantitatively cell features among specimens of the cohort, it is necessary to find generic coarse-grained levels of description because symmetries of the embryo prevent to identify individual cells (Chapter 2). Relying on exchangeability of the cell fate at this period for cells belonging to the same population (Mesomeres, Macromeres, Large micromeres, Small micromeres), cells were clustered in groups of cells sharing identity and generation. These groups of cells forms the basic unit for the comparison and model-ing in this study of the sea urchin development.
1.4 Emergence of embryo-level dynamics from individual
cell features
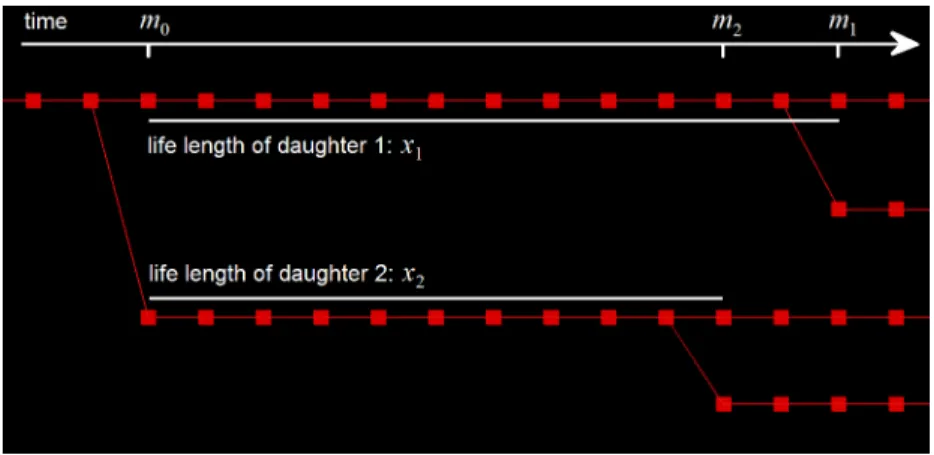
To relate the macroscopic dynamics with the individual cell features, we propose a data-driven multi-level probabilistic model of the cell lineage which rely on its branching nature. After each cell cycle, a cell divide into two. The features of the cells are chosen ran-domly using the corresponding probability distributions defined for each groups of cells independently of any genealogical relationships (Chapter 2 - section 2.5). The macro-scopic dynamics observed in each embryo and within each morphogenetic fields are
ac-25
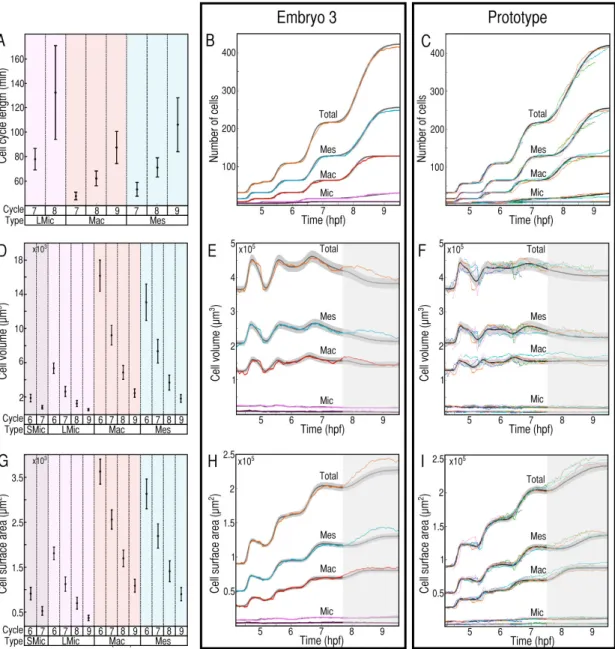
Figure 1.2: Probabilistic modeling. Each individual of the cohort is associated to one color. The black lines with grey intervals correspond to 300 realizations of the model, mean (black) and standard deviation (grey). The first column (A,D,G) shows the value of the pa-rameters, cell cycle lenth, cell volume, cell surface area for the prototypical representation of the cohort. The second column (B, E, H) corresponds to the model for one individual of the cohort. The third column (C, F, I) corresponds to the prototypical model over the cohort. The first line (B,C) shows the evolution of the number of cells, relying on the dis-tribution of life lengths in the different subpopulations (A). The second line (E,F) shows the evolution of the cellular volume, relying on the distribution of the volume (D). The third line (H,I) shows the evolution of the cellular surface area, relying on the distribution of the surface area in the different subpopulations (G).
curately reconstructed with empirical parameters for each group of cells (Figure 1.2 B, E, H). Variability in the division times results from the successive addition of variability in the life lengths, leading to a continuous desynchronization of the cell cycles (Chapter 2). The variation in the total cellular volume and surface area result from variable mean char-acteristics with invariant cell dynamics (Chapter 2). These results suggest that the high reproducibility of embryo-level dynamics emerges from individually loosely regulated cell features within a branching structure and population level characteristics.
Each specimen of the cohort is represented by a set of parameters sufficient to repro-duce embryo-level dynamics. The cohort is represented as a set of points in the associ-ated statistical manifold and the prototypical representation of the cohort is defined as the centroid of the specimens in this parameter space (Chapter 2 and [10], [159]). Proto-typical statistics for the groups of cells are defined using this methodology (Figure 1.2 A, D, G). Intraindividual variability is represented by the prototypical standard deviation com-puted for each cell feature. A representation of the normal development of the sea urchin during cleavage is obtained by simulating prototypical embryo-level dynamics from the probabilistic model (Figure 1.2 C, F, I).
1.5 Spatial modeling
To understand the relations between the individual cell features and the shape of the embryo, the prototypical model of the cell lineage is embedded in space with a biome-chanical model using the MecaGen modeling platform (Figure 1.3 A - [55], [56]). Each cell is represented by a single cylindrical particle oriented along the apico-basal axis of the epithelium (Figure 2.18). As cells are extremely small and sticky (low Reynolds number, [179]), inertia is neglected in favor of viscosity forces and the cell displacement is caused by their immediate mechanical interactions. Thus, the relation between displacement and the net force applied on cells by their neighbors is ruled by an overdamped equation of motion. At the bastula stage, the increasingly epithelial nature of the cells induces a de-composition of the force exerted between two neighbors into a set of tangential and nor-mal components: the attraction-repulsion force maintains the integrity of the cell volume and controls the stiffness and the adhesion of interaction in the tangential direction, and the planarity conservation force maintains the planarity of the monolayered sea urchin epithelium (Figure 1.3 B,C). In between a pair of neighbor cells, the attraction coefficient varies depending whether the pair belongs to the same subpopulation (homotypic) or not
27
Figure 1.3: A. Each dot represents a cell center, the edges relating them are calculated from the two steps spatial neighborhood algorithm, via metric and topological criteria. The red axes represent the cell axis ~Ui oriented along the apico-basal direction.
Mem-brane surfaces are calculated a posteriori for rendering purpose. Color indicates inden-tity similar to figure 1.1. B. Intensity of the attraction-repulsion force ~F∥exerted between two neighbor cells as a function of their relative distance. This force displays a similar shape to interatomic potential derived forces like Morse or LennardJones (Chapter 2 -Figure 2.6). The force well is modulated by varying the appropriate attraction coefficient
wadh. C. The cell axis ~Ui (red arrow) is calculated by averaging the 6 surrounding triangle
outward normal vectors (light red arrows). D. Phenotypic phase diagram, axis correspond to (wadh,e, wadh,o) with krig= 10000 and αgab= 1.0. Four distinct phenotype domain are obtained when exploring the parameter space. Figure by Julien Delile
(heterotypic). Cell division timing follows the prototypical probabilistic model mentioned above (Chapter 2) and their orientation is performed in the tangential domain with an angle chosen randomly using a uniform distribution.
Parameter space exploration determines the parameter sets which govern realistic spa-tial enfolding of the sea urchin embryo development. Validation uses the sphericity of the global embryo shape, the maintenance of the monolayered epithelium and the similar-ity of the inter-subpopulation border shapes with those observed in the digital embryos (Chapter 2 section 2.7). The best fitting domain is obtained for low heterotypic adhesion, confirming that clear-cut border can be obtained without the need of biasing the division orientation (Figure 1.3 Db:Mean). Moreover, when the attraction-force intensity is larger than the planarity force intensity, the embryo epithelium agglomerate into 3D aggregate. This transition runs through different phenotypic states: from the highly spherical and planar embryos to the collapsed magma of cells, some starfish shaped embryos may ap-pear in the parameter region where planarity is obtained even in the absence of sphericity (Figure 1.3 - D).
1.6 Discussion
In summary, we demonstrate that, despite interindividual variability during cleavage period, it is possible to uncover underlying invariant structures driving macroscopic dy-namics and morphological changes. Their reproducibility emerge from loosely regulated cell features along the branching cell lineage. In particular we show that the desynchro-nization of cell division increases continuously during cleavage, and not as successive pe-riod of synchronicity, metasynchronicity and asynchronicity as previously stated ([83]). And if a pseudo gradient from vegetal to animal has been suspected ([60]), our study sug-gests that it results from the characteristics of cell life length variability and does not nec-essarily need a material support.
By finding a relevant generic coarse-grained level of observation to compare specimen we overcome the problem of intraindividual variability and symmetries that arise from multiscale observations. Modeling of the cell lineage and its 3D biomechanical embed-ding assure the sufficiency of the characteristics defined at the level of groups of cells to describe accurately the development of one specimen of the cohort, thus suggesting a reg-ulation at the level of popreg-ulations of cells and not at the level of individual cells. This pe-riod of development may not need to require a fine tuned genetic regulation. This sparse
29
description of the development for each specimen lead to the modeling of a prototypical embryonic development which is the centroid of the cohort in the space of models. This prototypical representation defines the normal development with a generality level guar-anteed by the number of specimen in the cohort. This framework may form a basis to bridge the gap between experimental biology and theoretical biology.
Chapter 2
Variability in the sea urchin development:
A multi-level data driven probabilistic
model
AbstractThis chapter describes a data-driven multi-level probabilistic underlying the comparative study of a small cohort of digital sea urchin embryos presented in chapter 1. To relate individual cell features with embryo-level dynamics, it is necessary to define an intermediate generic coarse-grained level of observation. This level enables to characterize probability laws that are the basis of a comprehensive probabilistic model. Correspond-ing parameters are distributed in a statistical manifold where each embryo is identified by a small set of points. A prototype is obtained by computing the Kullback-Leibler centroid among specimen of the cohort. This prototype serves as a basis for a spatial embedding through biomechanical modeling with the MecaGen platform.1
2.1 Introduction
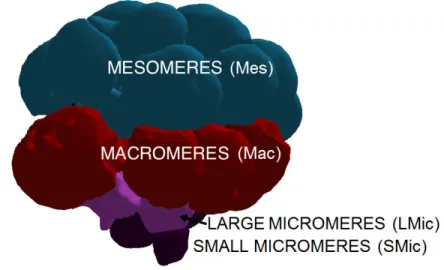
The development of the sea urchin blastula from 32 to 540 cells happens through cell proliferation with no cell death. Early embryonic territories and cell morphology allow to categorize cells according to known cell types, namely Mesomeres, Macromeres, Large Mi-cromeres, and Small Micromeres [50] as represented on figure 2.2. Symmetry by rotation along the animal vegetal axis as well as cellular variability prevent to identify individual
1. The establishment of the multi-level data-driven probabilistic model has highly benefited from ad-vices by Paul Bourgine whom we warmly acknowledge
![Figure 2: Diagram representing the first steps of the sea urchin cleavage patterns, from [83]](https://thumb-eu.123doks.com/thumbv2/123doknet/13080940.384782/29.918.229.693.414.727/figure-diagram-representing-steps-sea-urchin-cleavage-patterns.webp)