HAL Id: hal-01091919
https://hal-mines-paristech.archives-ouvertes.fr/hal-01091919
Submitted on 7 Dec 2014
HAL is a multi-disciplinary open access
archive for the deposit and dissemination of
sci-entific research documents, whether they are
pub-lished or not. The documents may come from
teaching and research institutions in France or
abroad, or from public or private research centers.
L’archive ouverte pluridisciplinaire HAL, est
destinée au dépôt et à la diffusion de documents
scientifiques de niveau recherche, publiés ou non,
émanant des établissements d’enseignement et de
recherche français ou étrangers, des laboratoires
publics ou privés.
Review of satellite-based surface solar irradiation
databases for the engineering, the financing and the
operating of photovoltaic systems
Christophe Vernay, Sébastien Pitaval, Philippe Blanc
To cite this version:
Christophe Vernay, Sébastien Pitaval, Philippe Blanc. Review of satellite-based surface solar
irradia-tion databases for the engineering, the financing and the operating of photovoltaic systems. 2013 ISES
Solar World Congress, Nov 2013, Cancun, Mexico. pp.1383 - 1391, �10.1016/j.egypro.2014.10.129�.
�hal-01091919�
Energy Procedia 57 ( 2014 ) 1383 – 1391
ScienceDirect
1876-6102 © 2014 The Authors. Published by Elsevier Ltd. This is an open access article under the CC BY-NC-ND license (http://creativecommons.org/licenses/by-nc-nd/3.0/).
Selection and/or peer-review under responsibility of ISES. doi: 10.1016/j.egypro.2014.10.129
2013 ISES Solar World Congress
Review of satellite-based surface solar irradiation databases for the
engineering, the financing and the operating of photovoltaic systems
Christophe Vernay
a,*, Sébastien Pitaval
a,Philippe Blanc
baSOLAÏS, 400 avenue Roumanille, BP 309, 06906 Sophia Antipolis cedex, France bCentre Observation, Impacts, Energy, MINES ParisTech, C1 10207, 06904 Sophia Antipolis, France
Abstract
This paper explores the possibilities provided by satellite-based surface solar irradiation databases, for the attention of the photovoltaic actors, from the engineering and the financing to the operating of photovoltaic systems. First, the problematic of using meteorological ground stations for the determining of solar dataset or time-series is addressed with the example of the French national meteorological network and the focus made on the South-West part of France: the heterogeneity in terms of spatial and temporal representativeness along with the relevance of the delivered measurement are questioned. Then, an innovative synthesis of 16 satellite-based ISS databases available so far is presented through the distribution of their corresponding features within three categories: spatial and temporal representativeness, data type in terms of component and format, and finally operating mode for the retrieving of the data in terms of price and accessibility. The results of this review shall help photovoltaic actors making the correlation between the available satellite-based databases and their specific needs.
© 2013 The Authors. Published by Elsevier Ltd. Selection and/or peer-review under responsibility of ISES
Keywords: surface solar irradiation; satellite-based database; meteorological ground station; photovoltaic; bankable yield report; monitoring.
1. Introduction
Solar resource assessment is a recurrent problematic faced by all the actors of the solar industry, either photovoltaic (PV) or thermal solar. This paper focuses on PV but can surely be extended to thermal solar technology such as concentrating solar power (CSP).
PV project developers first need to identify the geographical areas where solar resource would match first basic criteria, by focusing on the yearly assessment of global horizontal irradiance (GHI) for classical PV projects or direct normal irradiance (DNI) for concentrated PV (CPV) technology. Once a site has been identified, the same developers along with engineering offices and bank institutes, through their own technical advisors, need to have an estimation of the electrical yield that is likely to occur during the life-time of the project, typically 20 years. For that purpose, simulation software such as PVSyst (www.pvsyst.com) considers the behavior of the whole system, from the modules to the transformers, when facing specific conditions in terms of ambient temperature, wind velocity and incident irradiance, i.e. global tilted irradiance (GTI) for PV and DNI for CPV. Hourly time-step or even less (10-min) is presently the baseline for CPV projects by means of typical meteorological years (TMY) [1, 2], i.e. 8,760 values for a typical year. For PV projects, empirical models are commonly used to derive hourly values of GHI from daily values (cf. Aguiar’s autoregressive Gaussian model [3]), daily values from monthly values (cf. Aguiar’s model [4]) and finally
* Corresponding author. Tel: +33 4 83 88 02 93
E-mail address: cvernay@solais.fr
© 2014 The Authors. Published by Elsevier Ltd. This is an open access article under the CC BY-NC-ND license (http://creativecommons.org/licenses/by-nc-nd/3.0/).
1384 Christophe Vernay et al. / Energy Procedia 57 ( 2014 ) 1383 – 1391
GHI to GTI (Hays’s or Perez’s models [5, 6]), as widely explained in [7]. Therefore, for the pre-feasibility studies of classical PV projects, the monthly GHI is the minimum information that is required; such a minimum data consists in a long-term average 12-month dataset, i.e. one mean value per month. Moreover, during the operating of the solar plant, the same actors along with operators and maintenance companies may need to evaluate the estimation of the local irradiance for a specific period, on a daily or hourly basis, in order to correlate the monitored electrical production with the effective resource and therefore to assess the overall performance of the system. As an illustration, these time-series may be required to face the outage in the monitoring of the irradiance sensors or to help in the extrapolation of the local measurement from one set of azimuth and tilt to another one. Finally, the emergence of harsh dispute between insurance companies magnifies the need for surface solar irradiance (SSI) database that must be reliable, flexible and up-to-date; this is typically the case when the abnormal sub-performance of a PV plant leads to the triggering of performance guarantee.
The need for assessing SSI has been addressed for several decades by the scientific community which has setup different methods and databases based on different types of observations: physical measurements from meteorological ground stations such as pyranometer and pyrheliometer, reanalysis of numerical weather prediction models and climate models, and finally images from geostationary satellites. Even though many papers have been published regarding most of the databases, their heterogeneity make the synthesis complex for PV actors who need SSI information: representativeness of the database, nature and sources of the data that is made available, and finally conditions for retrieving the data. This paper aims at addressing this problematic by making the link between the supply and the demand through a review of the available satellite-based products in order to eventually help PV actors in their choices.
2. Meteorological ground stations
2.1. Main networks measuring solar radiation
Solar radiation has been measured by national networks for several decades. Part of the collected data has been processed, in the scope of research programs, in order to setup – alas – few reliable networks with heterogeneous spatial coverage [8]: from about 50 ground stations for Baseline surface radiation network (BSRN [9]) and International daylight measurement program (IDMP, http://idmp.entpe.fr/) up to more than 1,000 for Global energy balance archive (GEBA [10]) and World radiation data center (WRDC, http://wrdc.mgo.rssi.ru/). As part of scientific research programs, the added-value for such databases mainly consists in the high-quality of the available data, considering that stringent requirements have been defined:
x The quality of the sensors;
x The periodic on-site maintenance along with sensor calibration;
x The quality-check procedure to ensure the reliability of the measurement [11].
Despite such a quality check, data aggregation (yearly, monthly, daily and even hourly) always needs to be viewed with a critical eye because of the missing data and the shading problematic that may differ from one ground station to another.
Major obstacles prevent PV actors from working with these databases. Firstly, the spatial distribution is likely not appropriate to the need; as an example, in continental France (543,965 km²), there are respectively 2, 2, 40 and 131 ground stations belonging to BSRN, IDMP, GEBA and WRDC networks. The use of such ground-based SSI dataset involves in general the use of spatial and temporal interpolation and extrapolation whose quality drastically decreases with the distance of the site of consideration with the nearest ground stations. Moreover the operating mode for retrieving the data is not straightforward and requires skillful and time-consuming processing which is not compliant with the time and cost constraints of any PV project. Finally, as part of Research programs, these databases are exclusively reserved for non-commercial activities with the exception of GEBA (whose data can be accessed for commercial applications via meteonorm – www.meteonorm.com), thus mitigating the added-value for project developers or engineering offices with commercial activities.
Such obstacles may partially disappear when considering the original national meteorological networks which more recently operate commercial activities based on their large number of ground stations measuring solar radiation. The case of the French national network operated by Météo France illustrates that the promising added-value might not be there due to several problems: spatial density of the station network, continuity and persistence of the temporal coverage, shadowing effects and maintenance quality.
2.2. Problematic of national networks: the example of Météo France network
Météo France is the French meteorological network which consists in 3,811 meteorological ground stations located in the country, among which only 327 used to or still measuring GHI. It is also to be noted that only 7 of them measured in the past the direct component of the SSI and, presently, only one is still measuring it. The analysis presented below focuses on the South-West quarter of the country (130,132km², 20% of the territory) whose irradiance level is suitable to PV project and where 61 ground stations measure this component (cf. Fig 1).
Fig. 1. Location of the 61 ground stations measuring GHI in the South-West quarter of France.
Fig 2a below depicts in blue the temporal coverage during which GHI measurements are available on an hourly basis; it starts in 1988 for 5 stations while the measurement of daily GHI starts in 1964. The figure highlights the heterogeneity in the duration which is between 2.5 and 25 years, with median equal to 10.5 years, along with, in some rare cases, the potential obsolescence with 10 stations which don’t measure GHI anymore; discontinuity of the measurement is also highlighted with 8 stations facing several interruption periods. The spatial representativeness of the network is also addressed in Fig 2b which presents the histogram of the geodesic distance between one ground station and its nearest neighbor. The median distance is equal to 40 km but it can go up to 166 km; this is typically the case for rural areas which are paradoxically more suitable to ground-mounted PV plants. Literature claims that, considering the spatial variability of the SSI compared to the typical satellite-based SSI estimation error, it is better retrieving hourly and daily irradiation from satellite databases rather than interpolating measurements from surface stations 20 to 25 km apart [12, 13, 14]; nevertheless it is to be noted that in some specific locations, for example without noticeable orography, monthly and yearly temporal aggregations may lead to a typical acceptable distance to the nearest ground station greater than 25 km. The spatial heterogeneity of Météo France network in the South-West of France is therefore questionable when considering the basic engineering of PV projects.
Fig. 2 (a) temporal coverage for hourly GHI measurement; (b) histogram of the geodesic distance.
G round s tat ion Year 1990 1995 2000 2005 2010 10 20 30 40 50
1386 Christophe Vernay et al. / Energy Procedia 57 ( 2014 ) 1383 – 1391
In addition to spatial and temporal representativeness, one shall always keep in mind the problematic associated with the delivery of ground based measurements: besides the quality of the pyranometers and the maintenance of the ground station which must be blameless, the location of the sensor within its local environment is of big concern. The impact of any close shading is obviously important and must be considered when manipulating measurements. For that purpose, Météo France network defines 5 classes for each ground station, depending on the shading of the instrument, as presented below; the associated distribution for the 61 sites is mentioned in brackets:
x Class 1 (24.6%): No shading when sun elevation is lower than 2°; x Class 2 (36.1%): No shading when sun elevation is lower than 5°; x Class 3 (14.7%): No shading when sun elevation is lower than 7°; x Class 4 (6.6%): Shading which is neither Class 1, 2, 3 nor 5; x Class 5 (0%): Shading during at least 30% of the sun course; x Information not available: 18.0%.
These figures show that only a quarter of the 61 sites are part of the highest class and that information is missing for less than 20% of the sites, thus reducing the representativeness of this database. This is all the more relevant when considering that such a classification does not take into account the impact of the surrounding relief [15].
Finally, the quality of the measurement must be systematically questioned, whatever the database is. What is the protocol used for the quality check? What is the protocol used for data aggregation when values are missing (e.g. hour-to-day)? These questions are addressed by the 4 renowned meteorological networks presented before (BSRN, etc.) with a promising transparency through scientific publications. Such may not be the case for national meteorological networks which must therefore be handled with care.
3. Satellite-based databases
3.1. Description
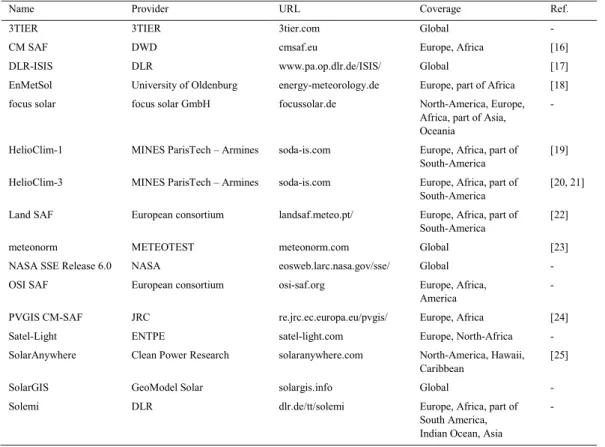
The main part of the present study consisted in analyzing the available satellite-based databases that may partially or totally fulfill PV actors’ needs. Table 1 below presents the overview of 16 databases available so far and which are still in operating condition. This list is surely not exhaustive and does not consider the databases with national coverage, nor the databases performing the reanalysis of weather forecasts such as NCEP / NCAR (National centers for environmental prediction / National center for atmospheric research) or ERA-Interim.
Each database has been studied based on the information provided by different sources: web service and peer-to-peer publication as listed in Table 1, other publications and finally either phone call or email exchange for the missing information. The gathered information is structured using three categories in order to address the main concerns of the actors in the PV domain:
“Representativeness” of the database deals with the geographical area covered by the satellite, its spatial and temporal resolution and the temporal coverage; the latter is related to both the duration, in year, and the updating strategy which may reveal the potential obsolescence of the database.
“Data type” deals with the SSI data itself, i.e. the product that is delivered to the end-user. It consists in the available component of the solar radiation (GHI, GTI and diffuse – DHI – for PV projects, DNI for CPV), the possibility to retrieve a dataset for a typical year through 12 monthly values and/or to work on time-series for a specific period and time sampling. The possibility to get TMY is not addressed in this study because it involves a complex processing of the raw solar radiation estimation along with the retrieval of other relevant meteorological parameters such as the air temperature or the wind speed.
“Operating mode” finally focuses on the process used for retrieving the data, from the availability of a graphical user interface (GUI), web services and/or offline request through email exchange, to the financial conditions for accessing the data.
Table 1. Overview of the satellite-based databases
Name Provider URL Coverage Ref. 3TIER 3TIER 3tier.com Global - CM SAF DWD cmsaf.eu Europe, Africa [16] DLR-ISIS DLR www.pa.op.dlr.de/ISIS/ Global [17] EnMetSol University of Oldenburg energy-meteorology.de Europe, part of Africa [18] focus solar focus solar GmbH focussolar.de North-America, Europe,
Africa, part of Asia, Oceania
-
HelioClim-1 MINES ParisTech – Armines soda-is.com Europe, Africa, part of South-America
[19]
HelioClim-3 MINES ParisTech – Armines soda-is.com Europe, Africa, part of South-America
[20, 21] Land SAF European consortium landsaf.meteo.pt/ Europe, Africa, part of
South-America
[22]
meteonorm METEOTEST meteonorm.com Global [23] NASA SSE Release 6.0 NASA eosweb.larc.nasa.gov/sse/ Global - OSI SAF European consortium osi-saf.org Europe, Africa,
America
-
PVGIS CM-SAF JRC re.jrc.ec.europa.eu/pvgis/ Europe, Africa [24] Satel-Light ENTPE satel-light.com Europe, North-Africa - SolarAnywhere Clean Power Research solaranywhere.com North-America, Hawaii,
Caribbean
[25]
SolarGIS GeoModel Solar solargis.info Global - Solemi DLR dlr.de/tt/solemi Europe, Africa, part of
South America, Indian Ocean, Asia
-
The accuracy of each database has been intentionally omitted because this indicator may vary from one study to another, depending on the considered location (spatial variability) and the time period (inter-annual variability); it is therefore very difficult to analyze and almost impossible to draw general conclusions. However, a large number of publications will help people having a good view of database accuracy, among which [26, 27].
The detail of the analysis of the 16 databases is available in the appendix.
3.2. Synthesis
Table 2 below presents the scoring scheme that has been applied for each category, thus resulting to Fig. 3 where the color gives an indication on how a database stands among the whole databases, from green for the highest score to red for the lowest score.
1388 Christophe Vernay et al. / Energy Procedia 57 ( 2014 ) 1383 – 1391
Table 2. Details of the scoring scheme
Category Sub-category score=1
lowest
score=2 score=3 score=4
highest
Representativeness Spatial coverage Smaller area Mono-satellite Multi-satellite Global Spatial resolution Lowest to highest resolution using a logarithm scale
Timeframe Lowest to highest period using a logarithm scale
Updating schedule None Potentially Periodically Day+1 Data type Components GHI only GHI & DNI Partially, among
GHI, DHI, GTI & DNI
All components Time step Monthly Dayly Hourly Sub-hourly Aggregation Dataset only - Time-series only Dataset &
time-series Operating mode Accessibility Offline request
only (Email)
FTP access only
Partial GUI/web service otherwise offline request
GUI / web service
Price Commercial - Free for scientific usage Free
Fig. 3. Synthesis of the scoring of the 16 SSI databases.
4. Conclusion
The first conclusion that can be drawn from the overall analysis of these 16 SSI databases is the absence of free database that would fulfill the whole needs presented before. Therefore, PV actor must consider the commercial products presented in this paper as a powerful mean for answering part or the totally of its needs. However, it can be mentioned that:
x For the performance assessment of operating PV plants, 5 out of 16 databases (31%) provide GTI time-series at a time step lower or equal to one day;
x For the processing of TMY in the scope of CPV studies, 9 out of 16 databases (56%) provide DNI time-series at a time step lower or equal to one hour.
The temporal representativeness of any database must be emphasized in order to match the required analysis. Long-term databases allow catching the typical on-site irradiance through dataset or TMY along with the inter-annual variability [1, 28]. These are key information for the processing of bankable PV yield reports through, for example, P50 and P90 indicators. The added-value of a long-term database that is no longer refreshed is also questionable considering that a yield report aims at estimating the solar resource for the lifetime of a future PV project, i.e. the next 20 years to come. Finally, the ability to deliver recent data through, for example, a day+1 updating scheme is crucial for the online monitoring of a PV plant and for in situ calibration process for which local measurement campaign must be properly monitored and potentially ended as soon as the convergence criteria of the calibration process is reached [29].
The list of SSI databases presented in this paper may not be exhaustive but it is certainly representative of the available databases so far. When assessing the typical irradiance of a given site, the averaging of several databases is therefore strongly questionable: what is the rationale for averaging the results of several databases which have different spatial or temporal resolutions and temporal coverage? Indeed, the uncertainty of the resulting SSI assessment is directly impacted by the interannual variability in case of databases with different temporal coverage and/or by the intra-pixel spatial variability in case of databases with different spatial resolution. In order to be scientifically consistent, one shall definitely focus on a single database whose characteristics are understood and then refine the satellite-based estimation through a calibration using local measurements [29].
For all these reasons, it is highly recommended to go deeper in the exhaustive results provided in the appendix in order to better understand the differences between each database and to objectively exploit the most appropriate one depending on the need.
References
[1] Vignola F,Grover C, Lemon N, McMahan A. Building a bankable solar radiation dataset. Solar Energy 2012;86:2218-2229.
[2] Espinar B, Blanc P, Wald L. D404.1: Report on the product S4: Typical meteorological year. Project ENDORSE 2012, www.endorse-fp7.eu/public_deliverables
[3] Aguiar R, Collares-Pereira M. TAG: a time-dependent, autoregressive, Gaussian model for generating synthetic hourly radiation. Solar
Energy 1992;49:167-174.
[4] Aguiar R, Collares-Pereira M. A simple procedure for generating sequences of daily radiation values using a library of markov transition matrices. Solar Energy 1988;40:269-279.
[5] Hay, J.E. Calculation of monthly mean solar radiation or horizontal and inclined surfaces. Solar Energy 1979;23:301–307.
[6] Perez R, Seals R, Ineichen P, Stewart R, Menicucci D. A new simplified version of the Perez diffuse irradiance model for tilted surfaces.
Solar Energy 1987;39:221-231.
[7] Ineichen P. Global irradiance on tilted and oriented planes: model validations. University of Geneva; 2011.
[8] Budig C, Orozaliev J, Vajen K. Comparison of different sources of meteorological data for Central Asia and Russia. Proceedings EUROSUN, Graz, Autriche, 2010.
[9] Ohmura A, Gilgen H, Hegner H, Müller G, Wild M, Dutton E.G, et al. Baseline Surface Radiation Network (BSRN/WCRP): new precision radiometry for climate research, Bulletin of the American Meteorological Society 1998; 79: 2115–2136.
[10] Gilgen, H, Wild M, Ohmura A. Means and Trends of Shortwave Irradiance at the Surface Estimated from Global Energy Balance Archive Data. Journal of Climate 1998; 11: 2042–2061.
[11] Roesch A, Wild M, Ohmura A, Dutton E.G, Long CN, Zhang T. Assessment of BSRN radiation records for the computation of monthly means. Atmospheric Measurement Techniques 2011;4:339-54.
[12] Perez R, Seals R, Zelenka A. Comparing satellite remote sensing and ground network measurements for the production of site/time specific irradiance data. Solar Energy 1997; 60: 89-96.
[13] Muselli M, Poggi M, Notton G, Louche A. Improved procedure for stand-alone photovoltaic systems using Meteosat satellite images. Solar
Energy 1998; 62: 429-444.
[14] Zelenka A, Perez R, Seals R, Renné D.Y. Effective accuracy of satellite-derived hourly irradiances. Theoretical and Applied Climatology 1999; 62: 199-207.
[15] Leroy M. Classification d’un site. Note technique n°35, aout 2009, www.ccrom.org/ccrom/IMG/pdf/note_technique35-2.pdf
[16] Posselt R, Mueller R.W, Stöckli R, Trentmann, J. Remote sensing of solar surface radiation for climate monitoring - the CM-SAF retrieval in international comparison. Remote Sensing of Environment 2012; 118: 186-198.
1390 Christophe Vernay et al. / Energy Procedia 57 ( 2014 ) 1383 – 1391
[17] Schillings C, Mayer B, Meyer R. Long-term variability of solar direct and global irradiance derived from ISCCP data and comparison with re-analysis data. Solar Energy 2006;80:1390-1401.
[18] Beyer H.G, Costanzo C, Heinemann D. Modications of the Heliosat procedure for irradiance estimates from satellite data. Solar Energy 1996; 56: 207–212.
[19] Lefèvre M., Wald L., Diabaté L. Using reduced data sets ISCCP-B2 from the Meteosat satellites to assess surface solar irradiance. Solar
Energy 2007; 81: 240-253.
[20] Rigollier R, Lefèvre M, Wald L. The method Heliosat-2 for deriving shortwave solar radiation from satellite images. Solar Energy 2004;
77: 159-169.
[21] Blanc P, Gschwind B, Lefèvre M, Wald L. The HelioClim project: surface solar irradiance data for climate application. Remote Sensing 2011; 3: 343-361.
[22] Trigo I.F, DaCamara C.C, Viterbo P, Roujean J.L , Olesen F, Barroso C, et al. A. The Satellite Application Facility on Land Surface Analysis. Int. J. Remote Sensing 2011, 32, 2725-2744.
[23] Remund J, Salvisberg E, Kunz S. Generation of hourly shortwave radiation data on tilted surfaces at any desired location. Solar Energy 1998; 62: 331-334.
[24] Huld T, Müller R, Gambardella A. A new solar radiation database for estimating PV performance in Europe and Africa. Solar Energy 2012;
86: 1803-1815.
[25] Perez R, Ineichen P, Moore K, Kmiecik M, Chain C, George R, et al. A New Operational Satellite-to-Irradiance Model. Solar Energy 2002;
73: 307-317.
[26] Ineichen P. Global irradiation: average and typical year, and year to year annual variability. University of Geneva 2011.
[27] Ineichen P. Five satellite products deriving beam and global irradiance validation on data from 23 ground stations. University of Geneva 2011.
[28] Ineichen P. Interannual variability and global irradiance evaluation. University of Geneva 2010.
[29] Vernay C, Blanc P, Pitaval S. Characterizing measurements campaigns for an innovative calibration approach of the global horizontal irradiation estimated by HelioClim-3. Renewable Energy 2013; 57: 339-347.
Appendix A. Detailed results
A.1. Representativeness
Name Spatial resolution Temporal resolution Starting date Ending date Updating scheme 3TIER 2 arcmin (3.7 km) 30 min jan-97 to jan-99 now every month CM SAF 15 km 15 min oct-04 & sep-05 now day+1 DLR-ISIS 280 km 3 hours jul-83 dec-04 - EnMetSol 1 & 2.5 km 15 & 30 min 2005 & 1995 now day+1 focus solar 1 km 30 min 1998 to 2007 now day+1 HelioClim-1 20 km day jan-85 dec-05 - HelioClim-3 3 km 15 min feb-04 now day+1 Land SAF 3 km 30 min 2005 now day+1 meteonorm 3 & 30 km month jan-86 dec-05 - NASA SSE 1° (111 km) 3 hours jul-83 jun-05 - OSI SAF 0.05° (5.6 km) 30 min oct-11 now day+1 PVGIS CM-SAF 1.5 arcmin (2.8 km) 30 min 1998 2011 potentially Satel-Light 3 km 30 min jan-96 dec-00 - SolarAnywhere 10 km 1 hour jan-98 now day+1 SolarGIS 3 km 15 & 30 min jan-94 to jan-07 now day+1 Solemi 2.5 km 30 min 1991 & 1999 dec-12 periodically
Notes:
x Within a same database, resolutions and dates may vary depending on the number and the types of satellites that are used;
A.2. Data type
Name GHI DHI GTI DNI < hour hour day month dataset time-series 3TIER yes yes - yes - yes - yes yes yes CM SAF yes - - - yes yes - yes DLR-ISIS yes - - yes - - yes - - yes EnMetSol yes yes yes yes yes yes yes yes yes yes focus solar yes yes - yes yes yes yes yes yes yes HelioClim-1 yes yes - yes - - yes yes - yes HelioClim-3 yes yes yes yes yes yes yes yes - yes Land SAF yes - - - yes - - - - yes meteonorm yes yes yes yes - yes yes yes yes yes NASA SSE yes yes - yes - - yes yes yes yes OSI SAF yes - - - - yes yes - - yes PVGIS CM-SAF yes yes yes yes - - - yes yes - Satel-Light yes yes yes - yes yes yes yes yes yes SolarAnywhere yes yes - yes - yes - - yes yes SolarGIS yes yes yes yes yes yes - yes yes yes Solemi yes yes - yes - yes - - - yes
A.3. Operating mode
Name Price Offline request GUI / web service 3TIER commercial time-series on request dataset only:
3tier.com/en/package_detail/solar-prospecting-tools/ CM SAF free - wui.cmsaf.eu
DLR-ISIS free for scientific usage all data on request - EnMetSol free for scientific usage all data on request - focus solar commercial all data on request -
HelioClim-1 free - soda-is.com/eng/services/services_radiation_free_eng.php HelioClim-3 commercial
(free for 2005)
machine-to-machine ability (wget)
soda-is.com/eng/services/list_services_eng.php
Land SAF free time-series on request -
meteonorm commercial time-series on request software for dataset NASA SSE free - eosweb.larc.nasa.gov/sse/
OSI SAF free FTP only ftp://eftp.ifremer.fr/cersat-rt/project/osi-saf/ PVGIS CM-SAF free - re.jrc.ec.europa.eu/pvgis/apps4/pvest.php# Satel-Light free - satel-light.com
SolarAnywhere commercial offline request for several areas solaranywhere.com/Public/SelectData.aspx SolarGIS commercial offline request for several areas PVPlanner web service: solargis.info/pvplanner/ Solemi free for scientific usage all data on request -