HAL Id: hal-01766661
https://hal.archives-ouvertes.fr/hal-01766661
Submitted on 13 Apr 2018HAL is a multi-disciplinary open access
archive for the deposit and dissemination of sci-entific research documents, whether they are pub-lished or not. The documents may come from teaching and research institutions in France or abroad, or from public or private research centers.
L’archive ouverte pluridisciplinaire HAL, est destinée au dépôt et à la diffusion de documents scientifiques de niveau recherche, publiés ou non, émanant des établissements d’enseignement et de recherche français ou étrangers, des laboratoires publics ou privés.
Optimized design and performance of a shared pump
single clad 2 µm TDFA
Robert Tench, Clément Romano, Jean-Marc Delavaux
To cite this version:
Robert Tench, Clément Romano, Jean-Marc Delavaux. Optimized design and performance of a shared pump single clad 2 µm TDFA. Optical Fiber Technology, Elsevier, 2018, 42, pp.18 - 23. �10.1016/j.yofte.2018.02.012�. �hal-01766661�
Optimized Design and Performance of a Shared Pump Single Clad 2 µm TDFA
Robert E. Tench [a], Clément Romano [a,b], and Jean-Marc Delavaux [a] [a] Cybel LLC, 1195 Pennsylvania Avenue, Bethlehem, PA 18018 USA [b] Institut Telecom/Telecom ParisTech, 46 Rue Barrault, 75634, Paris France
Abstract
We report the design, experimental performance, and simulation of a single stage, co- and counter-pumped Tm-doped fiber amplifier (TDFA) in the 2 μm signal wavelength band with an optimized 1567 nm shared pump source. We investigate the dependence of output power, gain, and efficiency on pump coupling ratio and signal wavelength. Small signal gains of >50 dB, an output power of 2 W, and small signal noise figures of <3.5 dB are demonstrated. Simulations of TDFA performance agree well with the experimental data. We also discuss performance tradeoffs with respect to amplifier topology for this simple and efficient TDFA.
Keywords: Fiber Amplifier, Thulium, 2000 nm, Silica Fiber, Single Clad 1. Introduction
Simplicity and optimization of design are critical for the practical realization of wide bandwidth, high power single clad Thulium-doped fiber amplifiers (TDFAs) for 2 µm telecommunications applications. Recent TDFAs [1,2] have reported 2 µm band amplifiers with output power > 2W, gain > 55 dB, noise figure < 4 dB, and optical bandwidth greater than 120 nm. While these designs achieve high optical performance, they employ two or more optical stages and multiple pump sources. Therefore, it is desirable to investigate designs using one amplifier stage and one pump source. In this paper we report on the design, simulation, and experimental performance of a one-stage single clad TDFA using an L-band (1567 nm) shared fiber laser pump source, as a function of pump coupling ratio, active fiber length, pump power, and signal wavelength. Our one-stage TDFA data compare well with recently reported performance of multi-stage, multi-pump amplifiers [2]. In addition, the simplicity of the single clad pump shared design and its potential for cost reduction offer a broad selection of performance for different applications.
The paper is organized as follows: Section 2 presents our experimental setup, a single stage TDFA with variable coupling in the pump ratio between co-pumping and counter-pumping the active fiber. Section 3 covers the dependence of simulated amplifier performance on active fiber length, pump coupling ratio, slope efficiency, and signal wavelength. Section 4 compares measurement and simulation of the TDFA performance. Section 5 contrasts our simple TDFA design with performance of a two-stage, three-pump amplifier as reported previously in [2]. Finally, Section 6 discusses design parameter tradeoffs for different TDFA applications.
2. Experimental Setup for Shared Pump Amplifier
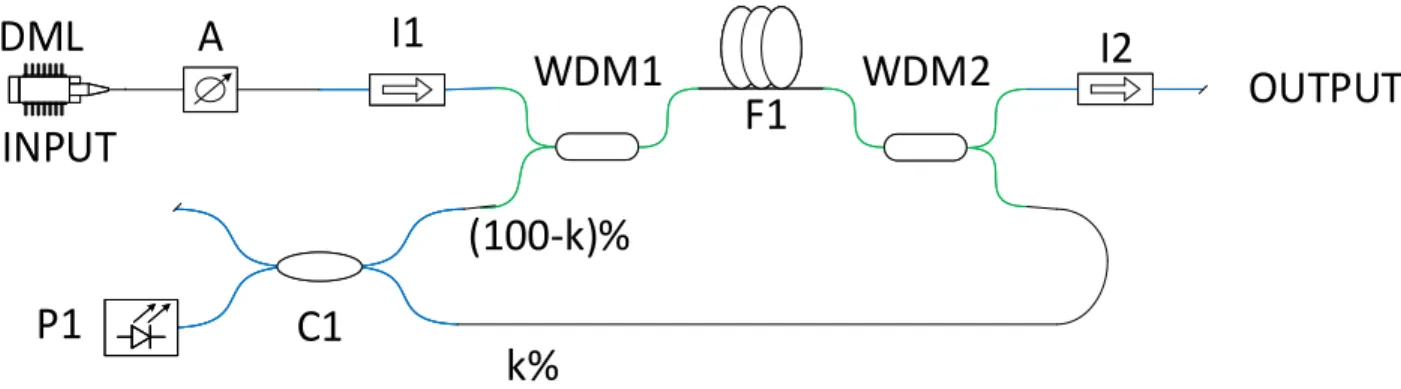
The optical design of our one-stage single pump TDFA is shown in Figure 1. A single frequency 2 µm DML source (Eblana Photonics) is coupled through attenuator A and into the active fiber F1. Pump light from a multi-watt fiber laser P1 at 1567 nm is split by coupler C1 with a variable coupling ratio k (%).The two pump signals
DML
A
I1
WDM1
P1
F1
WDM2
I2
OUTPUT
C1
(100-k)%
INPUT
k%
Figure 1. Optical Design of Single Stage Single Pump TDFA with a Shared Pump Arrangement. WDM = Wavelength Division Multiplexer.
co-pump and counter-pump fiber F1, with k = 100% and k = 0% corresponding to all counter-pumping and all co-pumping, respectively. The value of k was changed in the simulations and experiments to optimize amplifier performance. Isolators I1 and I2 ensure unidirectional operation and suppress spurious lasing. Input and output signal powers, and co-pump and counter-pump powers, are respectively referenced to the input and output of Tm-doped fiber F1 (7 meters of OFS TmDF200). The input and output spectra of the TDFA were measured with an optical spectrum analyzer (Yokogawa AQ6375B).
3. Simulated Amplifier Performance
We begin the design of a high performance optical amplifier by studying the critically important variations of fiber signal gain (G) and output power (Pout) as a function of active fiber length (L) and input signal power (Ps).
The signal gain G is given by the following simple equation:
G(λs) = Pout (λs) / Ps (λs) (1)
where λs is the signal wavelength, and Ps and Pout are signal powers measured at the input and output of the
active Tm-doped fiber, respectively.
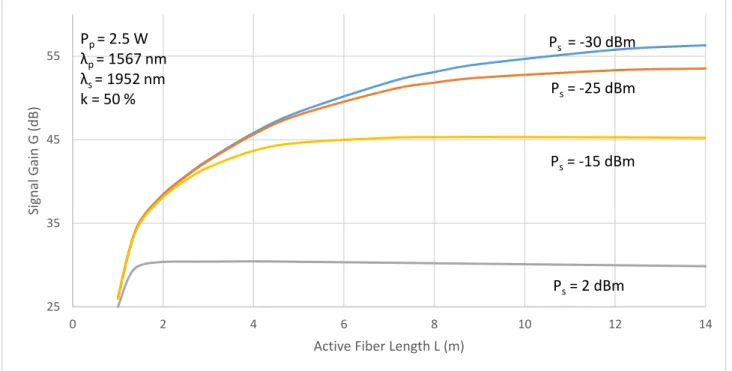
To study amplifier design we turn to the simulated TDFA performance [3,4] shown in Figure 2, where G is plotted vs. L for four input signal power levels. Here the total 1567 nm pump power (co- + counter-) (Pp) is 2.5
W, the signal wavelength λs is 1952 nm, and the coupling ratio k = 50%. We note that a similar set of gain
curves can be generated for different wavelength bands of the TDFA, and this behavior will be investigated later in the section.
In Figure 2 we have measured the dependence of G vs. L for a 32 dB input dynamic range in signal power. The different Ps values illustrate the amplifier operating from a linear/unsaturated regime (Ps= - 30 dBm) to a highly
saturated regime (Ps = + 2 dBm). The equally important dependence of noise figure on these parameters will
be dealt with later.
The first observation drawn from Figure 2 is that for low input signals (e.g. for Ps = -30 dBm) G is maximized
for long fiber lengths of 12 meters or greater, while for saturating input powers (e.g. Ps = +2 dBm) G reaches a
maximum value for lengths of about 2 meters. It is also clear that for small signal or unsaturated gain, most of the gain (i.e. more than 80%) is achieved in the first 5 meters of the fiber, while for saturated gain most of the
gain occurs within the first 1.5 meters. The second observation is that saturated gain varies only slightly with active fiber length for values greater than 3 meters, indicating that a wide range of fiber lengths can be chosen for design of a power booster amplifier. However, later we will see that the choice of the fiber length affects the useful amplifier bandwidth.
Figure 2. Signal Gain (G) as a Function of Fiber Length (L) for Four Different Levels of Ps.
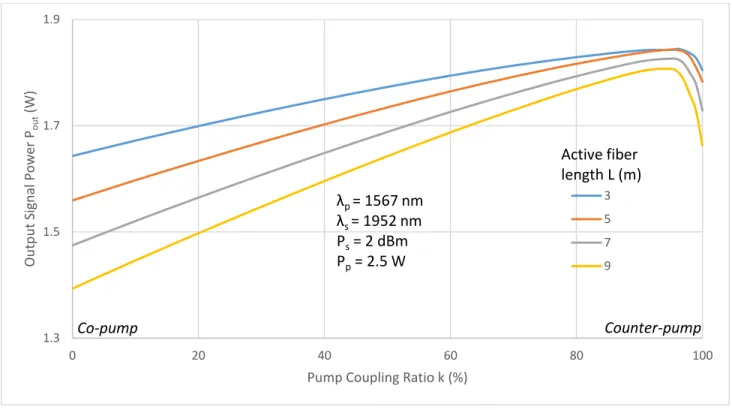
The next design study for the shared pump amplifier is to examine the dependence of the saturated output power on active fiber length L and coupling ratio k. To study this issue, we plot the output signal power with pump coupling ratio k for four active fiber lengths (i.e. L = 3, 5, 7 and 9 m) as shown in Figure 3. In this simulation Ps is set to +2 dBm at 1952 nm to saturate the amplifier, with the total pump set at Pp = 2.5 W at 1567 nm.
We first note that for a given fiber length, Pout increases linearly when moving from co-pumping (k = 0%) to
nearly all counter-pumping (k = 95%) and then drops down for full counter-pumping (k = 100%). For all fiber lengths, the maximum output power is achieved for k = 95%. This behavior is not surprising because counter-pumping maximizes the pump power available at the output of the fiber where the amplified signal power is the largest. We next observe that the maximum output power is achieved for a ratio of 95% counter-pumping to 5% co-pumping. For full counter-pumping, the pump is attenuated significantly within two meters after being launched, leaving the input end of the active fiber unpumped with no inversion achieved for the input Tm ion population. This indicates that a small amount of co-pumping provides signal gain that offsets fiber absorption loss. Therefore full counter-pumping is not the most efficient way to pump this amplifier.
For k = 50% in Figure 3, the relatively small variation in output signal power Pout with fiber length is consistent
with the small variation in gain seen in Figure 2 as a function of fiber length for Ps = +2 dBm. We further note
that as the fiber length is decreased from 9 m to 3 m, the output power Pout consistently increases. For very short
fibers the difference between co-and counter-pumping will become negligible. However, as we will illustrate later, this comes at the expense of the amplifier operating bandwidth shifting from higher to shorter wavelengths. 25 35 45 55 0 2 4 6 8 10 12 14 Sig n al G ain G (d B)
Active Fiber Length L (m)
Pp = 2.5 W λp = 1567 nm λs = 1952 nm k = 50 % Ps= 2 dBm Ps= -15 dBm Ps= -25 dBm Ps = -30 dBm
Figure 3. Simulated Output Signal Power (Pout) as a Function of Fiber Length (L) and Pump Coupling Ratio (k)
The amplifier performance illustrated in Figure 3 shows that we may consider three cases for design: k = 0%, k= 50%, and k = 95%. For k = 0%, Pout variation with fiber length is 18%. For k = 50%, it is as much as 10.9%,
and for k = 95% it is about 2%. This indicates that a mostly counter-pumped amplifier will be less sensitive to changes in active fiber length than a co-pumped amplifier.
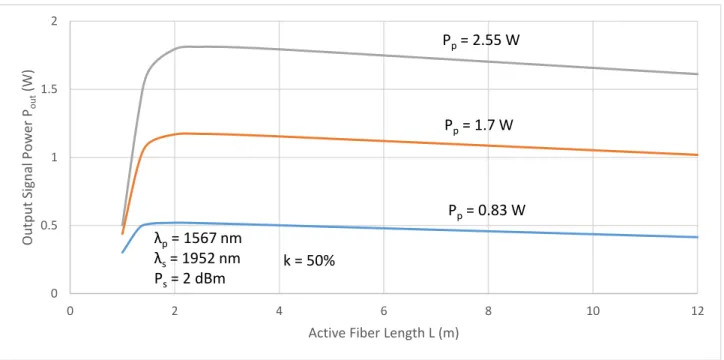
Now let’s consider the important design consideration of the dependence of saturated output power as a function of active fiber length L and pump power Pp. This behavior is illustrated in Figure 4 for a signal wavelength of
1952 nm, a coupling ratio k = 50%, and 1567 nm pump powers of 0.83 W, 1.7 W and 2.55 W, respectively. In this plot we see that the maximum saturated output power is obtained for L = 2 m, relatively independent of fiber length and the pump power. It is apparent that above L = 2 m, Pout decreases slightly with increases in
fiber length. This behavior is consistent with the simulation in Figure 2, and it illustrates that the optimum Pout
for a saturated amplifier is not greatly dependent on L.
1.3 1.5 1.7 1.9 0 20 40 60 80 100 Ou tp u t Sig n al Po w er Pou t (W)
Pump Coupling Ratio k (%)
3 5 7 9 λp = 1567 nm λs = 1952 nm Ps= 2 dBm Pp= 2.5 W Active fiber length L (m) Co-pump Counter-pump
Figure 4. Simulated Output Power Pout as a Function of Fiber Length L and Pump Power Pp for k = 50%
The curves in Figure 4 lead to the important observation that the output power scales linearly with increases in the pump power. Therefore saturated output powers much higher than the 2.6 W already demonstrated [2] can be achieved with this type of Thulium-doped fiber up to the stimulated Brillouin scattering (SBS) threshold which is estimated to be 10-20 W for a fiber length of 7 m [9].
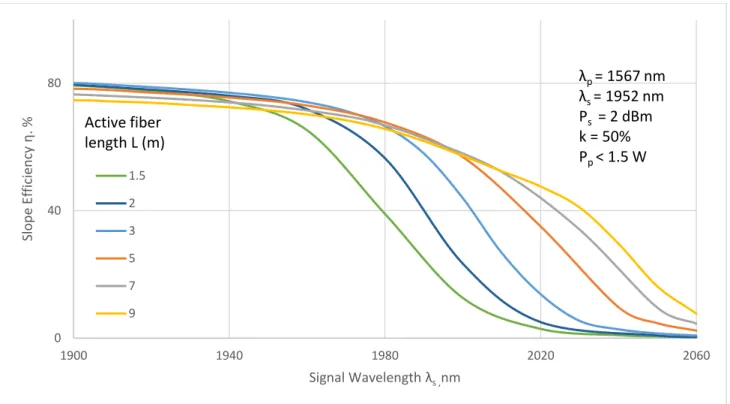
So far our simulations have been carried out for the signal wavelength of 1952 nm. To more fully study performance of the amplifier, we now look at the amplifier slope efficiency η vs. signal wavelength λs and
active fiber length L. Slope efficiency η = ΔPsat/ΔPp is defined as: the ratio of the change in saturated output
signal power Psat to a change in pump power, for a given fiber length L and signal wavelength λs. It measures
the efficiency of conversion of pump light into signal light and is an important figure of merit for the amplifier. The saturated output power Psat in our experiments and simulations is measured for a high input signal power
Ps = +2 dBm.
Figure 5 shows simulations of η over the wavelength region of 1900 nm to 2050 nm, for fiber lengths ranging from 1.5 to 9 meters. Clearly the bandwidth of the amplifier shifts toward longer signal wavelengths for the longer fiber such as 9 meters. Shorter fibers such as 1.5 and 2 meters shift the operating bandwidth region toward shorter wavelengths.
Figure 5 indicates that for short fibers of 1.5 and 2 meters, η is optimum below 1950 nm, then diminishes rapidly with wavelength around 2000 nm and is negligible above 2020 nm. For longer fibers of 5 to 9 meters, η decreases more gradually with increasing wavelength and allows for a modest efficiency (i.e. 35%) up to 2050 nm. The simulated slope efficiencies in Figure 5 give a value at 1952 nm of 73% which is fully consistent with the value of 73% determined from Figure 4.
0 0.5 1 1.5 2 0 2 4 6 8 10 12 Ou tp u t Sig n al Po w er Pou t (W)
Active Fiber Length L (m)
λp= 1567 nm λs= 1952 nm Ps= 2 dBm k = 50% Pp= 0.83 W Pp= 1.7 W Pp= 2.55 W
Figure 5. Simulated Slope Efficiencies η vs. Signal Wavelength λs and Active Fiber Length L
Based on the simulation results, for this single stage configuration we can draw four conclusions. First, the most significant gain occurs in the first couple of meters of the active fiber. Second, the saturated output power scales with pump power and is not significantly affected by the fiber length. Third, the optimum coupling ratio k for a combination of large dynamic range and saturated output power is achieved for medium fiber lengths of 6-8 meters and a k value around 50%. Fourth, the choice of the fiber length affects the operating bandwidth of the TDFA and the slope efficiency η: shorter lengths yield shorter operating wavelengths, while longer lengths give longer wavelength operating regions. This last point will be discussed further in Section 4.
4. Comparison of Simulation and Experiment
We now turn to comparisons of simulation and experiment for the single stage amplifier of Figure 1. In all these comparisons, the experimental fiber length is 7 meters.
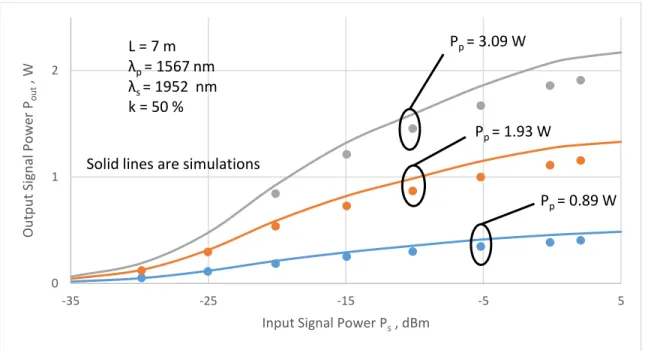
We start by looking at the signal output power Pout as a function of 1952 nm signal input power Ps over a range
of -30 dBm to + 2 dBm. Pump powers Pp at 1567 nm range from 0.89 W to 3.09 W and the coupling ratio k is
50%. As illustrated in Figure 6, the simulations (in solid lines) agree well with the experimental data (points) with an average difference between simulation and experiment of 0.6 dB.
For 0 dBm input power, the measured output powers are 1.11 W and 1.86 W for pump powers of 1.93 W and 3.09 W, respectively. This corresponds to optical power conversion efficiencies of 58% and 60%, respectively. 0 40 80 1900 1940 1980 2020 2060 Slop e E ff ici en cy η . % Signal Wavelength λs ,nm 1.5 2 3 5 7 9 Active fiber length L (m) λp = 1567 nm λs = 1952 nm Ps = 2 dBm k = 50% Pp < 1.5 W
Figure 6. Output Signal Power Pout vs. Input Signal power Ps for k=50%,
for Three Different Total Pump Powers Pp.
Figure 7. Gain G and Noise Figure NF at 1952 nm as a Function of Input Signal Power Ps.
The next comparison of simulation and experiment is for small signal gain G and noise figure NF at 1952 nm as a function of signal input power Ps . For this comparison, we first need to define the noise figure NF. This is
given by Equations (2) through (4) below (optical method of measuring noise figure) [10]:
0 1 2 -35 -25 -15 -5 5 Ou tp u t Sig n al Po w er Pou t , W
Input Signal Power Ps, dBm
Pp = 1.93 W L = 7 m λp = 1567 nm λs = 1952 nm k = 50 % Pp = 0.89 W Pp = 3.09 W
Solid lines are simulations
0 2 4 6 8 10 12 0 20 40 60 -35 -25 -15 -5 5 N o is e figur e N F, d B Sig n al G ain G , d B
Input Signal Power Ps, dBm
L=7 m k=50 % λs=1952 nm
Pp=2.55 W
λp=1567 nm
Solid lines are simulations Noise Figure
Neq (λ) = P ASE (forward, λs) / (2 h c2 Δλ / λs3 ) G(λs) (2)
F (λs) = (1/ G(λs)) + 2 Neq(λs) (3)
NF (dB) = 10 log10 (F (λs) ) (4)
In Equations (2) through (4), Δλ is the effective resolution bandwidth of the optical spectrum analyzer in m, and PASE is the measured internal forward spontaneous output power under the signal peak in Watts. h is
Planck’s constant, and c is the speed of light in vacuum. G(λ) is given by Equation (1). We measured the noise figure with a Δλ of 0.1 nm on the Yokogawa optical spectrum analyzer.
Using Equations (1) through (4), we now analyze the performance of the TDFA as shown in Figure 7. A maximum signal gain G (points) of 51 dB is measured at Ps = -30 dBm with an NF < 3.5 dB. Over the full range
of input powers studied, the simulated gain values (solid lines) agree with the measured gain values to within 1 dB, validating the performance of our simulator over a wide range of input powers. Experimental values of noise figure are also plotted in points in Figure 7. The minimum measured noise figure is 3.5 dB, and the minimum simulated noise figure is 3.2 dB, close to the 3.0 dB quantum limit. Agreement between experiment and simulation for noise figure is good. The measured dynamic range for the amplifier is 32 dB for a noise figure of 4.7 dB or less.
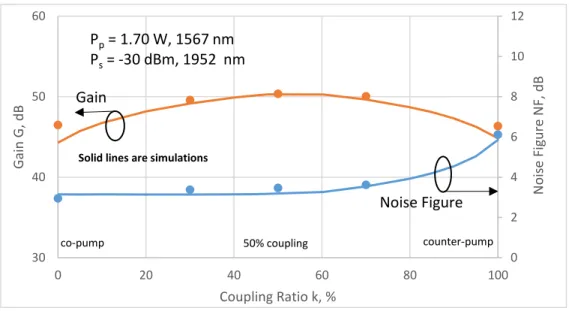
Figure 8 shows the dependence of G and NF on coupling ratio k for Ps = -30 dBm at 1952 nm and Pp= 1.70 W
at 1567 nm. Experimental data are shown in points and the simulations in solid lines. The optimum operating setpoint for small signal gain is different from the optimum for noise figure, with the largest small signal gain occurring for k = 50% and the lowest noise figures for k = 0%. The noise figure increases slowly at first with k, and then rapidly to 6.1 dB as k reaches 100% which corresponds to counter-pump only. The agreement between simulation and experiment is good, validating the performance of our simulator over the full range of k values. From this graph, we observe that a good balance between optimum gain and optimum noise figure is achieved for a coupling ratio of k = 50%.
Figure 8. Gain and Noise Figure as a Function of Coupling Ratio k.
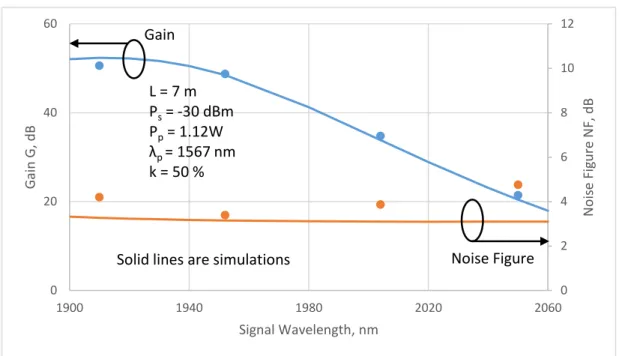
In Figure 9 we plot the dependence of G and NF on signal wavelength λs over the range of 1900 – 2050 nm for
a coupling ratio of k = 50%, Pp = 1.12 W, and input signal power Ps = -30 dBm. The highest measured 0 2 4 6 8 10 12 30 40 50 60 0 20 40 60 80 100 N o is e Fig u re N F, d B G ain G, d B Coupling Ratio k, % Pp= 1.70 W, 1567 nm Ps= -30 dBm, 1952 nm co-pump counter-pump Gain Noise Figure 50% coupling Solid lines are simulations
unsaturated gain is achieved at 1910 nm , with a small decrease with λ at 1952 nm and then a steady decrease up to 2050 nm. For G > 30 dB, the amplifier bandwidth is >120 nm. By extending the investigation to values of λ lower than 1900 nm, we can expect even larger bandwidths.
The smallest measured NF of 3.5 dB is at 1952 nm, and NF variation with wavelength is small (i.e.< 1.4 dB). We observe that the agreement between simulation and experiment is good, and this shows our simulation predicts well the small signal gain G and noise figure NF as a function of λs.
Figure 9 . Small Signal Gain G and Noise Figure NF as a Function of λs
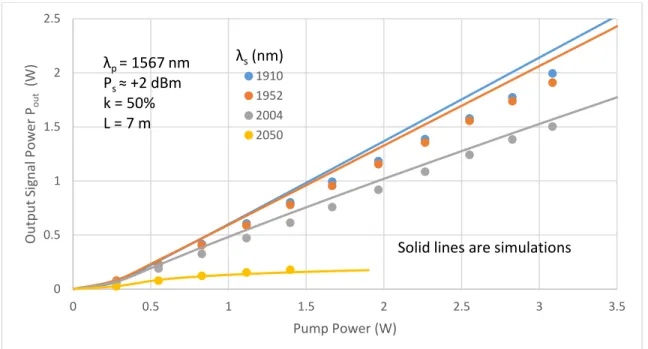
We now investigate the slope efficiency η as a function of total pump power Pp for a saturating input power of
Ps ≈ + 2 dBm, Figure 10 shows experimental and simulated values for saturated output power as a function of
pump power, for four different values of λs across the transmission band with k = 50%. The agreement between
simulation (solid lines) and experiment (points) is good, illustrating the accuracy of our simulator over a wide region of λs and over pump powers from 0.3 to 3.2 W. Notice that at λ = 2050 nm the number of data points is
limited by the onset of lasing due to the large ASE produced as the pump power increases. The experimental variation in signal output power with pump power is linear in all cases as expected from theory. The maximum measured output power is 2.00 W for λ = 1910 nm and pump power of 3.09 W, corresponding to an optical power conversion efficiency of 65%.
0 2 4 6 8 10 12 0 20 40 60 1900 1940 1980 2020 2060 N o is e Fig u re N F, d B G ain G, d B Signal Wavelength, nm L = 7 m Ps= -30 dBm Pp= 1.12W λp = 1567 nm k = 50 %
Solid lines are simulations Noise Figure Gain
Figure 10. Saturated Output power Pout vs. Total Pump Power Pp as a Function of λs
Figure 11. Simulated and Measured Slope Efficiency vs. λs as a Function of Fiber Length. 0 0.5 1 1.5 2 2.5 0 0.5 1 1.5 2 2.5 3 3.5 Ou tp u t Sig n al Po w er Pou t (W) Pump Power (W) 1910 1952 2004 2050 λp = 1567 nm Ps ≈ +2 dBm k = 50% L = 7 m λs(nm)
Solid lines are simulations
0 25 50 75 100 1760 1810 1860 1910 1960 2010 2060 Slop e E ff ici en cy η , % Signal Wavelength λs (nm) 3 5 7 9 Active fiber length L (m) λp = 1567 nm λs = 1952 nm Ps = 2 dBm k = 50% Pp < 1.5 W
Points are experimental data for L = 7m
50% slope efficiency criterion
Two stage, three pump TDFA [Ref. 2]
In Figure 11 we compare the slope efficiencies measured in Figure 10 with the simulation of Figure 5, with an expanded span for λ of 1760 nm – 2060 nm. The experimental slope efficiencies (points) agree reasonably well with the theory and this demonstrates that our simulation is valid over a wide range of values for λs for a
saturated amplifier. The maximum measured slope efficiency is 68.2% at 1910 nm. This can be compared with the simulated value at this signal wavelength of 76.0%. Table 1 contrasts the measured and simulated values of slope efficiency η as a function of signal wavelength λs for a fiber length of 7 m.
η, % λ, nm Exp. Sim. 1910 68.2 76.0 1952 65.9 72.9 2004 52.1 55.0 2050 13.5 9.6
Table 1 . Comparison of Simulated and Measured Slope Efficiency η as a Function of λs .
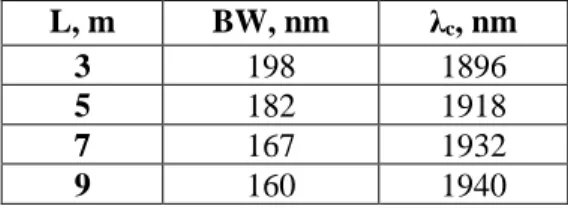
Using a slope efficiency of greater than 50% as a criterion, Figure 11 shows that the simulated operating bandwidth BW and center operating wavelength λc of the amplifier vary significantly with fiber length. For a
short fiber (3 m) the operating bandwidth BW at 50% slope efficiency is 198 nm as indicated by the horizontal arrows in the figure, and λc is 1896 nm. For the longest fiber simulated (9 m)
BW is reduced to 160 nm, and λc is shifted up in wavelength to 1940 nm. Results for all the fiber lengths
L, m BW, nm λc, nm
3 198 1896
5 182 1918
7 167 1932
9 160 1940
Table 2. Operating Bandwidth BW and Center Wavelength λc as a Function of Fiber Length L.
studied are summarized in Table 2. It is evident that shorter fiber lengths give greater operating bandwidths and lower center wavelengths. This behavior is consistent with previously reported results [6]. We note that Figure 11 and Table 2 are the first detailed comparisons of TDFA simulation and theory, since previous work on spectral performance has been either wholly experimental [5,6] or theoretical [7,8].
5. Comparison of Multistage Amplifier Performance
In Sections 3 and 4, we have shown that the shared pump topology can deliver high performance that is fully in agreement with simulation results. Here we will compare the shared pump amplifier with a two stage-three pump TDFA [2]. A summary comparison of the two amplifiers is given below in Table 3.
Fiber Length L = 7 m TDFA Configurations, 1952 nm
Parameter Symbol Units 1 Stage, Shared Pump
2 Stage, 3 Pumps
Pump Power (1567 nm) Pp W 3.2 3.6
Saturated Output Power Pout W 1.9 2.6
Small Signal Noise Figure NF dB 3.4 3.2
Signal Dynamic Range Pin dB 32 32
Small Signal Gain G dB 51 56
Slope Efficiency (Saturated) η % 65.9 82
Operating Bandwidth BW nm 167
(simulated)
> 120 (est. from ASE) Table 3. Comparison of Single Stage, Shared Pump TDFA with Two Stage, Three Pump TDFA
The table reveals that there is no major difference in performance between the two TDFAs. Comparing the maximum saturated output powers, we see that the shared pump TDFA achieves 1.9 W output for 3.2 W available pump, while the 2 stage amplifier achieves 2.6 W for 3.6 W of available pump. The output power performance of the two amplifiers is seen to be comparable when the maximum pump power available is accounted for. NF values for the two amplifiers are similar, as are the operating dynamic ranges (measured over an input power span of -30 dBm to +2 dBm). The two-stage amplifier has a slightly higher small signal gain with 56 dB compared to 51 dB for the shared pump single stage TDFA.
The difference in slope efficiencies, with 66% for the 1 stage shared pump configuration and 82% for the 2 stage, 3 pump configuration, can be explained by referring to the architecture of the 3 pump configuration [2]. Here we recall the definition of slope efficiency η from Section 3: η = ΔPsat/ΔPp. Remembering that Psat is the
output power for a highly saturated amplifier, we observe that in the 2 stage TDFA the first stage boosts the input signal power of +2 dBm to an intermediate level of about +20 dBm which is then input to the second fiber stage. This boost in power to +20 dBm increases the conversion efficiency for available pump power in the second stage and so increases η. Indeed the two stage amplifier brings the measured efficiency closer to the simulated value as shown in Figure 11.
In comparing the amplifier bandwidth for the two configurations, we see that the 167 nm simulated bandwidth for the one stage, shared pump amplifier is consistent with the estimated value of >120 nm for the two stage, three pump amplifier. The >120 nm value was obtained by measuring the 10 dB width of the ASE noise background in the saturated output spectrum of the two stage TDFA. We believe that a simulation of the slope efficiency for the two stage amplifier (currently in progress) will result in a more precise value for its bandwidth. The comparisons in Table 3 illustrate that our single stage shared pump TDFA can match the performance targets of a complex two stage three pump amplifier. The simplicity of the architecture of the shared pump TDFA is a considerable advantage in the design simulation of TDFAs for broadband telecommunications systems.
6. Discussion of Parameter Optimization for TDFA Architecture
The data reported in Figures 2 – 11 illustrate several salient points about the operation of the shared pump TDFA.
From our experimental and theoretical studies, it is evident that input power levels, saturated output power targets, noise figure specifications, small signal gain specifications, and operating signal bandwidths all depend in an interrelated way on the amplifier architecture. Design of an optimized amplifier requires a careful balancing of all these performance targets as a function of fiber length L and coupling ratio k.
For gain amplifiers, Figure 2 shows that it is very important to consider the input signal power when choosing an optimum fiber length. For example, at the coupling ratio of 50%, the fiber gain for – 30 dBm input is highest for a fiber length of 14 meters. For – 15 dBm input, the optimum gain occurs for lengths of 7-8 meters. Clearly the design specifications of the TDFA must be carefully considered when choosing an optimum fiber length for a preamplifier designed to operate at low signal input powers. For these low input powers the NF value remains close to the quantum limit of 3 dB.
For power amplifiers, maximum simulated output power occurs for a coupling ratio of k = 95% and an optimized fiber length of about 3.5 meters for a signal wavelength of 1952 nm. This optimized fiber length agrees well with the values obtained in Figures 2 and 4 where the optimum length for maximum output power is between 3 and 4 meters for a pump coupling ratio of 50 %. We conclude that for maximizing output power at 1952 nm, coupling ratios anywhere between 50 and 95 % can be employed.
Figure 4 demonstrates that the saturated output power Pout scales linearly with pump power up to the maximum
simulated Pp of 2.55W. No Brillouin scattering or other nonlinear effects were observed in our experiments.
This means that we can improve the output power of the amplifier simply by increasing the pump power, up to the limit where nonlinear effects start to be observed. The threshold for nonlinear effects in our shared pump amplifier is currently under study. For the parameters in the current experiments, the one stage shared pump design yields an attractive power amplifier that is simple to build and has high signal output power
For generic or multipurpose amplifiers, Figure 5 and 11 illustrate that the operating bandwidth BW and center wavelength λc of the amplifier are strongly dependent on the active fiber length, with maximum long
wavelength response above 2000 nm occurring for fiber lengths L of 9 meters and longer. Short wavelength response is maximized for short fiber lengths of 1.5 and 2 meters. The desired operating bandwidth and center wavelength can therefore be selected by choosing an appropriate active fiber length. The noise figure NF as shown in Figure 9 is slowly varying with signal wavelength λs for a coupling ratio of k = 50 %, indicating that
the noise performance of the multipurpose amplifier is highly tolerant of variations in signal wavelength λs.
This is an attractive feature for the many applications of this type of TDFA.
To conclude, we have shown that an active fiber length L of 7 meters and a coupling ratio k = 50 % provide balanced performance over a wide range of operating parameters for the one stage, shared pump TDFA.
7. Summary
We have reported the experimental and simulated performance of a single stage TDFA with a shared in-band pump at 1567 nm. In particular we considered the dependence of amplifier performance on pump coupling ratio and signal wavelength. We determined that the optimum fiber length L and optimum coupling ratio k depend strongly on the design performance specifications for the TDFA such as signal wavelength band, saturated output power, noise figure, small signal gain, and dynamic range. Our simulations show that the operating bandwidth of the amplifier can be as high as 198 nm. Due to the broad Thulium emission bandwidth, this amplifier configuration can be tailored to meet a variety of performance needs. We achieved saturated output
powers of 2 W, small signal gains as high as 51 dB, noise figures as low as 3.5 dB, and a dynamic range of 32 dB for a noise figure of less than 4.7 dB. In all cases we found good agreement between our simulation tool and the experiments. No Brillouin scattering or other nonlinear effects were observed in any of our measurements. Our experiments and simulations show that the shared pump TDFA can match the performance of more complex multistage, multi-pump TDFAs, and illustrate the simplicity and usefulness of our design. This opens the possibility for new and efficient TDFAs for lightwave transmission systems as preamplifiers, as in-line amplifiers, and as power booster amplifiers.
8. Acknowledgments
We gratefully acknowledge Eblana Photonics for the single frequency distributed mode 2 µm laser sources, and OFS for the single clad Tm-doped fiber.
9. References
[
1] C. Romano, R. E. Tench, Y. Jaouen, and G. Williams, “Simulation and design of a multistage 10 W thulium-doped double clad silica fiber amplifier at 2050 nm,” in Proc. SPIE 10083, Fiber Lasers XIV: Technology and Systems, 100830H (February 22, 2017).[2] R. E. Tench, C. Romano, and J.-M. Delavaux, “Broadband 2 W Output Power Tandem Thulium-doped Single Clad Fibre Amplifier for Optical Transmission at 2µm,” Paper M.2.B.2, ECOC 2017, Gothenburg, Sweden.
[3] C. Romano, R. E. Tench, Y. Jaouen, and J.-M. Delavaux, “Characterization of the 3F4 – 3H6
Transition in Thulium-doped Silica Fibres and Simulation of a 2µm Single Clad Amplifier,” Paper P1.SC1.2, ECOC 2017, Gothenburg, Sweden.
[4] S. D. Jackson and T. A. King, “Theoretical modeling of Tm-doped silica fiber lasers,” J. Lightwave Technology 17, no. 5, pp. 948–956, May 1999.
[5] Z. Li, A. M. Heidt, N. Simakov, Y. Jung, J. M. O. Daniel, S. U. Ulam, and D. J. Richardson, “Diode-pumped wideband thulium-doped fiber amplifiers for optical communications in the 1800-2050 nm window,” Optics Express 21, 26450-26455 (2013).
[6] Z. Li, Y. Jung, J.M.O. Daniel, N. Simakov, M. Tokurakawa, P. C. Shardlow, D. Jain, J. K. Sahu, A. M. Heidt, W. A. Clarkson, S. U. Ulam, and D. J. Richardson, “Exploiting the short wavelength gain of silica-based thulium-doped fiber amplifiers,” Optics Letters 41, 2197-2200 (2016).
[7] M. Gorjan, T. North, and M. Rochette, “Model of the amplified spontaneous emission generation in thulium-doped silica fibers,” J. Opt. Soc. Am. B, 2886-2890 (2012)
[8] M. A. Khamis and K. Ennser, “Theoretical Model of a Thulium-doped Fiber Amplifier Pumped at 1570 nm and 793 nm in the Presence of Cross Relaxation,” J. Lightwave Technology 34, 5675–5681 (2016). [9] A. Sincore, N. Bodnar, J. Bradford, A. Abdulfattah, L. Shah, and M. C. Richardson, “SBS Threshold Dependence on Pulse Duration in a 2053 nm Single-Mode Fiber Amplifier,” J. Lightwave Technology 35, 4000-4003 (2017).
[10] E. Desurvire, “Erbium-Doped Fiber Amplifiers: Principles and Applications”, New York, Wiley Interscience (1994), Eqs. 5.32 and 5.34.