Publisher’s version / Version de l'éditeur:
Proceedings 17th International Conference on Port and Ocean Engineering under Arctic Conditions, POAC'03, 1, pp. 141-150, 2003-06-16
READ THESE TERMS AND CONDITIONS CAREFULLY BEFORE USING THIS WEBSITE. https://nrc-publications.canada.ca/eng/copyright
Vous avez des questions? Nous pouvons vous aider. Pour communiquer directement avec un auteur, consultez la
première page de la revue dans laquelle son article a été publié afin de trouver ses coordonnées. Si vous n’arrivez pas à les repérer, communiquez avec nous à [email protected].
Questions? Contact the NRC Publications Archive team at
[email protected]. If you wish to email the authors directly, please see the first page of the publication for their contact information.
NRC Publications Archive
Archives des publications du CNRC
This publication could be one of several versions: author’s original, accepted manuscript or the publisher’s version. / La version de cette publication peut être l’une des suivantes : la version prépublication de l’auteur, la version acceptée du manuscrit ou la version de l’éditeur.
Access and use of this website and the material on it are subject to the Terms and Conditions set forth at Data Collection Program on Ice Regimes.
Timco, Garry; Johnston, Michelle; Sudom, Denise; Gauthier, M-F
https://publications-cnrc.canada.ca/fra/droits
L’accès à ce site Web et l’utilisation de son contenu sont assujettis aux conditions présentées dans le site LISEZ CES CONDITIONS ATTENTIVEMENT AVANT D’UTILISER CE SITE WEB.
NRC Publications Record / Notice d'Archives des publications de CNRC:
https://nrc-publications.canada.ca/eng/view/object/?id=5990d30f-224d-462d-9d69-8f5da4f85814 https://publications-cnrc.canada.ca/fra/voir/objet/?id=5990d30f-224d-462d-9d69-8f5da4f85814
POAC ‘03
Trondheim
Proceedings of the 17 International Conference onth
Port and Ocean Engineering under Arctic Conditions POAC’03 Vol. 1, pp 141-150 Trondheim, Norway, June 16-19, 2003
DATA COLLECTION PROGRAM ON ICE REGIMES
G.W. Timco1, M. Johnston1, D. Sudom1, M-F. Gauthier2 and R. Zacharuk2 1
Canadian Hydraulics Centre National Research Council Ottawa, Ont., K1A 0R6 Canada
2
Canadian Ice Service Ottawa, Ont., K1A 0H3 Canada ABSTRACT
A field program was designed and carried out on board six Canadian Coast Guard icebreakers during the summer of 2002. Information was collected on the ice conditions (ice regimes) and the surface characteristics (stage of melt) of the ice. In total, 201 ice regimes were documented and photographed. Based on this information, the severity of the ice regimes was evaluated in terms of the Canadian Arctic Ice Regime Shipping System (AIRSS). This paper provides a description of the data collection program and an overview of the results. The program was highly successful in all aspects.
INTRODUCTION
The Arctic Shipping Pollution Prevention Regulation (ASPPR) regulates navigation in Canadian waters north of 60°N latitude. These regulations include the date Table in Schedule VIII and the Shipping Safety Control Zones Order, made under the Arctic Waters Pollution Prevention Act (ASPPR, 1989). Both of these are combined to form the “Zone/Date System” matrix to give entry and exit dates for various ship types and classes. It is a rigid system with little room for exceptions since it is based on the premise that nature consistently follows a regular pattern year after year.
Transport Canada, in consultation with stakeholders, has made extensive revisions to ASPPR with the introduction of the Arctic Ice Regime Shipping System (AIRSS, 1996). The changes are designed to reduce the risk of structural damage in ships which could lead to the release of pollution into the environment, yet provide the necessary flexibility to ship owners by making use of actual ice conditions, as seen by the Master. In this system, an "Ice Regime", which is a region of generally consistent ice conditions, is defined at the time the vessel enters that specific geographic region. At present, there is only partial application of the Ice Regime System, exclusively outside of the Zone/Date System.
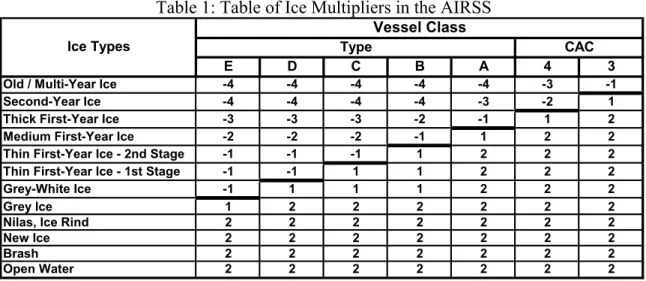
The Arctic Ice Regime Shipping System (AIRSS) is based on a simple arithmetic calculation that produces an “Ice Numeral” that combines the ice regime and the vessel’s ability to navigate safely in that region. The Ice Numeral (IN) is based on the quantity of hazardous ice with respect to the ASPPR classification of the vessel (see Table 1). The Ice Numeral is calculated from IN =[Ca xIMa] + [Cb xIMb] +.... where IN is the Ice Numeral, Ca is
the Concentration in tenths of ice type “a”, and IMa is the Ice Multiplier for ice type “a” (from
Table 1). The term on the right hand side of the equation (a, b, c, etc.) is repeated for as many ice types as may be present, including Open Water. The values of the Ice Multipliers are adjusted to take into account the decay or ridging of the ice by adding or subtracting a correction of 1 to the multiplier, respectively (see Table 1). The Ice Numeral is therefore unique to the particular ice regime and ship operating within its boundaries.
Table 1: Table of Ice Multipliers in the AIRSS
Vessel Class
Type CAC
E D C B A 4 3
Old / Multi-Year Ice -4 -4 -4 -4 -4 -3 -1
Second-Year Ice -4 -4 -4 -4 -3 -2 1
Thick First-Year Ice -3 -3 -3 -2 -1 1 2
Medium First-Year Ice -2 -2 -2 -1 1 2 2
Thin First-Year Ice - 2nd Stage -1 -1 -1 1 2 2 2
Thin First-Year Ice - 1st Stage -1 -1 1 1 2 2 2
Grey-White Ice -1 1 1 1 2 2 2
Grey Ice 1 2 2 2 2 2 2
Nilas, Ice Rind 2 2 2 2 2 2 2
New Ice 2 2 2 2 2 2 2
Brash 2 2 2 2 2 2 2
Open Water 2 2 2 2 2 2 2
Ice Types
Ice Decay : If MY, SY, TFY or MFY ice has Thaw Holes or is Rotten, add 1 to the IM for that ice type Ice Roughness : If the total ice concentration is 6/10s or greater and more than one-third
of an ice type is deformed, subtract 1 from the IM for the deformed ice type.
ASPPR deals with vessels that are designed to operate in severe ice conditions for both transit and icebreaking (CAC class) as well as vessels designed to operate in more moderate first-year ice conditions (Type vessels). The Ice Regime System determines whether a given vessel should proceed through a particular ice regime. If the Ice Numeral is negative, the ship is not allowed to proceed and must find an alternate route. However, if the Ice Numeral is zero or positive, the ship is allowed to proceed into the ice regime. Responsibility for planning the route, identifying the ice, and carrying out this numeric calculation rests with the Ice Navigator who could be the Master or Officer of the Watch. Due care and attention of the mariner, including avoidance of hazards, is vital to the successful implementation of the Ice Regime System. Authority by the Regulator (Pollution Prevention Officer) to direct ships in danger, or during an emergency, remains unchanged.
Credibility of the new system has wide implications, not only for ship safety and pollution prevention, but also for lowering ship insurance rates and predicting ship performance. Therefore, the Canadian Hydraulics Centre (CHC) of the National Research Council of Canada in Ottawa has worked with Transport Canada to assist them to develop a methodology for establishing a scientific basis for AIRSS (see e.g. Timco and Kubat, 2002).
As part of this work, the CHC, in collaboration with the Canadian Ice Service (CIS), developed a data collection program onboard the Canadian Coast Guard icebreakers that was carried out in 2002. The program was designed to collect information on the ice regimes over a wide area of the Arctic. To do this, Field Books were developed and given to the Ice Service Specialists (ISS) of the CIS. The ISS personnel were onboard six Canadian Coast Guard Icebreakers throughout the summer navigation season in the Canadian Arctic. They used these Field Books and digital cameras to collect information on the ice regimes and the stage of ice decay. Information on the ice regimes was used in conjunction with input from the Commanding Officers of the icebreakers to assess the likelihood of damage to the vessel in different ice conditions. In addition, the results from this program were used to validate a new prototype product developed by the CIS to provide information on the strength of first-year level ice in the Arctic (Gauthier et al., 2002; Langlois et al., 2003). This paper discusses the procedure and results of this data collection program.
FIELD BOOKS
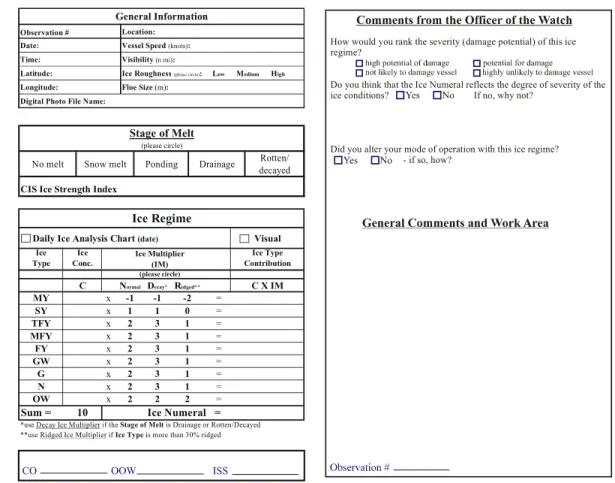
Field books were developed to allow key information to be collected systematically. Figure 1 shows a page from the Field Book for the CCGS TERRY FOX. The books were subdivided as follows:
General Information – This section documented general information including: Observation Number, Date, Time, Latitude, Longitude, Geographic Location, Vessel Speed, Visibility, Ice Roughness, and Floe Size.
Digital Photographs – The ISS were supplied with digital cameras and asked to photograph the observed ice regimes.
Stage of Melt – The surface conditions were noted according to the following format: No Snow Melt, Snow Melt, Ponding, Drainage, or Rotten/Decayed.
Ice Regime – Information on the ice regime was collected by noting the concentration of each Ice Type based on the World Meteorological Organization (WMO) definitions. The ISS was asked to define the ice regime as “the ice that the vessel will likely encounter”.
Ice Numeral – The Ice Numeral was calculated based upon the observed ice conditions and the Ice Multipliers supplied for each particular vessel.
Comments from the Officer of the Watch – A number of questions were asked to the Officer of the Watch to correlate the ice conditions with an assessment of the potential for damage to the ship by the ice. The questions are as follows:
1. How would you rank the severity (damage potential) of this ice regime? - high potential of damage - potential for damage
- not likely to damage vessel - highly unlikely to damage vessel
2. Do you think that the Ice Numeral reflects the degree of severity of the ice conditions?
Yes No If no, why not?
3. Did you alter your mode of operation with this ice regime? Yes No If so, how?
General Comments – Space was left for any comments from either the ISS personnel or Officer of the Watch.
How would you rank the severity (damage potential) of this ice regime?
Do you think that the Ice Numeral reflects the degree of severity of the ice conditions? If no, why not?
Did you alter your mode of operation with this ice regime? - if so, how?
CO OOW ISS
Observation # Location: Date: Vessel Speed(knots): Time: Visibility(n.mi):
Latitude: Ice Roughness(please circle): Low Medium High Longitude: Floe Size (m):
Digital Photo File Name:
General Information
No melt Snow melt Ponding Drainage Rotten/
decayed
CIS Ice Strength Index
Stage of Melt (please circle)
Daily Ice Analysis Chart(date) Visual
Ice Type Ice Conc. Ice Type Contribution C Normal Decay* Ridged** C X IM
MY x -1 -1 -2 = SY x 1 1 0 = TFY x 2 3 1 = MFY x 2 3 1 = FY x 2 3 1 = GW x 2 3 1 = G x 2 3 1 = N x 2 3 1 = OW x 2 2 2 =
Sum = 10 Ice Numeral =
*use Decay Ice Multiplier if the Stage of Melt is Drainage or Rotten/Decayed **use Ridged Ice Multiplier if Ice Type is more than 30% ridged
Ice Regime
Ice Multiplier (IM)
(please circle)
Figure 1: Page from the Field Book for the CCGS TERRY FOX.
These Field Books were used on six Canadian Coast Guard icebreakers. General information pertaining to the vessels involved in this study is given in Table 2. It should be noted that CCG vessels are not assigned a Vessel Class. Therefore, it was necessary to assign to them a Vessel Class in order to calculate the Ice Numeral. The Vessel Classes that were used were suggested by Andrew Kendrick of BMT Fleet Technology Ltd. based upon preliminary analysis of the vessels. It is important to understand that the Vessel Class used here is not necessarily the Vessel Class that would be assigned by Transport Canada for these types of vessels, as this would require a more thorough analysis.
Table 2: Information on the CCG Vessels
Start End
LOUIS S. ST-LAURENT 9-Aug-02 25-Oct-02 S. Klebert M. Marsden
R. Provost J.Y. Rancourt
D. Crosbie
54 31 CAC3
TERRY FOX 6-Jul-02 25-Sep-02
M. Champagne G. Barry L. Meisner G. Campbell E. Vaillant N. Kulbaski 27 48 CAC3
HENRY LARSEN 14-Jul-02 9-Sep-02 J. Vanthiel J. Broderick
S. Payment K. Carlson S. Payment
7 7 CA PIERRE RADISSON 29-Jun-02 17-Oct-02 M. Bourdeau
S. Brûlé
R. Boisvert
F. Guay 43 55 CAC4 DES GROSEILLIERS 12-Jul-02 19-Sep-02 G. Tremblay
R. Dubois
B. Simard S. Leger E. Vaillant
57 104 CAC4
SIR WILFRID LAURIER 19-Jul-02 25-Aug-02 M. Taylor N. Thomas S. Thompson C. Stock C. Daigle 13 26 Type A Number of Photographs Assigned Vessel Class Data Collection
Vessel Name Commanding
Officers Ice Service Specialists Number of Observations C3
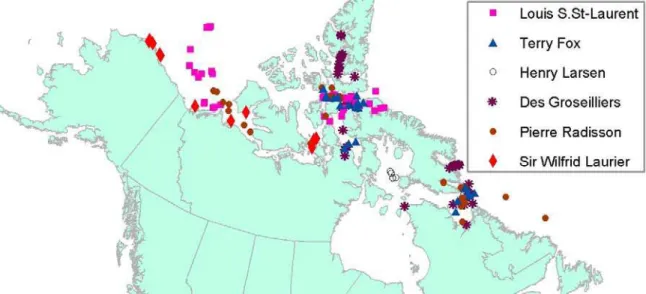
The vessels sailed in different parts of the Canadian Arctic. Figure 2 shows the details about where the observations were made along the routes of the six vessels during the data collection program.
Figure 2: Location of data collection for the six Canadian Coast Guard icebreakers. ISSUES
A number of issues had to be resolved to ensure a successful program. These are briefly discussed below:
1. There were four government departments (Transport Canada, National Research Council, Environment Canada, Fisheries and Oceans) working on this program. It was important that all departments be committed to this work and understand its importance. Further, it was important to ensure that all departments and individuals were kept informed of the status of the work. This was done in a step-wise approach in the development of the program. Discussions were held with the individual departments to explain the program and to seek their acceptance and participation in it.
Once all departments agreed to participate, co-ordination and communication was done primarily by e-mail.
2. The Canadian Coast Guard and the CIS Ice Service Specialists were not entirely familiar with the details of the Ice Regime System. This was addressed by having the authors meet with these groups at their pre-Arctic meetings and discuss the program and the Ice Regime System.
3. The Field Books were developed to ensure that information required by both the CHC and the CIS would be collected in a form that was simple to use.
4. Since the icebreakers had three different Vessel Classes, the Ice Multipliers were not the same for all of the icebreakers. Therefore, the Field Books were customized for each icebreaker. Further, since the working language on two of the icebreakers is French, these Field Books were translated and produced in the French language.
5. Digital cameras were purchased along with a system for downloading photographs onto the ISS computers. These were packaged together with the manuals and given to the ISS. The quality of the photos taken by all of the ISS was excellent. There were no problems in the use of the cameras other than a few of the ISS personnel having problems downloading the images to their laptop computer (it did not have the necessary USB port required by the video card reader). In those cases, the ISS downloaded the images onto one of the computers on the icebreaker and subsequently retrieved them.
ANALYSIS
Calculating the Ice Numeral
The data collection project showed that defining ice regimes and calculating the Ice Numeral was not a problem. Figure 3 shows the overall breakdown of the calculated Ice Numeral for the 201 events. In the majority of cases, the Ice Numeral was calculated correctly based upon the observed ice regime. However, three different types of mistakes were made:
The Open Water was not included in the ice regime in 16% of the cases. Since the Open Water Ice Multiplier is +2 for all vessels, this led to an overly negative Ice Numeral for those ice regimes. This was done consistently by only a few of the ISS personnel, and this skews the pie chart in Figure 3.
The wrong Ice Multiplier was used in 9% of the cases. For example, the ice regime was identified as having decayed ice, but the decay bonus of +1 was not applied to the Ice Multiplier.
A mistake was made in summing the contributions from each ice type when determining the Ice Numeral in 3% of the cases.
These results are encouraging despite the errors in determining the Ice Numeral in about one-quarter of the observations. The program shows that determining the Ice Numeral is relatively straightforward once the ice regime has been defined. The mistakes of neglecting the Open Water and incorrect summing can be corrected by taking a more careful approach. The mistake of choosing the incorrect Ice Multiplier would be remedied with more experience with the Ice Regime System.
Ice Numeral calculated correctly 72% Incorrect Ice Concentration 1% Open Water not taken into account 16% Arithmetic error 2% Decay not taken into account 8% Incorrect Ice Multiplier used 1%
Figure 3: Pie Chart showing the breakdown of the calculated Ice Numeral. Surface Properties and Ice Decay
Information was also collected to try to relate the surface conditions of the ice (i.e. the Stage of Melt) and ice strength. If a proven correlation could be found, the Stage of Melt could be used to infer the strength of the bulk ice sheet. To collect information on this, the ISS were asked to characterize the surface properties as: Snow Cover, Snow Melt, Ponding, Drainage, or Rotten/Decayed. These surface properties were
correlated to the ice strength that was obtained from the weekly Ice Strength Chart issued by the CIS. Figure 4 shows a histogram plot of the average ice strength for each of the five surface conditions. There is a weak trend of decreasing ice strength with the increasing state of surface decay. However, the range of the data is not large and the trend is not monotonic. This indicates that the surface conditions in the summer cannot be reliably used to indicate the strength of the ice sheet.
0 2 4 6 8 10 12
Snow Cover Snow Melt Ponding Drainage Rotten/Decay
Stage of Melt Ic e S tre n g th (% )
Figure 4: Histogram of the average ice strength versus the Stage of Melt of the surface ice during the summer months in the Arctic. The condition of Snow Cover would have significantly higher strengths if winter conditions were also considered.
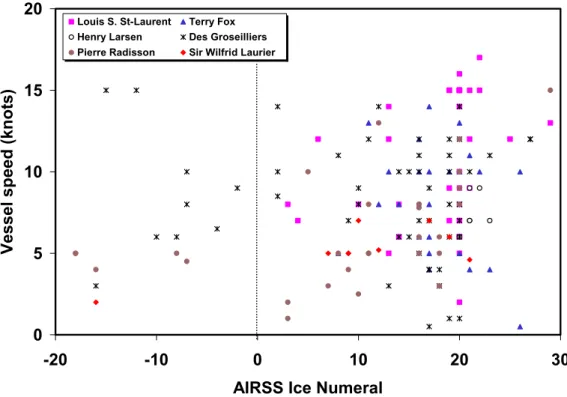
Ice Numeral and Vessel Speed
Figure 5 shows a plot of vessel speed as a function of the Ice Numeral for all vessels. There is no trend evident. This, however, is not surprising since the vessel speed is not necessarily the highest speed that the vessel could travel in the ice regime. In many cases, the CCG vessels were engaged in activities that would limit their speed (e.g. escorting another vessel). It is interesting to note that for the Des Groseilliers, there are a few anomalous observations of high speeds in ice regimes that gave a highly negative Ice Numeral.
0 5 10 15 20 -20 -10 0 10 20 3 AIRSS Ice Numeral
Vessel speed (knots)
0
Louis S. St-Laurent Terry Fox Henry Larsen Des Groseilliers Pierre Radisson Sir Wilfrid Laurier
Figure 5: Vessel speed versus the AIRSS Ice Numeral for all vessels. Ground-Truthing of CIS Ice Charts
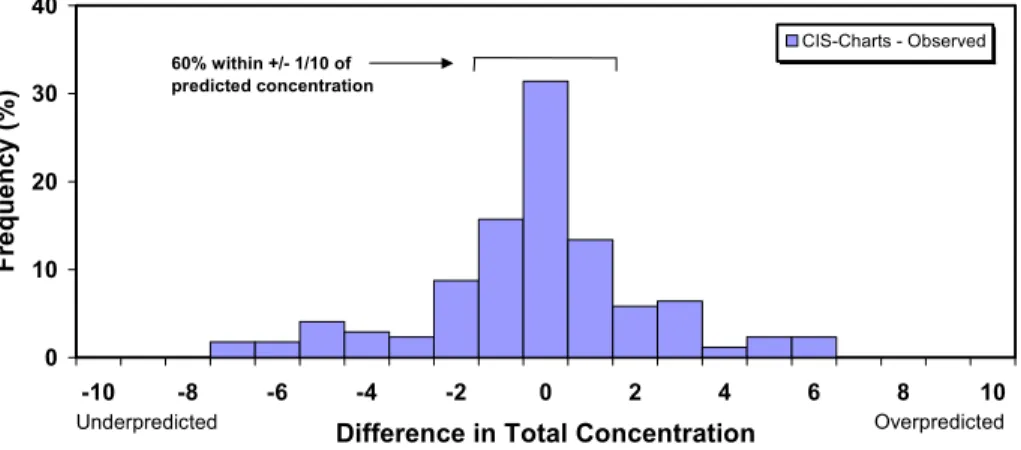
The data collected can be used to ground-truth the ice conditions forecasted by the CIS on the Daily Ice Charts. Figure 6 shows a histogram of the difference between the total ice concentration indicated on the CIS Ice Chart compared to that observed onboard the CCG vessels. Each data point corresponds to a particular latitude/longitude position and the concentration is compared to the last available Ice Chart for that location. The comparison shows that for total ice concentration, the CIS Charts agree with the actual observations to within ±1/10 in 60% of the cases. This agreement is quite remarkable considering that the comparison is a point observation on an Ice Chart that has a scale of 1:2-million. Other types of comparisons can also be made with the data.
0 10 20 30 40 -10 -8 -6 -4 -2 0 2 4 6 8 10
Difference in Total Concentration
Frequency (%)
CIS-Charts - Observed 60% within +/- 1/10 of
predicted concentration
Underpredicted Overpredicted
Figure 6: Histogram showing the difference between the total ice concentration from the CIS Ice Charts and the observed ice concentration.
Ice Numerals
In the Ice Regime System, the Ice Numeral must be based on the ice regime seen from the Bridge of the vessel. Prior to transiting ice-covered waters, the CIS Ice Charts can be used to generate Ice Numerals for planning purposes and route selection. Since the Ice Charts were available to the Coast Guard, it was possible to compare the Ice Numerals calculated from the Bridge observations with those estimated from the CIS Ice Charts. Figure 7 shows the results for the 172 events in which the Ice Chart information was available.
The analysis indicates that the Ice Numeral estimated using the CIS Ice Charts was in agreement with the bridge observations in about 27% of the events. On average, the Ice Charts overestimated the Ice Numeral. This is a direct result of the finding from this study that the CIS Charts often underpredict the amount of multi-year ice, especially for smaller multi-year floes. 0 5 10 15 20 25 30 -28 -24 -20 -16 -12 -8 -4 0 4 8 12 16 20 24 28 32 36
Difference in Ice Numeral
Fr
equency (%)
CIS Charts - Observed All ice types
N = 172
Underpredicted Overpredicted
Figure 7: Comparison of the Ice Numeral as calculated from the CIS Ice Charts with those observed from the Bridge.
SUMMARY
This data collection program was highly successful and provided a great deal of extremely useful information. The data have been used to evaluate the ease of application of the Ice Regime System, to investigate any correlation between the ice surface properties and the ice strength, to ground-truth the Ice Charts, to investigate the use of the CIS Ice Charts in providing guidance for the Ice Regime System, and to apply the experience of the CCG Commanding Officers to the Ice Regime System.
ACKNOWLEDGEMENTS
The CHC would like to acknowledge the financial support of Transport Canada. The authors would like to thank the Commanding Officers of the Coast Guard icebreakers, the Ice Service Specialists of the CIS, Gary Sidock and Jean Ouellet of the CCG for their interest and active participation in this program, Dugald Wells of D. Wells Marine and Fiona Robertson of the CCG for their input into the program, Andrew Kendrick for his input on the Vessel Class for the icebreakers, Ivana Kubat and Anne Collins of the CHC/NRC for developing the database for the data, and Victor Santos-Pedro of Transport Canada for his support and interest in this work.
REFERENCES
AIRSS (1996). Arctic Ice Regime Shipping System (AIRSS) Standards, Transport Canada, June 1996, TP 12259E, Ottawa. Ont., Canada.
ASPPR (1989). Proposals for the Revision of the Arctic Shipping Pollution Prevention Regulations. Transport Canada Report TP 9981, Ottawa. Ont., Canada.
Gauthier, M-F., De Abreu, R., Timco, G.W. and Johnston, M.E. (2002). Ice Strength Information in the Canadian Arctic: From Science to Operations. Proceedings of the 16th IAHR International Symposium on Ice, pp 203-210, Dunedin, New Zealand.
Langlois, D., De Abreu, R., Gauthier, M-F., Timco, G.W. and Johnston, M.E. (2003). Early Results of the Canadian Ice Service Ice Strength Chart. Proceedings POAC’03 (this volume), Trondheim, Norway.
Timco, G.W. and Kubat, I. (2002). Scientific Basis for Ice Regime System: Discussion Paper. NRC Report CHC-TR-002, Ottawa, Ont., Canada.