HAL Id: hal-02056325
https://hal-mines-albi.archives-ouvertes.fr/hal-02056325
Submitted on 5 Mar 2019HAL is a multi-disciplinary open access
archive for the deposit and dissemination of sci-entific research documents, whether they are pub-lished or not. The documents may come from teaching and research institutions in France or abroad, or from public or private research centers.
L’archive ouverte pluridisciplinaire HAL, est destinée au dépôt et à la diffusion de documents scientifiques de niveau recherche, publiés ou non, émanant des établissements d’enseignement et de recherche français ou étrangers, des laboratoires publics ou privés.
Vigny
To cite this version:
Serge Monteix, Fabrice Schmidt, Yannick Le Maoult, Gérard Denis, Murielle Vigny. Recent Issues In Preform Radiative Heating Modelling. International Conference of Polymer Processing Society, May 2001, Montréal, Canada. �hal-02056325�
Recent issues in preform radiative heating modelling
Serge Monteix(*), F. Schmidt(1 )(*), Y. Le Maoult(*), G. Denis(**), M. Vigny(**)(*)Ecole des Mines d’Albi-Carmaux Campus Jarlard, Route de Teillet, 81013 ALBI CT Cedex 09 (France)
(**) Perrier-Vittel M.T., BP 43 88805 Vittel Cedex (France),(1) : corresponding author.
Abstract
The injection stretch-blow moulding process of thermoplastic bottles requires an heating step before forming. During this step, an amorphous preform is heated above the glass transition temperature using an infrared oven. This step is fundamental in order to determine the thickness distribution along the preform height and then insure high quality bottles. Basically, the infrared oven is constituted of a row of halogen lamps, a cooling device, different aluminium reflectors, a rotating support where the preform is fixed. These facts lead to manage various parameters such as lamps temperature, the shape of the lamps, the position of the lamps, the heat transfer coefficient between cooling air and the preform. Thus, the optimisation of the infrared oven based on trial and errors even becomes tedious and yields to develop numerical modelling. In this work, various experiments have been conducted in order to characterise the heat source and the semi-transparent properties of the P.E.T. Measurements of air temperature inside the infrared oven and air cooling speed have been processed. The surface temperature distribution of the preform has been measured using an infrared camera. The relevant parameters have been implemented in a software called PLASTIRAD based on the control volume method and developed to simulate the infrared heating of polymers. Different comparisons between experimental measurements and numerical simulations for rectangular sheets, fixed as well as rotating preforms, have been successfully achieved.
Introduction
The injection stretch-blow moulding process of PET bottles requires a
heating step prior forming. During this step, the amorphous preform is heated
from the ambient temperature to the forming temperature (above the glass
transition temperature
≅ 80°C). As the polymer conductivity is low ( ≅ 0.29
W/m/K for the PET), the heating step is performed using an infrared oven.
This device is constituted of a row of halogen lamps, which permit a rapid
heating with high flux intensities; and a cooling fan to heat-loss the external
surface of the preform. However, the infrared heating causes high
temperature gradients inside the preform. Thus, the optimisation of the
heating step is critical in order to control the final thickness distribution of the
bottle and the polymer microstructure, which in turn govern the mechanical
properties of the product.
However, there are plenty of parameters such as number of lamps, distance
between halogen lamps and preform, electrical power of the lamps,
air-cooling speed, reflectors, rotation speed. Therefore, optimising infrared oven
in order to design new plastic bottles is still a long and costly work. The main
objective of this work was to develop numerical software using control
volume method that simulates the heating step of the preform. For that, we
have to take into account influent parameters of the heating step such as
halogen lamps, characterisation and P.E.T, spectral properties. In addition,
we need to measure the preform temperature. We have used an 880 LW
AGEMA infrared camera (connected to real time software) in order to
measure external and internal preform surface temperature distribution, heat
transfer coefficient along preform height. The air temperature surrounding the
preform and inside the preform is measured using thermocouples.
Modelling of infrared PET preform heating
3D control-volume software, called PLASTIRAD, has been developed in order to compute heat transfer during the infrared-heating step. The preform (sheet or cylinder) is meshed using cubic or hexahedral elements so-called control volumes [1]. The temperature balance equation including radiative transfer (thermal power absorbed by the semitransparent P.E.T. preform and radiated from halogen lamps) is integrated over each control volume and over the time from t to t+∆t (1):
ρ c
p∂T
∂t
dΩ dt = −
(q
c →.n
→ Γe∫
∆t∫
Ωe∫
∆t∫
) dΓdt +
(q
r →.n
→) dΓdt
Γe∫
∆t∫
(1)Where Ωe is the control-volume, qc and qr the Fourier’s conductive and the radiative fluxes. The unknown temperatures are computed at the cell centres of the elements. The specific lamp geometry is also considered, taken into account from a view factor computation. The particular lamps used in the infrared oven are composed of a coiled tungsten filament (length: 300 mm), contained in a quartz tubular enclosure (diameter: 10 mm) filled with a neutral gas (Argon) and coated on its back with a ceramic reflector in order to increase the heat flux received by the product. In our model, we assume a constant filament temperature and then a uniform source temperature. Thus the amount of radiation, reaching each front elements of the irradiated preform, is performed with the contour method (2) using Stokes theorem [2]:
F
H→ p=
1
2πS
Hln r.dr
→H.dr
→rp ΓHΓr p∫∫
(2)Where the subscripts H refers to the heater and p to the preform front element under consideration, r is the distance between two elemental linear elements, issued from the discretisation of the entire heater boundary ΓH and Γrp for each surface of control element’s boundary reaching the irradiated preform’s face. This contour method integration was chosen between different numerical view factor methods (Monte Carlo or geometrical method). This method allows a good accuracy with a very low computational time. An efficient numerical method based on Gaussian quadrature has been applied in order to perform the contour integration. The computation of the amount of incident radiation, for each surface element, is given in equation (3):
Φ(r
p) = k
rF
H→ rpS
HS
rpε
λ(T
Fil)π
∆λ∫
L
λ0(T
Fil)dλ
(3)Where ελ is the spectral tungsten emissivity, Tfil the filament temperature, the blackbody intensity, λ a given wavelength between [0.2,10] µm and k
0 λ
L
r the efficiency factor of the ceramic reflector. In a first approximation, internal radiative transfer is assumed mono-dimensional across the preform thickness. The PET bulk temperature (
≤
400K) is very low in comparison to the source temperature (Tfil > 2000 K). Therefore, the assumption of cold material is convenient. This leads to express the transmitted flux across the thickness of the material, for an homogenous andamorphous PET, using the Beer-Lambert’s law, if the coordinate y describe the thickness, we have, in a simple way, for the flux (4):
Φ
λ(y)
= Φ
λ(y
= 0)e
− kλy(4)Where kr is the spectral absorption coefficient of our material. Further details on this specific numerical model are given in [2].
Heat source characterisation: Filament and Quartz temperatures,
efficiency of the reflector.
Spectral properties of these elements have already been measured in a previous work [2]. Using these data, the tungsten filament and quartz tube temperatures are calculated using a net radiation method [3] with (5): = − − − − + = − − − ∞) 0 ( ) ln( *) ( 2 ) ( ) ( 0 ) ln( *) ( 2 ) ( 4 4 4 T T hS T S d d T T T k L T S T T d d T T T k L T S T P Q Q Q Q Q Fil Q Q Fil Argon Q Fil Fil Fil Fil Fil Q Fil Q Q Fil Argon Q Fil Fil Fil Fil σ ε π σ ε α π σ ε (5) Where P is the electrical power of the lamps; the indices Fil and Q refer respectively to the
filament and the quartz tube, T is the temperature, L is the length of the lamp, d the filament or the quartz tube diameter, ε, α the emissivity and absorptivity. T* is assumed to be equal to
2 Q Fil T
T +
. We have simplified this model by computing directly total parameters instead of spectral ones (as emissivity and absorptivity) with polynomial functions depending on temperatures which is easier and saves time. The temperatures of the filament and the quartz tube are computed at steady state using a Newton-Raphson method. The results of this computation are shown on figure 1. Additional curves are plotted on the same graph, they are related to experimental measurements: Colour temperature of the filament and temperature computed with a resistivity method. At the nominal power of one kW, we have found the following values:
Filament temperature (K)
Quartz temperature (K) 2360 730
Table 1
As shown on figure 1, the discrepancy between the extremal curves is important: greater than 100 K around 2350 K. This fact is due to the lack of knowledge on the properties of this particular kind of tungsten (coiled filament). On the other hand, “colour” temperature remains difficult to measure at such level of power. In order to conclude, we have chosen the computed temperature as a “mean” temperature, lower and upper limits of the temperature, at 1 kW (see graph on figure 1), will be considered as the global uncertainty. Using experimental set-up described in [2], the efficiency factor of the ceramic reflector has been measured:
kr(θ,Τr) = ) , ( ) , ( r w r r T T θ θ Φ Φ (6) 3
The index r and w refer respectively to the lamp with a ceramic reflector and without reflector.
The angle θ describes by a detector around the heater and Tr the temperature of the reflector. This value is obtained using a thermopile detector with a large spectral bandwidth [0.25,26µm]. The output signal delivered by the thermopile is related to the flux emitted by the lamp, so the ratio of the two fluxes measured by the detector and introduced in (6) gives the efficiency of the coating. We have checked that this efficiency is unaffected by the variation of the temperature of the filament and that the emission of the lamp is quasi isotropic. Therefore, we have obtained:
kr =1.36
±
0
.
02
Characterisation of P.E.T. spectral properties
P.E.T. spectral properties measurements were performed using a 3-mm thick sheet. These sheets were processed by injection moulding in the same conditions than tubular preforms. Thermal analysis experiments were carried out in order to measure the sheet crystallinity. Samples of 10-15 mg weight were cut away from the thick sheet. The DSC experiments were performed on a Mettler calorimeter at a heating rate of 10°C/min. The average crystallinity value of these measurements was about 5 %, corresponding to an amorphous P.E.T, which confirms that diffusion of the radiation can be neglected. Then we have proceeded to P.E.T spectral properties measurements (transmitivity, reflectivity) using a Perkin-Elmer FT-IR spectrometer. The previous thick sheets were polished in order to obtain samples of 0.3-mm thickness, spectra are used as a database in the numerical simulation [5]. In addition, we have found that the polymer is opaque for wavelengths in the range of 8 to 12 µm with an integrated emissivity of 0.93. This bandwidth corresponds to the one of the infrared camera.
Experimental data
Figure 2 shows the experimental set-up developed based on industrial infrared oven using in injection blow moulding machines. This device consists of six halogen lamps (Philips 1000 W-235 V SK15), monitored by power device. The preform is fixed on a rotating support to provide homogeneous hoop temperature. Behind the preform, there is a cooling fan controlled by a DC supply. A pneumatic system allows the preform displacement inside and outside the oven.
Measurement of the air temperature inside the oven
For the measurement of the air temperature inside the oven, J type thermocouples were used. They are connected to a Keithley recorder instrument. All thermocouples are shielded with aluminium adhesive tape. In order to place a thermocouple inside the preform, the top of this one is drilled (Figure 3).
Measurement of surface temperature distribution
The internal surface temperature measurement of a tubular preform is more tedious and necessitates developing a specific process. First, we have to cut the preform in its longitudinal-section. Then, the two half-parts of the preform are sticking together using a conductive grease to insure joining during the heating time. All the lamps are set to the same temperature, coupled with the cooling fan, during 20 seconds. Then the rebuild preform exits from the oven in front of the camera. In order to make possible the internal surface temperature measurement, one half-parts is removed (immediately after preform recovering or after a characteristic inversion time). This particular method and the results associated (Infrared thermograms) have been presented in reference [5].
Measurement of air forced convection heat transfer coefficient
In this section, we want to determine the air forced convection heat transfer coefficient, generated by the cooling fan along the preform height. Two different methods are developed and compared. The first one consists in measuring air-cooling speed using a hot wire anemometer (Ans Snelco). The calculated Reynolds numbers deduced from these data are in the range between 4000 and 10000 that is to say a turbulent flow. Then, we identify from the literature [3] different classical relationships that are suitable for a cylinder in cross flow, i.e. . The second method is based upon the preform surface temperature measured by the infrared camera in presence of cooling flow. The following specific experimental procedure has to be observed in order to compute the heat transfer coefficient: first, a 20 seconds heating time coupled with cooling; then turn off heating and cooling in order to insure an uniform temperature throughout the preform thickness; then restart the cooling fan. Thus, the last step of the procedure allows solving analytically the energy balance integrated over the thickness if we assume that the main part of the preform is a hollow tube. For a given height, the relationship for the heat transfer coefficient h yields:
(
Re,Pr f Nu=)
(
)
Re Ri Re T T dt T d Cp h o t 2 2 0 − − − = ∞ = ρ (7)Where T is the thickness-average temperature, Cp the P.E.T heat capacity, ρ the P.E.T specific mass, T the thickness-average ambient temperature, R∞ e and Ri are respectively the external and internal preform radii. Ri is computed using the depth penetration throughout the preform over a characteristic time t, for which we have sufficient temperature data to calculate the initial slope
0 = t dt T
d of the temperature-time plot (see figures 4).
β α t Re e Re Ri= − = −2 ∆ (8)
Where α is the P.E.T diffusivity and β the argument of the erf function, computing assuming the surface temperature has decreased of 90% at the depth thickness. In figures 4, we present a comparison between the heat coefficient measured using both methods. The agreement between the two different methods is fair. It permits to calculate an average air cooling heat transfer coefficient of 45 ± 5 W/m2.K. The same experiment has been conducted on different industrial ovens and the values of h are in the range [35,60] W/m2.K that is very close to our laboratory results.
Numerical simulation
We performed simulations of typical heating for a P.E.T tubular preform, taking into account processes parameters introduced previously. The values of the main parameters are summarised in the tables 2 below, results are presented on figures 5,6 and 7:
Tubular PET Preform (diameter : 25 mm, height : 100 mm, variational thickness : 2-3
mm)
Heating time (s) Cooling time (s) Number of lamps Distance lamps- preform /mm h (W/m2.K) Lamps Temp. (K) Rotation speed (r s-1) 15-20 35- 6 20 8 (natural)/ or recorded data (forced) 2360 1.2- 5Table 2
Two different configuration have been examined; considering a fixed or a rotating preform in front of halogen lamps with a consequent time of 15 and 20 seconds respectively.
Discussion
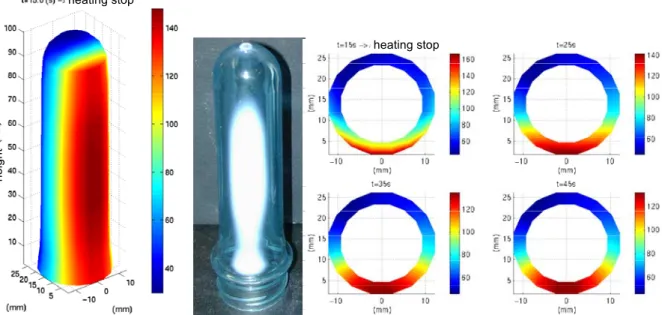
Figure 5 shows the characteristics thermograms obtained by numerical computation. They prove the geometrical distribution of irradiated flux in agreement with crystallisation profile of PET preform after the corresponding heating. In the same way temperature across the preform thickness versus the time describes irradiated flux absorption and the influence of conductive heat transfer after the heating stop. The modelling of radiative heating of PET preform take into account the transmitted heat flux through the front part of the preform to the second one shaded of the direct heat flux of halogen lamps [7].
Comparison of experimental and numerical temperature results (Figure 6) from internal and external preform surfaces lead to conclude that the model is convenient. Even on the back part, where numerical temperature results are close to measurements with a computed relative error about 10%.
Finally simulation of a rotating preform has been realised, and compared to measurements, taking into account all the process parameters as the electrical power of halogen lamps and the cooling fan flow. To do this we processed of comparison between experimental and numerical temperature in order to determine the participation of the cooling fan boxes. This equipment in fact appears as a front reflector for the preform from the halogen lamp irradiance. Making iterations considering at this step natural convection, we determined this reflector efficiency equal to 1,55. Taking into account this participation, we added to the modelling parameters the cooling fan influence from the measurement of the heat transfer coefficient (Figure 4).
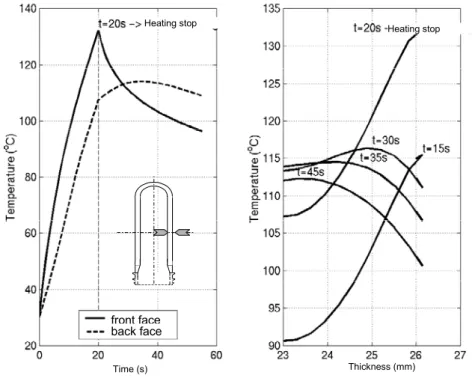
Temperature distribution versus the time (Figure 7) from temporal marking inside and outside preform lead to observe the typical temperature inversion through the preform thickness after the heating stop. Comparison with experiments are plotted (Figure 8)
Conclusion
Numerical simulations of P.E.T preform heating stage have been performed, by using characterisations of halogen lamps and P.E.T spectral properties. All the measured parameters have been included in the numerical model. The agreement between numerical simulations and experimental data is fair considering the simple model used for absorption (Beer-Lambert law). The infrared camera appears as a powerful device to make quantitative temperature measurements on the preform and to assess the numerical simulations. This study has revealed the main influence of the transparence of the PET, showing a consequent increase of the temperature of the shaded back part of preforms. It confirmed the temperature inversion through the preform thickness due to the conductive heat transfer after heating stop. Also making comparison between experimental and numerical temperature distribution of preforms the relative error is less than 10%. These results have been obtained over a laboratory oven. In further developments this study will be conducted over industrial oven of blow moulding machines.
Acknowledgements
Perrier-Vittel Company supports this work. Special thanks go to J-P. Arcens for his help on the experiments.
Reference
[1] Patankar S.V., “Numerical Heat Transfer and Fluid Flow “, Ed. Mc Graw Hill, New-York, 1980
[2] Rammohan R., “ Efficient Evaluation of Diffuse View Factors For Radiation”, Int. Journal . Heat and Mass Transfer, Vol 39,N°6 p1281-1286-1996.
[3] Monteix S., Schmidt F., Le Maoult Y. “Modélisation du chauffage infrarouge de plaques en P.E.T”, IVe Colloque Interuniversitaire Franco-Québecois, “Thermique des systèmes à température modérée”, Montréal –Québec-1999.
[4] Petterson M., ”Heat Transfer and Energy Efficiency in Infrared Papers Dryers”, Ph. D. Thesis, Lund University, Sweden-1999.
[5] Monteix S., Schmidt F., Le Maoult Y. “Experimental study and Numerical Simulation of Sheet and Tubular preform Infrared Heating”, QIRT 2000, Eurotherm Seminar N°64-Reims-France.
[6] Incropera F. De Witt D.P.,” Fundamentals of heat and mass transfer”, Third Ed. 1990
[7] Monteix S.,”Modelisation du chauffage convecto-radiatif de preformes en PET pour la realisation de corps creux”, Phd Thesis , ENSMP, 2001, (in french)
Figures
Figure 1 : Filament temperature versus electrical power
Figure 2 :Experimental setup, Figure 3 : Thermocouples oven’ instrumentation the infrared oven (inside the tubular preform and air temperature)
Figures 4 : Surface temperature versus time (cooling) Forced convection coefficients infrared measurements (along the preform height )
heating stop
heating stop
hei
ght
Figure 5 Characteristics thermograms and crystallisation profile of PET fixed preform
halogen lamp
internal face external face
temperature marking =
Time (s) Time (s) Time (s)
Re la tive e rro r (%) Re la tive e rro r (%) T(t) external face T(t) external face T(t) internal face T(t) internal face Time (s)
Figure 6 Comparison between measurements and computations of surface temperature of fixed PET preform
Time (s) Thickness (mm) Heating stop Heating stop
front face back face
Figure 7 Numerical Temperature versus time of rotating preform submitted to forced convection and front back radiative reflectors
numerical results
experimental results
Time (s)
Figure 8 Comparison between experimental and numerical temperature for preforms inside a laboratory infrared oven of a blow moulding machine