Science Arts & Métiers (SAM)
is an open access repository that collects the work of Arts et Métiers Institute of Technology researchers and makes it freely available over the web where possible.
This is an author-deposited version published in: https://sam.ensam.eu Handle ID: .http://hdl.handle.net/10985/13820
To cite this version :
S. M. MUJIBUR RAHMAN, Rizwan MAHMOOD, Sébastien ROLAND - Impact of Molecular Weight on the Thermal Stability and the Miscibility of Poly(-caprolactone)/Polystyrene Binary Blends - Journal of Polymers and the Environment - Vol. 26, n°8, p.3511-3519 - 2018
Any correspondence concerning this service should be sent to the repository Administrator : archiveouverte@ensam.eu
Impact of Molecular Weight on the Thermal Stability
and the Miscibility of Poly(ε-caprolactone)/Polystyrene Binary Blends
Al Mamun1 · S. M. Mujibur Rahman1 · Sébastien Roland2 · Rizwan Mahmood3Abstract
Poly(ε-caprolactone) (PCL) and two different molecular weight (6K and 650K) of polystyrene (PS) were mixed in solution to prepare binary blends of PCL/PS with various compositions. The impact of the molecular weight of PS in the blends was studied on thermal stability and miscibility by the thermogravimetric analysis (TGA) and the differential scanning calorim-etry (DSC) method. The TGA results under dynamic conditions in an inert atmosphere show that the thermal stability of the blends depends on the length of PS molecules. The increase of the low molecular weight PS into the PCL/PS blend reduces the thermal stability while the high molecular weight PS improves the thermal stability. The crystallization peak temperature, enthalpy, and crystallinity of the blends are found molecular weight dependent; these parameters with blend compositions deviate from linearity of additive law for low molecular weight PS, while they do follow the additive law for high molecular weight PS. A significant melting point depression of PCL crystals with composition was observed for the blends with the incorporation of the low molecular weight PS, while the no significant melting temperature depression was observed for the high molecular weight PS. The experimental results clearly indicate that in the PCL/PS blends, the thermal stability and the interaction between the neat components strongly depend on the molecular weight of the PS.
Keywords Poly(ε-caprolactone) · Polystyrene · Molecular weight effect · Miscibility · Thermal stability
Introduction
Commodity polymers can be made useful by blending them under appropriate conditions due to the structure–property relationship of the polymeric materials which depends on the chemical interactions between the component polymers in the blend. If repulsive interactions are predominant, immiscible blends are observed and hence the microphase domains are formed in the blends. The understanding of the
interactions and the phase separation process can lead to improving the final properties of the polymer blends [1]. Poly (ε-caprolactone) (PCL) is a well-known biodegradable polymer that has been widely used in various biomaterial applications including three-dimensional scaffold for tissue engineering [2]. Especially, PCL possesses superior mechan-ical properties of high strength and elasticity compared with other biodegradable polymers. The PCL-based material is, therefore, suitable for use in biomedical applications like surgical sutures, tendons, cartilage, bone, and other applica-tions in which mechanical strength and stability are impor-tant. But in some cases, the mechanical properties, biodeg-radability, and biocompatibility of the neat PCL cannot meet the requirement for its applications and the modification of PCL is necessary. One of the convenient way to modify the properties is to make blend by mixing with other polymers. Moreover, the advantage of the blends compared with the components is that the blends have a variety of important features when they solidify from the melt [3, 4]. To explore these properties, PCL has been blended with many synthetic polymers such as poly(L-lactic) acid (PLLA), polyglycolic acid (PGA), polyurethane (PU), and polystyrene (PS) [5].
* Al Mamun
almamun@squ.edu.om
1 Department of Physics, College of Science, Sultan Qaboos
University, Muscat, Oman
2 PIMM, ENSAM/CNRS/CNAM, UMR 8006, 151 boulevard
de l’Hôpital, 75013 Paris, France
3 Department of Physics and Engineering, Slippery Rock
Among them, PS is amorphous, clear, hard, and brittle, and most importantly it is a cost effective polymer. Therefore the blends of PCL/PS are attractive materials because of its sustainability, respect for the environment, and their ability to form a wide range of materials [6, 7]. It is well estab-lished that depending on the interaction between the two polymers, blending of the polymer greatly influences the thermal stability [8–10]. The interaction between the two polymers depends on the compatibility and the composi-tion ratio of the components in the blend. There are several factors that affect the compatibility, for example, chemistry, molecular weight, and the processing parameters such as temperature [11].
Molecular weight is one of the important parameters that plays a significant role on the compatibility of the blends and become an interesting research subject for both theoretical and industrial point of view [12]. Li et al. [13] investigated PCL/PS blends with the intermediate molecular weight of PS (22K), where PS is glassy in the bulk state found immis-cible. Ma et al. [14] have analyzed the morphology and found an enriched two-layer structure for the PCL/PS blends; PS at the upper layer and PCL at the bottom layer by spin coating. Nojima et al. [15] have prepared PCL/PS blends and studied their morphological and crystallization behavior at various crystallization temperatures using X-ray scattering method. It was also reported that PCL/PS blends have good mechanical properties, although the blend was incompat-ible in mixing. The most common use of polystyrene in the mentioned literature is atactic and, the blends are prepared using melt mixing and found incompatible with PS [16, 17]. However, it is important to study this mixing blends in the solution, for thermal stability and to control the mechanical properties; theoretically, the solution mixing is more benefi-cial to improve the compatibility and/or miscibility of the two polymers that retard the phase separation microscopi-cally comparing with the melt mixing blends [18]. It is also important to employ different molecular weight of PS to evaluate the miscibility due to the fact that molecular chain length might have a significant effect on the miscibility and possibly a miscible PCL/PS blend can be found for the low molecular weight PS. In addition, thin films can be fabri-cated with unique phase separation and crystal morphologies from PCL/PS blend in solution, which has great potential for application in the biomaterials field [19].
Previously, we have reported morphologies of various PCL/polymer blends in ultrathin films [20, 21]. The crys-tallization kinetics was explained from glassy and molten states. In this present study, the impact of the two different molecular weight of PS on the thermal stability and misci-bility of PCL/PS blends are investigated. The aim of this report is to evaluate the impact of the molecular weight on the miscibility of the PCL/PS binary blends and if so, how they influence on the miscibility. Especially, the low
molecular weight PS has the possibility to be miscible with PCL. Moreover, the crystallization and melting behavior of the blends are studied as a function of composition and the molecular length in details. Such studies of finding misci-ble PCL/PS misci-blends are of great interest in the development of composites materials and blends from biodegradable polyesters.
Experimental
Materials and Sample Preparation
Poly(ε-caprolactone) with a molecular weight of
Mw = 14,000 g/mol, and two different polystyrenes with
Mw = 6000 and 650,000 g/mol were purchased from Aldrich Chemicals and used without further purification. The com-ponent polymers were weighted using electric balance and dissolved in tetrahydrofuran (THF, 99.99%, VWR). The mixture was then stirred continuously for a day using a magnetic stirrer at room temperature in a dark room. The solution was then poured into a Petri-dish for solvent-cast-ing. The solvent in the cast samples was first vaporized at a controlled temperature inside a fume hood and the residual solvent was removed in a vacuum oven for a week. Blended compositions indicated in this report are always weight com-positions, for example, a blend of 60 wt% PCL and 40 wt% PS of Mw = 6000, will be referred as 60PCL/40PS(6K).
Thermogravimetric Analysis
Thermogravimetric measurements were carried out on a Thermal Analysis (TA) instrument Q600-SDT under nitro-gen flow. Samples of the blends with various compositions including the composition polymer of about 5 mg in weight were heated from room temperature to 600 °C for a complete degradation with a heating rate of 10 °C/min.
Differential Scanning Calorimetry
The miscibility, crystallinity, crystallization behavior, and subsequent melting behavior were followed by the conven-tional differential scanning calorimetry (DSC) using a TA Q2000 instrument. For the DSC experiments, the analysis was followed the standard test method for transition temper-atures and enthalpies of fusion for determining the thermal cycles and calorimetric parameters. The DSC was calibrated with a standard procedure by indium with a melting point of 156.6 °C. The samples, encapsulated in aluminum pans, were first heated to 200 °C and cooled to − 100 °C several times to erase any thermal history. For a typical experiment, the sample was heated to 200 °C, hold for five minutes, then cooled to − 100 °C, hold for five minutes. The thermal
diagram is shown in Fig. S1 in a supplementary document. The cycle runs for three times with a heating and cooling rate of 10 °C/min and the data were followed for the second run. Dry nitrogen gas was circulated around the sample to prevent thermal degradation. For all the DSC runs, a typi-cal sample weight of 3 ± 0.1 mg was used and the scans run with a heating and cooling rate of 10 °C/min. The crystal-lization onset temperature, crystalcrystal-lization peak temperature (Tc, peak), melting peak temperature (Tm, peak), and enthalpy of fusion (ΔH) was analyzed with the TA universal analy-sis software. The degree of crystallinity (Xc) of the samples
were calculated by the area of the melting peak per unit mass dividing by the enthalpy of fusion for 100% crystalline PCL of 157 J/g as reported in the literature [22].
Results and Discussion
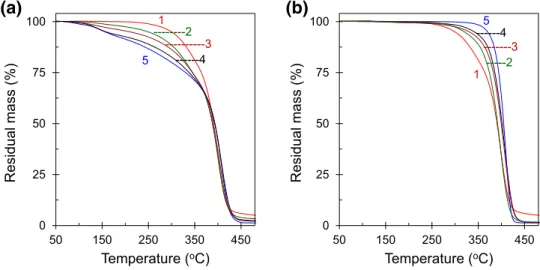
The thermal stability of the polymer blends usually depends on the nature of the polymer components in the blends. To study the thermal stability of PCL with incorporating PS, thermogravimetric (TGA) data were obtained for two dif-ferent molecular weights of PS. The dynamic heating of the neat PCL, neat PS(6K), neat PS(650K) and their respec-tive blends with different compositions (residual mass ver-sus temperature) are shown in Fig. 1. These curves were obtained in the temperature ranges between 30 and 600 °C with a heating rate of 10 °C/min. For simplicity, only a few selected blends and the neat components are shown in fig-ures in a selected temperature ranges. The neat PCL has greater thermal stability than neat PS(6K), and less stability than neat PS(650K) while their blends have thermal sta-bility in between. At least two temperature regions can be considered for the thermal stability of PCL, PS, and their blends. The initial degradation of PCL starts at about 225 °C while PS(6K) and PS(650K) starts at about 90 and 330 °C, respectively. About 25% weight loss can be seen for neat
PCL and neat PS(6K) at 355 °C, while the only negligi-ble amount of mass losses at this temperature for the neat PS(650K). The volatilization becomes rapid and almost complete degradation occurs at around 450 °C. The deriva-tive of the thermograms (DTG) is the rate of mass loss with temperature, for the neat components and their blends are shown in Fig. 2. The neat PS(650K) degrades only in single-stage while PCL degrades in a double-single-stage, neat PS(6K) and the PCL/PS(6K) blends degrade in a triple-stages, which is represented by a triple peak in the DTG curves. The inset image in Fig. 2a is an enlargement of the temperature ranges between 50 and 200 °C to clarify the triple-stage decomposi-tion for the neat PS(6K) and its blends. The peak posidecomposi-tion is shifted towards higher temperature upon the incorporation of PS(650K) into PCL, indicating improved thermal stability. At any temperature, neat PS(6K) shows maximum weight loss while neat PS(650K) shows minimum weight loss compare to the neat PCL. From the results it seems that the blend compositions are compatible for any cases; the ther-mal stability of neat PCL improved as the PS(650K) content increases and the stability decreases for the PS(6K) content in the blends. The thermal degradation of the polymer blend is a complex process considering that the PCL and PS are polymers with a quite different chemical structure. However, in both cases, the thermal stability of the blend is driven by the blend composition.
The DSC experiment was performed for the as-cast blends to reveal their thermal transitions and characterize the crystallization, melting behavior, compatibility, and miscibility of the PCL/PS blend as a function of the blend composition and molecular weight. For a better comparison with a uniform thermal history, all the DSC data were taken for three runs. We have followed the results by the second run after cooling from the melt of the respective blend. It is noted that the sample is heated to 200 °C for 5 min that is far above its equilibrium melt temperature to erase any ther-mal history or residual crystals. All the DSC traces show a
Fig. 1 Thermograms for residual mass as a function of temperature for the neat com-ponents and their blends; 1 neat PCL, 2 70/30, 3 50/50, 4 30/70 of PCL/PS blends and 5 neat PS of a low molecular weight PS(6K), and b high molecular weight PS(650K) 0 25 50 75 100 50 150 250 350 450 Residual mass (%) Temperature (oC) 1 ---3 ---2 ---4 5
(a)
0 25 50 75 100 50 150 250 350 450 Residual mass (%) Temperature (oC) 1 ---3 ---4 5(b)
---2significant glass transition, crystallization onset temperature, crystallization exotherm, and melting endotherm.
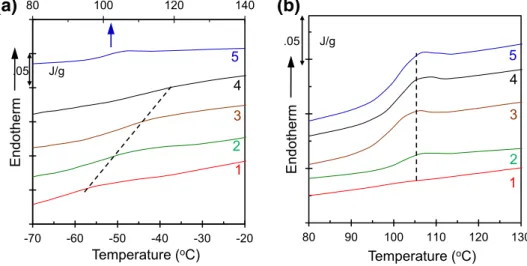
The glass transition temperature Tg, the characteristic transition of the amorphous region of a polymer or blend from a glassy state to a rubbery state, is the most con-venient and popular way of investigating the miscibility or immiscibility of pairs of polymers. The glass transition is a thermo-kinetic phenomenon with true phase transition but is a process in which frozen chain segments are unfrozen. It is well known that, for a miscible blend, only one Tg can
be seen when two appear for the immiscible blend. Figure 3
shows the thermograms in the glass transition temperatures region as a function of composition in the blend. For the PCL/PS(6K) blends, a single glass transition can be seen and the glass transition temperature varies with the compo-sition of PS in the blends (Fig. 3a). This shows the positive deviation goes from the glass transition temperature of pure PCL to pure PS, deviation from linearity often observed for miscible blends and ascribed to specific interactions between
the components. On the other hand, for the higher molecular weight PCL/PS(650K) blends, two glass transition region can be seen corresponding to the two polymers of PCL and PS in the blends. Figure 3b shows the glass transition region of PS as a function of PS(650K) composition in the blends, clearly indicate the immiscibility of the blends. The transition temperature is plotted as a function of composi-tion for both molecular weights of PS Fig. S2 in supporting document.
The crystallization onset temperature is the temperature where the initial nucleation starts after an initial induction time, from a random polymer network to a three-dimen-sional nucleus. The crystallization onset temperature of PCL crystallization shifts to few degrees lower with the increase of PS(6K) components in the blends (Fig. 4), which indi-cates that the increase of non-crystalline PS in the blends increases the induction time for the nucleation process. The induction time for the nucleation is the period needed to form a critical nucleus. Beyond that time, an embryo with
Fig. 2 The derivative of the thermograms (rate of mass loss) as a function of temperature for the neat polymers and their blends. The legends are the same as in Fig. 1. The inset image is an enlargement of the temperature ranges between 50 and 200 °C
0 1 2
50 150 250 350 450
Rate of mass loss (%
/ oC) Temperature (oC) 1--- 3----4--- 2---- 5--
(a)
0 1 2 50 150 250 350 450Rate of mass loss (%
/ oC) Temperature (oC) 1---3---- 4----2----
5--(b)
50 100 150 200Fig. 3 The plot of heat flow against temperature in the glass transition temperature range for a PCL/PS(6K), and b PCL/ PS(650K) blend system with a heating rate of 10 °C/min. The legends are the same as in Fig. 1
80 100 120 140 -70 -60 -50 -40 -30 -20 Endotherm Temperature (oC) .05 J/g 5 3 2 4 1
(a)
80 90 100 110 120 130 Endotherm Temperature (oC) .05 J/g 5 3 2 4 1(b)
a size greater than the critical size becomes stable and the number of nuclei increases with time [23]. The changing of the induction time in the nucleation process results in different onset temperature for the crystallization indicating the dilution of the compatible components at the molecular level. A similar trend for compatibility of polymer blends was found using melting point depression method [21, 24]. On the other hand, for PCL/PS(650K) blends, the onset tem-perature of crystallization does not influence with PS(650K) incorporation in the blends. This result infers that the dilu-tion of the components is not at the molecular level and the blends are immiscible.
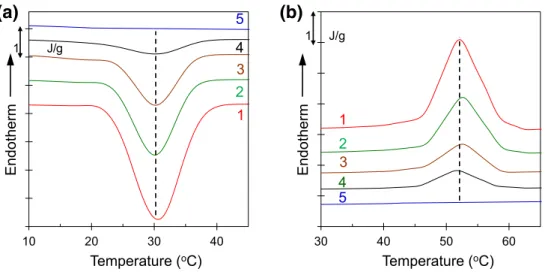
The crystallization peak temperature is a feature to study the crystallization rate observed by the DSC and can be noticed from the DSC representative thermograms shown in Fig. 4. The crystallization peak temperature and melting peak temperature decrease with the compositions for the blends with PS(6K). These differences in peak temperatures are related to many factors and one of the factors is an asso-ciation with the changes in nucleation density for miscible blends. It is noteworthy that for PCL/PS(650K) blends, the
crystallization peak temperature and melting peak tem-perature remains same with the composition of PS(650K) (Fig. 5a, b).
For a quantitative analysis, the crystallization and melt-ing peak temperatures are plotted against compositions and molecular weight as shown in Fig. 6. The crystallization peak temperature is found to be maximum 30 °C for neat PCL and rapidly decreases with increase in PS(6K) composi-tion up to 50 wt% as the non-crystalline part increases in the homogeneous melt of this polymer pair. At higher PS(6K) composition, above 60 wt%, the crystallization peak tem-perature levels off to become asymptotic at 23 °C due to the dominant part of non-crystalline PS(6K). The crystallization peak temperature decreases more than seven degrees from that of neat PCL. Such decrease is due to the homogeneous melt of the two polymers before crystallization where the presence of low molecular weight non-crystalline PS(6K) chains at the crystal growth front prevent the crystallization process. The decrease in the crystallization peak temperature with the incorporation of PS(6K) is a feature in line with the decrease in nucleation density observed in other binary
Fig. 4 The plot of the heat flow against temperature in a selected range for PCL/PS(6K) blends with heating and cooling rate of 10 °C/min, a for cooling from melt where only crystallization region is emphasized, and b subsequent heating where only melting region is emphasized. The legends are the same as in Fig. 1 10 20 30 40 Endotherm Temperature (oC) 1 J/g 5 3 2 4 1
(a)
30 40 50 60 Endotherm Temperature (oC) 1 J/g 5 3 2 4 1(b)
Fig. 5 Plot of heat flow against temperature in a selected range for PCL/PS(650K) with heating and cooling rate of 10 °C/min;
a for cooling from melt where
only crystallization region is emphasized, and b subsequent heating where only melting region is emphasized. The leg-ends are the same as in Fig. 1
10 20 30 40 Endotherm Temperature (oC) 1 J/g 5 3 2 4 1
(a)
30 40 50 60 Endotherm Temperature (oC) 1 J/g 5 3 2 4 1(b)
blends [25, 26]. Wu et al. have reported the details of the crystallization temperature depression for a non-crystalline part in the blends as a result of miscibility of the polymer pair consisted of polyethylene and ethylene/vinyl acetate copolymers [27]. A similar trend of the melting peak tem-perature depression was found for the corresponding melting of the crystallized blends of PCL/PS(6K) as shown in figures (solid circle in Fig. 6). On the other hand, the crystalliza-tion peak temperature (Tc, peak) and melting peak temperature
(Tm, peak) remains same with PS(650K) components in the
PCL/PS(650K) blends (open square in Fig. 6). This is due to the unique density fluctuations, where the crystallization process started from a heterogeneous melt of the blends. In this case, the same number of induced nuclei is always generated; infer that the blends are immiscible in all com-positions ranges studied here.
The molecular weight effect on the crystallization of the PCL/PS blends can be explained in more details using the crystallization enthalpy; the total heat required for full crystallization, (ΔHc) and by the melting enthalpy; the total
heat required for complete melting, (ΔHm). The
crystalliza-tion and melting enthalpy of the blends with composicrystalliza-tions usually shed more light on the qualitative intersegmental interactions between the two components. The crystalliza-tion and the melting enthalpy as a funccrystalliza-tion of the PS compo-sition for two different molecular weights of PS are plotted in Fig. 7. It should be noted that the error in the experi-mentally determined enthalpies could not be rather large (ca. 3%) due to the baseline fluctuation. In the case of low molecular weight PS(6K), the melting and crystallization enthalpies of the blends decrease rapidly first then slowing down at higher PS concentration. The decrease in the crys-tallization and melting enthalpies is due to the interaction of non-crystalline low molecular chains with PCL, results in the smaller sizes of the three-dimensional crystals and less amount of crystallizable materials. In this case, the nonlin-ear behavior of enthalpies with compositions does not fol-low the additive law. The deviation from linearity confirms the miscibility of the blends at the molecular level. On the other hand, for the high molecular weight of PS(650K), the
Fig. 6 Composition of PS in the blends dependence; a crystalli-zation, and b melting peak tem-perature for PCL/PS(6K) (solid circle) and PCL/PS(650K) (open square) blend system
22 24 26 28 30 32 0 20 40 60 80 100 Tc,peak ( oC) PS in blend (wt%) PS (6K) PS (650K)
(a)
46 48 50 52 0 20 40 60 80 100 Tm, peak ( oC) PS in blend (wt%) PS (6K) PS (650K)(b)
Fig. 7 The composition of PS in the blends dependence; a crystallization enthalpy, and
b melting enthalpy for PCL/
PS(6K) (solid circle) and PCL/ PS(650K) (open square) blend system 0 30 60 90 0 20 40 60 80 100 HC (J/g) PS in blend (wt%) (a) 0 30 60 90 120 0 20 40 60 80 100 Hm (J/g) PS in blend (wt%) (b) ∆ ∆
crystallization and melting enthalpies of the blends follow the additive law drawn by a broken line. The incorporation of the PS(650K) in the blends, the concentration of non-crystalline longer molecules increase linearly and retard the crystal growth which leads to a linear decrease of the crys-tallization enthalpy and as well for the melting enthalpy. A similar linear decrease of crystallization enthalpy and melting enthalpy has also been observed for the immiscible polymer blends of ethyl vinyl acetate (EVA) and ethylene octane (EO) copolymer [24]. This linear behavior confirms again the immiscibility for the PCL/PS(650K) blends.
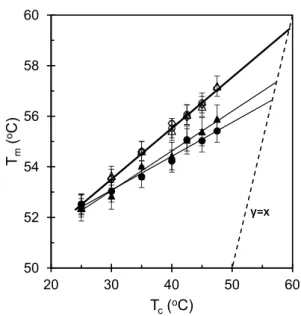
The melting point depression analysis is extensively used to evaluate the miscibility of the polymer blends. The method is credited to Nishi and Wang [28]. The method consists in finding the melt temperature of PCL, Tmo (or
equilibrium melt temperature of PCL in the blend, Tmbo) and
serves to calculate the interaction parameter. The samples were crystallized at a certain temperature for a sufficient time for full crystallization and subsequently melted to find the melting temperature. In practice, it requires a very care-ful attention to determine the true Tm, because it can differ
significantly due to the melt kinetic process during DSC run. The DSC endothermic peaks were carefully separated by standard peak separation software, and the melt temperature
Tm was carefully determined from the separated endothermic peak. A series of experiments were taken as a function of crystallization temperature for different blend compositions and, such a plot is depicted with different blend ratios in Fig. 8. The neat PCL and the blends show a linear increase of the melt temperature with crystallization temperature. The equilibrium melting temperature was obtained by extrapolat-ing the resultextrapolat-ing straight line to intersect with the line Tm =
Tc. The corresponding Tmbo value of the blends was found
lower than the neat PCL and the Tmbo values decrease with
blend composition with a significant experimental error, indicate that the PCL/PS(6K) blends are miscible. Due to large experimental error, we avoid calculating and compar-ing the interaction parameter uscompar-ing the Nishi-Wang equa-tion [28]. On the other hand, no melting point depression was observed for the PCL/PS(650K) blends, hence it is not possible to calculate the interaction parameter. It also con-firms that although the chemical interactions between the PCL/PS(6K) and PCL/PS(650K) blends are identical but due to the higher molecular weight of PS the PCL/PS(650K) blends cannot be mixed in the molecular label. This can be explained by the fact that, following Flory–Huggins theory, the statistical entropy contribution greatly contributes to the immiscibility. When the molecular weights of the com-ponents are decreased, the mixing entropy and the driving force responsible for miscibility in low molecular weight substance increases. This is why PCL/PS(6K) blends are miscible while PCL/PS(650K) are not [29]. Further studies of crystallinity with compositions raised more evidence with
melting point depression method. Blending affects crystal-linity in diverse ways due to the effects on nucleation and growth rates. Experimentally, in the miscible blends, an amorphous component usually slows down or even prevents, crystallization of the semicrystalline polymer [7].
The polymer crystallization process consists of two main mechanisms. The nucleation processes where after an initial induction time, the randomly entangled molecules in the melt start to aggregate to form three-dimensional nuclei, which is known as the primary nucleation process. The other is the crystal growth processes govern by the sec-ondary nucleation where the crystal becomes larger with time through the secondary nucleation, which significantly decreases the amount of amorphous melt and increases the crystallinity. For a typical semicrystalline polymer, the degree of crystallinity with time exhibits a sigmoidal curve. A similar sigmoidal shape of crystallinity disappearance with time can be observed for the melting and an analogy can be made between the melting and the crystallization processes [22]. Figure 9 shows the time dependence integral of the melting endotherm represented as the crystallinity for the neat PCL and the blends as a function of composi-tions for the two different molecular weights of PS. Here, it is important to note that, the time is counted between the onsets of the DSC melting endotherm and the end of DSC melting tail. The time-dependent crystallinity shows a com-mon and typical sigmoidal curve. It starts with the maximum crystallinity, which decreases with the melting of the crystal-line lamellae. Crystallinity then decreases rapidly to reach a final stage where a few thicker, more stable crystallites gradually transform into the molten state. From the Fig. 9,
50 52 54 56 58 60 20 30 40 50 60 Tm ( oC) Tc(oC) y=x y=x
Fig. 8 Hoffman-Weeks plot of Tm versus Tc for the neat PCL (circle),
80PCL/20PS (triangle), 60PCL/40PS (squared) with PS(6K) (solid symbol) and PS(650K) (open symbol)
it can be clearly seen that the crystallinity for different com-positions is different and does not follow the additive rule for the blends with low molecular weight PS whereas they do for the blends with high molecular weight of PS.
Here it is important to note that crystallinity is not a parameter for miscibility measurement of polymer blends. Miscibility in polymer blends is evaluated by the interac-tion of the amorphous moieties of the polymers, whether crystalline or not. Here we investigated the crystallinity due to the fact to show the impact of the molecular weight of PS between the two blend systems. The total crystallin-ity of a blend is plotted with the PCL composition for low and high molecular weight PS (Fig. 10). It can be seen that incorporation of the PCL in the blend gradually increases the crystallinity. For PCL/PS(6K) blends the crystallinity does not follow linear dependence as a function of composi-tion (solid circle). The step-like increase of the crystallinity clearly indicates the miscibility of the compositions in the blends. On the other hand, the PCL/PS(650K) blends show simply the linear additives law (open square) with the PCL incorporation in the blends.
Conclusions
The thermal stability and miscibility of PCL/PS blend with different compositions ratios and, molecular weights were studied by thermogravimetric analysis and differ-ential scanning calorimetry method. The addition of low molecular weight PS(6K) into the blend decreases, where the high molecular weight PS(650K) improve the ther-mal stability of all compositions ranges of the blends. The crystallization onset temperature, crystallization peak tem-perature, crystallization enthalpy, melting enthalpy, and crystallinity decrease with compositions and deviates from linearity of additive law for low molecular weight PS due
to the interaction at the molecular level, while remain-ing unchanged for higher molecular weight PS. All the experimental results suggest that PCL and PS are mixed at the molecular level within the blends at all compositions for low molecular weight PS, confirming the miscibility of the blends. On the other hand, the blends with high molecular weight of PS are found immiscible. The phase behavior of the blends using AFM is unclear due to the dewetting of the films; however, in the future work, we will try to change the chemical surface of the substrate to prevent dewetting. Mechanical experiments are currently in progress to study the impact of molecular weight and
Fig. 9 Time dependence integral of melting endotherm represented as crystallinity for;
1 neat PCL, 2 90/10, 3 70/30, 4 50/50, 5 30/70, and 6 10/90 composition in the a PCL/ PS(6K), and b PCL/PS(650K) blend system 0 10 20 30 40 50 0 1 2 3 4 Xc (%) t (min)
(a)
1 2 3 4 5 6 0 10 20 30 40 50 0 1 2 3 4 Xc (%) t (min)(b)
1 2 3 4 5 6 0 10 20 30 40 50 0 20 40 60 80 100X
c(%)
PCL in blends (%)
Fig. 10 The crystallinity calculated from the Fig. 9 as a function of PCL concentration in the blends of PCL/PS(6K) (solid circle) and PCL/PS(650K) (open square)
compositions on the mechanical strengthening and the crystal size in the blends and, will be reported elsewhere.
Acknowledgements The authors are grateful to the Chemistry Depart-ment, Sultan Qaboos University (SQU), Oman for the experimental facilities. One of the authors (Al Mamun) would like to thanks the Department of Physics of the SQU for hosting him as a Visiting Faculty during which this work has been completed.
References
1. Chu B, Hsiao BS (2001) Small-angle X-ray scattering of poly-mers. Chem Rev 101(6):1727–1762
2. Wan Y, Feng G, Shen FH, Laurencin CT, Li X (2008) Biphasic scaffold for annulus fibrosus tissue regeneration. Biomaterials 29(6):643–652
3. Li Y, Stein M, Jungnickel BJ (1991) Competition between crys-tallization and phase separation in polymer blends I. Diffusion controlled supermolecular structures and phase morphologies in poly(ε-caprolactone)/polystyrene blends. Colloid Polym Sci 269(8):772–780
4. Di Lorenzo ML, Pietra PL, Errico ME, Righetti MC, Angiuli M (2007) Poly(butylene terephthalate)/poly(ε-caprolactone) blends: miscibility and thermal and mechanical properties. Polym Eng Sci 47(3):323–329
5. Biresaw G, Carriere CJ (2004) Compatibility and mechanical properties of blends of polystyrene with biodegradable polyesters. Compos Part A 35(3):313–320
6. Woodruff MA, Hutmacher DW (2010) The return of a forgotten polymer Polycaprolactone in the 21st century. Prog Polym Sci 35(10):1217–1256
7. Utracki LA (2003) Introduction to polymer blends. In: Polymer blends handbook. Springer, Dordrecht, pp 1–122
8. Goh SH (1993) Thermogravimetric study of the thermal stability of poly(vinyl chloride)/poly(vinyl acetate) blends. Thermochim Acta 215(0):291–296
9. Klarić I, Roje U, Stipanelov N (1999) Kinetic investigation of thermooxidative degradation of poly(vinyl chloride)/acryloni-trile–butadiene–styrene blends by isothermal thermogravimetric analysis. J Appl Polym Sci 71(5):833–839
10. McNeill IC (1997) Thermal degradation mechanisms of some addition polymers and copolymers. J Anal Appl Pyrol 40–41(0):21–41
11. Vanoene H (1972) Modes of dispersion of viscoelastic fluids in flow. J Colloid Interface Sci 40(3):448–467
12. Rosa DS, Guedes CGF, Casarin F, Bragança FC (2005) The effect of the Mw of PEG in PCL/CA blends. Polym Testing 24(5):542–548
13. Li B, Esker AR (2007) Blends of poly(ε-caprolactone) and inter-mediate molar mass polystyrene as langmuir films at the air/water interface. Langmuir 23(2):574–581
14. Ma M, He Z, Yang J, Chen F, Wang K, Zhang Q, Deng H, Fu Q (2011) Effect of film thickness on morphological evolution in
dewetting and crystallization of polystyrene/poly(ε-caprolactone) blend films. Langmuir 27(21):13072–13081
15. Nojima S, Ono M, Ashida T (1992) Crystallization of block copol-ymers II. Morphological study of poly(ethylene glycol)-poly(ε-caprolactone) block copolymers. Polym J 24(11):1271–1280 16. Múgica A, Calahorra ME, Cortázar M (2002) Compositional
vari-ation of glass-transition temperature in miscible polymer blends involving weak and strong specific interactions. Macromol Chem Phys 203(8):1088–1098
17. Ruzette A-VG, Mayes AM (2001) A simple free energy model for weakly interacting polymer blends. Macromolecules 34(6):1894–1907
18. Jin J, Du J, Chen H, Han CC (2011) Fluctuation-assisted nuclea-tion in the phase separanuclea-tion/crystallizanuclea-tion of iPP/OBC blends. Polymer 52(26):6161–6172
19. Ma M, He Z, Li Y, Chen F, Wang K, Zhang Q, Deng H, Fu Q (2012) Surface phase separation, dewetting feature size, and crys-tal morphology in thin films of polystyrene/poly(ε-caprolactone) blend. J Colloid Interface Sci 387(1):262–269
20. Mamun A, Mareau VH, Chen J, Prud’homme RE (2014) Mor-phologies of miscible PCL/PVC blends confined in ultrathin films. Polymer 55(9):2179–2187
21. Mamun A, Bazuin CG, Prud’homme RE (2015) Morphologies of various polycaprolactone/polymer blends in ultrathin films. Macromolecules 48(5):1412–1417
22. Siqueira G, Fraschini C, Bras J, Dufresne A, Prudhomme R, Laborie M-P (2011) Impact of the nature and shape of cellulosic nanoparticles on the isothermal crystallization kinetics of poly(ε-caprolactone). Eur Polym J 47(12):2216–2227
23. Mamun A, Umemoto S, Okui N, Ishihara N (2007) Self-seeding effect on primary nucleation of isotactic polystyrene. Macromol-ecules 40(17):6296–6303
24. Mamun A, Souier MT, Mujibur Rahman SM, Al-Harthi SH, Munam A (2017) Miscibility and thermal stability of ethyl vinyl acetate and ethylene-octane copolymer blends. Polym Sci Ser A 59(3):397–404
25. Zhang X, Wang Z, Han CC (2006) Fine structures in phase-sepa-rated domains of a polyolefin blend via spinodal decomposition. Macromolecules 39(21):7441–7445
26. Wang H, Shimizu K, Hobbie EK, Wang Z-G, Meredith JC, Karim A, Amis EJ, Hsiao BS, Hsieh ET, Han CC (2001) Phase dia-gram of a nearly isorefractive polyolefin blend. Macromolecules 35(3):1072–1078
27. Wu T, Li Y, Zhang D-L, Liao S-Q, Tan H-M (2004) Study on the morphology and properties of metallocene polyethylene and ethylene/vinyl acetate blends. J Appl Polym Sci 91(2):905–910 28. Nishi T, Wang TT (1975) Melting point depression and
kinetic effects of cooling on crystallization in poly(vinylidene fluoride)-poly(methyl methacrylate) mixtures. Macromolecules 8(6):909–915
29. Eastmond G, Hocker H, Klee D (1999) Biomedical applications polymer blends. Springer, Berlin