1 INTRODUCTION
Failure of fluvial dykes often leads to devastating consequences in the protected areas. Various factors can trigger dyke breaching but overtopping flow is by far the most frequent cause of fail-ure. Nevertheless, the breaching mechanisms are still not well understood, and the prediction of the breach expansion and outflow hydrograph remains challenging.
So far, most experimental studies have focused on overtopping of dykes perpendicular to the main flow (e.g. Asghari Tabrizi et al. 2017, Müller et al. 2016, Schmocker & Hager 2012), while few analyzed fluvial dykes, i.e. dykes parallel to the main flow (Michelazzo et al. 2018, Wei et al. 2016). Recently, Rifai et al. (2017, 2018, 2020) performed fifty-four (54) laboratory tests of fluvial dyke breaching to assess the influence of the main channel inflow discharge, the down-stream boundary conditions, the floodplain tailwater, the channel size as well as the bottom erod-ibility and dyke material. All corresponding data are publicly available (Rifai et al. 2019). In contrast, the influence of the dyke geometry was never investigated systematically for the case of fluvial dykes.
Here, we present forty (40) new laboratory tests carried out to highlight the influence of the dyke upstream and downstream side slopes as well as the crest length on the breaching process of fluvial dykes made of non-cohesive sediments. A similar study was conducted by Müller et al. (2016) in the frontal configuration. Here, we specifically investigate the influence of the dyke geometry on the breach hydrograph. In particular, the growth rate of the breach discharge is crit-ical for real-world flood risk analysis and emergency planning, so that its analysis is of practcrit-ical relevance.
Breaching of fluvial dykes: influence of the dyke geometry
Vincent Schmitz
1, Sébastien Erpicum
1, Ismail Rifai
2, Kamal El Kadi
Abderrezzak
3, 4, Pierre Archambeau
1, Michel Pirotton
1, Benjamin Dewals
11 University of Liège, Hydraulics in Environmental and Civil Engineering (HECE), Liège, Belgium 2 Egis, Guyancourt, France
3 National Laboratory for Hydraulics and Environment (LNHE), EDF R&D -, Chatou, France 4 Saint Venant Laboratory for Hydraulics, Chatou, France
ABSTRACT: Fluvial dyke breaching is a major concern for flood risk management; but the mech-anisms of dyke breaching remain incompletely understood. We report here on forty (40) labora-tory tests performed to assess the influence of the geometry of dykes made of non-cohesive sedi-ments on the evolution of the breach discharge. Three parameters were systematically varied: the side slopes of the dyke and its crest width. Each geometric configuration was tested for several main channel inflow discharges. Results show that the breach discharge grows faster when the dyke volume becomes smaller and when the inflow discharge is increased. All geometrical pa-rameters were then lumped into a single non-dimensional parameter and a characteristic time was defined to quantify the growth rate of the breach discharge. For a given inflow discharge, the proposed characteristic time increases linearly with the non-dimensional parameter.
2 EXPERIMENTAL SETUP
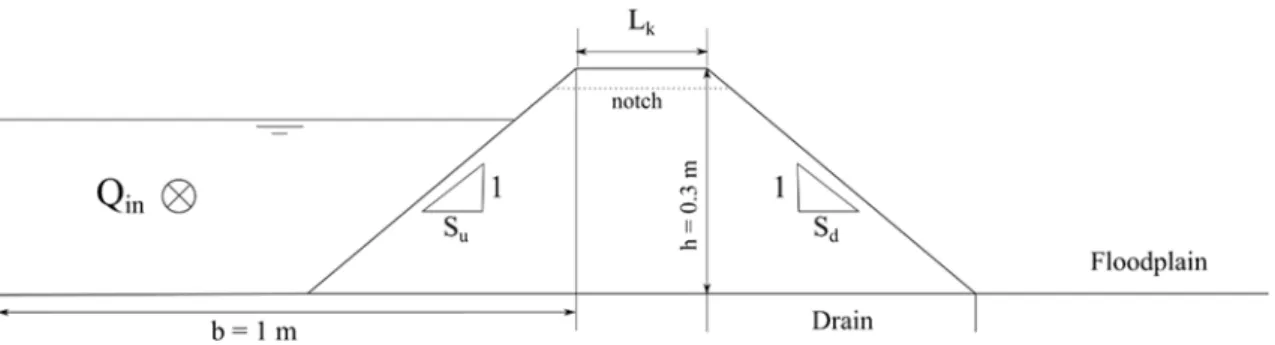
The laboratory setup is the same as that used by Rifai et al. (2017, 2018). It consists of a horizon-tal, straight main channel (10 m x 1 m) with a 3-meter-long lateral opening toward a floodplain (4.3 m x 2.5 m). Along the side opening, sand was gathered and compacted to build a trapezoidal shaped fluvial dyke, whose dimensions were systematically modified while keeping the dyke height constant (0.3 m). The dyke geometry is characterized by the upstream slope Su, the down-stream slope Sd and the crest length Lk (Figure 1).
A specific coating was applied on the surfaces of the main channel and the floodplain to ensure roughness continuity between those surfaces and the dyke. The bottom of the main channel and the floodplain were at the same level and elevated by 0.7 m compared to the outflow tanks. To avoid seepage flow, a drainage system was installed at the dyke bottom. Finally, a perforated plane followed by a tank were placed at the end of the main channel to control the downstream water level and to collect the main channel outlet flow.
Each geometrical configuration was tested with three different main channel inflow discharges, i.e. Qin = 25 l/s, 40 l/s and 55 l/s. The inflow discharge was kept constant and supplied at the upstream end of the main channel. During the filling phase, the water level rose in the main chan-nel. The perforated plate was tuned such that at equilibrium the water level corresponded to the dyke height. Before starting the tests, a 2-cm-deep and 10-cm-wide notch was created in the dyke crest to trigger breaching. Once the water level overtopped the notch, erosion and breaching de-veloped.
The water level in the main channel was measured and recorded in three locations using ultra-sonic sensors (accuracy of ± 1 mm). Similar sensors were used to monitor the water level in the outflow tank and in the drainage tank. The inflow discharge was measured using an electromag-netic flowmeter (accuracy of ± 4%). The breach discharge was determined from mass balance considering the main channel inlet and outlet flows, storage in the main channel, as well as the drainage flow.
Figure 1. Sketch of a dyke vertical profile, highlighting the main geometric parameters: upstream and downstream slopes (Su and Sd), dyke height (h) and crest length (Lk). The main channel width b is 1 m.
3 RESULTS
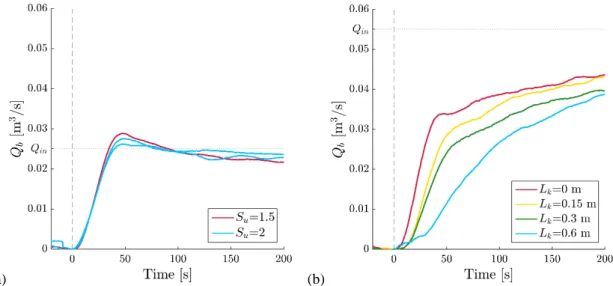
The focus has been set on the time evolution of the breach discharge, Qb. Figure 2 provides ex-amples of the observed hydrographs. Each subfigure highlights the influence of a particular geo-metrical parameter (the upstream slope and the crest length, respectively), while keeping the other parameters constant. Note that the time frame is limited to 200 s to highlight the impact of the geometry on the beginning of the breaching phenomenon.
The breach hydrographs depend highly on the inflow discharge, Qin. When Qin is relatively small, the breach discharge evolution exhibits an overshoot, which is damped when the dyke vol-ume is increased (e.g. when parameter Su is increased from 1.5 to 2). This trend is confirmed by the repeatability of the tests, as shown for Su = 2. Similarly, the overshoot fades when the inflow discharge rises, as can be seen in Figure 2b.
(a) (b)
Figure 2. Examples of measured hydrographs: (a) effect of varying the upstream dyke slope, with Qin = 25 l/s; (b) effect of varying the crest length, with Qin = 55 l/s.
Rifai et al. (2017) defined as “Stage 1” the phase of rapid breach deepening and widening, corresponding to a steep increase in breach discharge. It is generally followed by a phase of grad-ual breach widening (Stage 2). Figure 2b shows that during Stage 1, the growth rate of the breach discharge is considerably influenced by the dyke geometry: a larger crest length Lk (i.e. a higher dyke volume) leads to a substantially reduced growth rate of the breach discharge, which none-theless seems to tend in the long run toward a similar equilibrium breach discharge independently of the dyke geometry. As shown in Figure 2a, the dyke upstream slope has a similar influence, although its impact is less marked.
Here, we chose to characterize this growth rate through the time t50% needed for the breach discharge to reach half of its equilibrium value. Note that in Figure 2a, the breach discharge reaches an equilibrium value after about 150 s. In contrast, for higher inflow discharges in the main channel, the equilibrium breach discharge is reached much later (Figure 2b). Although not displayed in Figure 2b, our measurements extended over 400 to 600 s (depending on the test), which is sufficient to identify the equilibrium breach discharge even for Qin = 55 l/s. The time frame shown in Figure 2b was chosen to emphasize the influence of the geometric parameter Lk on Stage 1 of the breaching as well as on the beginning of Stage 2.
The results show that the characteristic time t50% systematically increases with the dyke volume. When plotted against each of the geometric parameters, namely Su, Sd and Lk, the time t50% varies essentially linearly.
In line with Müller et al. (2016), the various geometric parameters were lumped into a single non-dimensional unit volume parameter (μ), which writes:
) , 1 ( 2
μ
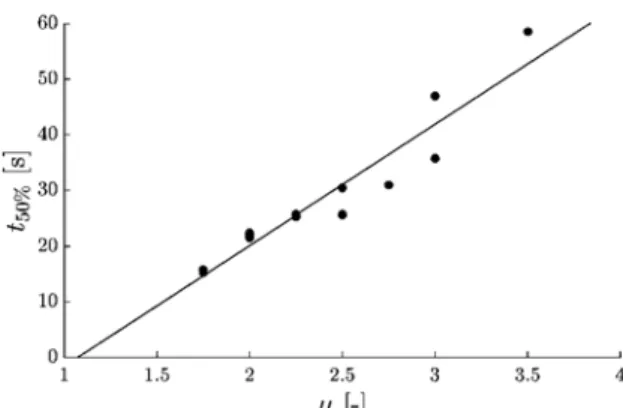
= + + k u d S S L h (1.1)Again, the time t50% follows a linear trend when plotted against μ (Figure 3). Note that the higher the inflow discharge in the main channel, the stronger the variations of t50% with the dyke geom-etry. The obtained slopes are equal to 12, 22 and 30 s for Qin = 25, 40 and 55 l/s, respectively.
Figure 3. Characteristic rising time t50% as a function of the non-dimensional volume parameter µ. The
inflow discharge is equal to 40 l/s.
4 CONCLUSION
Based on forty (40) new laboratory tests of fluvial dyke breaching, we highlighted the influence of the dyke geometry on the breach hydrograph. The growth rate of the breach discharge decreases when the dyke volume is increased as a result of a change in the dyke upstream or downstream slopes (Su or Sd) or in the crest length (Lk). The occurrence of an “overshoot” in the breach hydro-graph is also affected by the dyke geometric characteristics. Moreover, the influence of the dyke geometry tends to be magnified when the inflow discharge in the main channel is higher.
Results showed that the combined effect of the three studied geometrical parameters (Su, Sd and
Lk) can be lumped into a single non-dimensional parameter (µ), as introduced by Müller et al. (2016) for the frontal configuration. A characteristic time t50% was then selected to characterize the rate at which the breach discharge increases during each test. For a given inflow discharge, it appeared that t50% exhibits a positive linear dependency with the non-dimensional volume param-eter µ.
These findings make a valuable step toward a better understanding of the breaching dynamics of fluvial dykes. Additionally, future work will be focused on a non-dimensional expression for the characteristic time in order to generalize the outcomes of the study.
REFERENCES
Asghari Tabrizi, A., Elalfy, E., Elkholy, M., Chaudhry, M. H., & Imran, J. (2017). Effects of compaction on embankment breach due to overtopping. Journal of Hydraulic Research, 55(2), 236-247.
Michelazzo, G., Oumeraci, H., & Paris, E. (2018). New hypothesis for the final equilibrium stage of a river levee breach due to overflow. Water Resources Research, 54(7), 4277-4293.
Müller, C., Frank, P. J., & Hager, W. H. (2016). Dyke overtopping: effects of shape and headwater eleva-tion. Journal of Hydraulic Research, 54(4), 410-422.
Rifai, I., Erpicum, S., Archambeau, P., Violeau, D., Pirotton, M., El Kadi Abderrezzak, K., & Dewals, B. (2017). Overtopping induced failure of noncohesive, homogeneous fluvial dikes. Water Resources Re-search, 53(4), 3373-3386.
Rifai, I., El Kadi Abderrezzak, K., Erpicum, S., Archambeau, P., Violeau, D., Pirotton, M., & Dewals, B. (2018). Floodplain Backwater Effect on Overtopping Induced Fluvial Dike Failure. Water Resources Research, 54(11), 9060-9073.
Rifai, I., El kadi Abderrezzak, K., Erpicum, S., Archambeau, P., Violeau, D., Pirotton, M., & Dewals, B. (2019). Flow and detailed 3D morphodynamic data from laboratory experiments of fluvial dike breach-ing. Scientific data, 6(1), 53.
Rifai, I., El Kadi Abderrezzak, K., Hager, W., Erpicum, S., Archambeau, P., Violeau, D., Pirotton, M., & Dewals, B. (2020). Apparent cohesion effects on overtopping-induced fluvial dike breaching. Journal of Hydraulic Research. In press. https://doi.org/10.1080/00221686.2020.1714760.
Schmocker, L., & Hager, W. H. (2012). Plane dike-breach due to overtopping: Effects of sediment, dike height and discharge. Journal of Hydraulic Research, 50(6), 576-586.
Wei, H., Yu, M., Wang, D., & Li, Y. (2016). Overtopping breaching of river levees constructed with cohe-sive sediments. Natural Hazards and Earth system sciences, 16(7), 1541-1551.