Publisher’s version / Version de l'éditeur:
Vous avez des questions? Nous pouvons vous aider. Pour communiquer directement avec un auteur, consultez la
première page de la revue dans laquelle son article a été publié afin de trouver ses coordonnées. Si vous n’arrivez pas à les repérer, communiquez avec nous à [email protected].
Questions? Contact the NRC Publications Archive team at
[email protected]. If you wish to email the authors directly, please see the first page of the publication for their contact information.
https://publications-cnrc.canada.ca/fra/droits
L’accès à ce site Web et l’utilisation de son contenu sont assujettis aux conditions présentées dans le site LISEZ CES CONDITIONS ATTENTIVEMENT AVANT D’UTILISER CE SITE WEB.
Proceedings of the 13th Canadian conference on Building Science and
Technology, Winnipeg, MB, Canada, 10–13 May, 2011-05-10
READ THESE TERMS AND CONDITIONS CAREFULLY BEFORE USING THIS WEBSITE.
https://nrc-publications.canada.ca/eng/copyright
NRC Publications Archive Record / Notice des Archives des publications du CNRC :
https://nrc-publications.canada.ca/eng/view/object/?id=2cc197b2-23a5-4230-ab84-91ab617eeed1 https://publications-cnrc.canada.ca/fra/voir/objet/?id=2cc197b2-23a5-4230-ab84-91ab617eeed1
NRC Publications Archive
Archives des publications du CNRC
This publication could be one of several versions: author’s original, accepted manuscript or the publisher’s version. / La version de cette publication peut être l’une des suivantes : la version prépublication de l’auteur, la version acceptée du manuscrit ou la version de l’éditeur.
Access and use of this website and the material on it are subject to the Terms and Conditions set forth at
Field hygrothermal performance of retrofitted wood-frame wall
assemblies in cold climate
Maref, W.; Armstrong, M. M.; Rousseau, M.; Thivierge, C.; Nicholls, M.;
Ganapathy, G.; Lei, W.
http://www.nrc-cnrc.gc.ca/irc
Fie ld hygrot he rm a l pe rform a nc e of re t rofit t e d w ood-fra m e w a ll
a sse m blie s in c old c lim a t e
N R C C - 5 4 4 3 1
M a r e f , W . ; A r m s t r o n g , M . M . ; R o u s s e a u , M . ;
T h i v i e r g e , C . ; N i c h o l l s , M . ; G a n a p a t h y , G . ;
L e i , W .
M a y 2 0 1 1
A version of this document is published in / Une version de ce document se trouve dans:
13th Canadian Conference on Building Science and Technology Conference,
Winnipeg, Manitoba, Canada, May 10-13, 2011, pp. 1-13
The material in this document is covered by the provisions of the Copyright Act, by Canadian laws, policies, regulations and international agreements. Such provisions serve to identify the information source and, in specific instances, to prohibit reproduction of materials without
written permission. For more information visit http://laws.justice.gc.ca/en/showtdm/cs/C-42
Les renseignements dans ce document sont protégés par la Loi sur le droit d'auteur, par les lois, les politiques et les règlements du Canada et des accords internationaux. Ces dispositions permettent d'identifier la source de l'information et, dans certains cas, d'interdire la copie de
Field Hygrothermal Performance of retrofitted Wood-Frame
Wall Assemblies in Cold Climate
W. Maref
1, M. Armstrong
1, M. Rousseau
1, C. Thivierge
2,
M. Nicholls
1, G. Ganapathy
1and W. Lei
11- Building Envelope and Structure Program
Institute for Research in Construction, National Research Council Canada Bldg. M-24, 1200 Montreal Road, Ottawa, Ontario, Canada K1A 0R6 Corresponding Author ([email protected], phone: 613-993-5709)
2-FPInnovation, Division Forintek, Quebec, Qc, Canada
ABSTRACT
At NRC-IRC’s Field Exposure of Walls Facility (FEWF), a field monitoring study to compare the potential for wetting and drying in different wood-frame wall assemblies of different heat, air and vapour flow transmission characteristics was initiated in the Fall of 2008 and continued until the spring of 2009.
Two wall specimens consisted of R20thermal insulation in 2X6 wood-frame construction with an exterior wood-based sheathing, a sheathing membrane and vinyl lap siding. Of these two, one test specimen included a polyethylene air and vapour barrier on the interior side of the stud cavity, behind painted drywall, whereas the other test specimen did not include a polyethylene film. A third R20 2X6 wood-frame wall specimen included an R10 XPS insulating sheathing installed on the exterior of a wood-based sheathing panel and sheathing membrane, as well as a polyethylene air and vapour barrier on the interior side of the stud cavity.
Several factors could affect the wetting and drying of these wall assemblies: indoor relative humidity, air pressurization (depend on wind speed and direction), outdoor temperature and relative humidity, deficiencies that provide a path for air leakage as well as the HAM properties of each layer of the wall assemblies. The test specimens were subjected to a test protocol that permitted investigating the effects of these factors, From January to April 2009, the test specimens were challenged with exposure to outdoor wintertime weather of Ottawa (Canada) and different indoor relative humidity and air pressure levels, as well as incorporation of a “deficiency” (i.e., an opening) in the air and vapour barriers through which air might flow. Continuous monitoring of the relative humidity, temperature, pressure and liquid surface wetting took place at critical layers of the assemblies.
This paper presents and discusses the experimental findings obtained over the course of this study in terms of the hygrothermal response of the wall specimens in relation to their HAM properties, and conditions of exposure and to see the effect of retrofitting an existing wall by adding exterior insulation.
KEYWORDS
: Field assessment, Hygrothermal performance, retrofit, wood-frame,
energy, air leakage, moisture, condensation.
OBJECTIVES
The objective of this study is to compare and assess the hygrothermal response of different wood-frame wall assemblies: One of which integrated one energy retrofit measure using exterior thermal insulation, one traditional wood-frame construction with an exterior wood-based sheathing, a sheathing membrane and vinyl lap siding with air/vapour barrier polyethylene membrane, exposed to challenging climate conditions.”
T
EST SPECIMENSThree test specimens (W1, W2 and W3) were built side by side at the FEWF in fall 2009 (Figure 1). The test walls were of traditional 38 mm x 140 mm (2x6) wood frame construction (see Table 1). he specimens were 1780 mm (70 in.) high and included three stud cavities with an on centre spacing of 381 mm (15 in.), 406 mm (16 in.) and 381 mm (15 in.). At mid-height of the middle stud cavity of the test specimens, a 6 mm (1/4 in.) horizontal gap was introduced in the exterior sheathing to replicate an open horizontal joint between horizontal sheathing boards. Extruded polystyrene insulation (76 mm [3 in.]), and self-adhered air barrier/vapour barrier membranes were used to minimize lateral heat, air and moisture exchange between specimens as well as between specimens and the surrounding walls of the research house.
W1 featured typical RSI 3.5 (R20) 38 mm x 140 mm 2x6 wood-frame construction with an exterior wood-based sheathing, a sheathing membrane, vinyl lap siding, fibre glass batt insulation, an interior polyethylene air/vapour barrier and painted drywall. W2 featured the same construction as W1 with an added exterior layer of 50 mm (2 in) R10 XPS insulating sheathing (joints not taped) installed on the exterior of the wood-based sheathing and sheathing membrane. W3 was also similar to W1, however, with no polyethylene film behind the painted drywall.
Note regarding Wall 3
Results from Wall 3 will not be discussed in this paper, since Wall 3 underwent extreme moisture exposure prior to the experiment. Moisture data results cannot be attributed with confidence to the lack of air/vapour barrier in Wall 3. Results will focus on Walls W1 and W2 mainly.
Figure 1, Figure 2, and Table 1 describe the layout and composition of the test specimens.
Figure 2: Horizontal cross section of the three wall specimens Exterior Interior W1 Vinyl siding Sheathing membrane OSB sheathing board Stud cavity with glass fibre batt insulation (RSI 3.5 [R20]) Air/vapour barrier Painted drywall W2 Vinyl siding XPS insulation Sheathing membrane OSB sheathing board Stud cavity with glass fibre batt insulation (RSI 3.5 [R20]) Air/vapour barrier Painted drywall W3 Vinyl siding Sheathing membrane OSB sheathing board Stud cavity with glass fibre batt insulation (RSI 3.5 [R20]) No Air/vapour barrier Painted drywall
TABLE 1: DESCRIPTION OF THE SPECIMENS – 2008/09 W1
38mm X 140mm (2x6) insulated wood-frame with no
exterior insulating sheathing
W2
Lower Air & Vapour Permeance Exterior Insulating Sheathing
W3
38mm X 140mm (2x6) insulated wood-frame with no
exterior insulating sheathing and no Poly
Vinyl siding Vinyl siding Vinyl siding
50mm (2 in.) XPS rigid foam insulation, 609mm (24 in.) wide sections installed horizontally, square edge
Sheathing membrane (spun-bonded olefin)
Sheathing membrane (spun bonded olefin)
Sheathing membrane (spun-bonded olefin)
11mm OSB wood-sheathing (with a 6 mm horizontal gap at mid-height)
11 mm OSB wood-sheathing (with a 6 mm horizontal gap at mid-height)
11mm OSB wood-sheathing (with a 6 mm horizontal gap at mid-height)
38mmx140mm (2X6) nominal stud cavity with RSI 3,5 (R20) glass fiber insulation batts
38mmx140 mm (2X6) nominal stud cavity with RSI 3.5 (R20) glass fiber insulation batts
38mmx140mm (2X6) nominal stud cavity with RSI 3,5 (R20) glass fiber insulation batts Polyethylene film as an
air/vapour barrier
Polyethylene film as an air/vapour barrier
No Polyethylene film
Painted drywall Painted drywall Painted drywall
T
ESTINGM
ETHODOLOGYThe test specimens were instrumented with different sensors to characterize heat, air and moisture transfer across the specimens, at locations selected for their potential of deterioration or beneficial effect (see the following section on instrumentation). On the exterior, the specimens were exposed to naturally occurring microclimate at the site on the exterior (Ottawa has on average 4600 18°C heating degree days) for three seasons (Fall, Winter, Spring). On the interior, the specimens were exposed to series of indoor controlled conditions to create challenging humidity and pressure levels for the test specimens. The specimens were subjected to deficiencies throughout several sets of indoor conditions. The deficiencies included a 3 mm slit in the poly air/vapour barrier and gypsum board the width of the stud cavity 260 mm above the bottom plate, and an open gap at mid height in the OSB sheathing board and exterior insulation boards (when applicable). This formed an air leakage path from indoor to outdoor in the central stud cavity.
I
NSTRUMENTATIONlayers of the wall assembly. The middle stud cavity of each wall specimen was designed to be the focus of the study, with the stud cavities on either side acting as a buffer zone. For this reason the majority of instrumentation was located in the middle stud of each wall, as shown in Figure 3 for Wall 1. All sensor data was recorded at a 15-minute interval. Surface Temperatures were measured with an accuracy of +0.1°C, while air relative humidity and Temperatures (RH&T) measurements were accurate to +3% and +1% for pressure measurements. Pressure sensors installed in the test specimens measured the differential air pressure between the pressure taps, at locations shown in Figure 5, and the ambient room. Pressure taps were located in the top half of the middle stud cavity, 254 mm (10 in.) above the gap in the exterior sheathing.
FIGURE 3: Layout of the instrumentation for W1 (W2 and W3 were similar) Interior
Exterior
Heat Flux Transducer (for W2 only) Instrumentation - Plan View
Air/vapour barrier Drywall
In addition to the sensors shown in Figure 5, moisture detection tape (Vokey et al., [1]; Armstrong & al. [2]) was included at a number of layers in the assembly to detect both surface liquid and when appropriate, the moisture content of components. The moisture detection tapes were deployed in locations most likely to experience the presence of moisture, based on the experimental design. These were at different heights along the interior and exterior faces of the sheathing board, on the bottom portions of the lumber making up the stud cavity (i.e. bottom plate and vertical sides of studs), and on the exterior face of the sheathing membrane (Figures 6). Resistance measurements from the moisture detection tapes were recorded every 10 minutes.
This paper primarily presents the results from the relative humidity and temperature (RH and T) sensors (shown as X’s in Figures 3 and 4), the pressure sensors (shown as triangles in Figure 3) and the values of electrical resistance obtained from the moisture detection tape (Figure 4). Additional details on instrumentation and wall construction can be found in Maref et al. (2010) [3], Armstrong et al. [4] and Maref et al [5]
FIGURE 4: LAYOUT OF MOISTURE DETECTION STRIPS AND INSTRUMENTATION ON THE INTERIOR FACE OF THE OSB (REFER TO FIGURE 2 FOR LEGEND)
RH and T sensors (air)
Sheathing membrane Stud cavity with glass fibre insulation OSB Vinyl siding
Moisture Pins
T sensors (surface) Air Pressure sensor
381 mm (15 in.) 406 mm (16 in.) TAPE D1/D2 TAPE C 508 mm (20 in.) TAPE B1/B2 TAPE A 432 mm (17 in.) (W2 only) 1778 mm (70 in.) 406 mm (16 in.) opening in air/vapour barrier gap in sheathing 267 mm (10.5 in.)
T
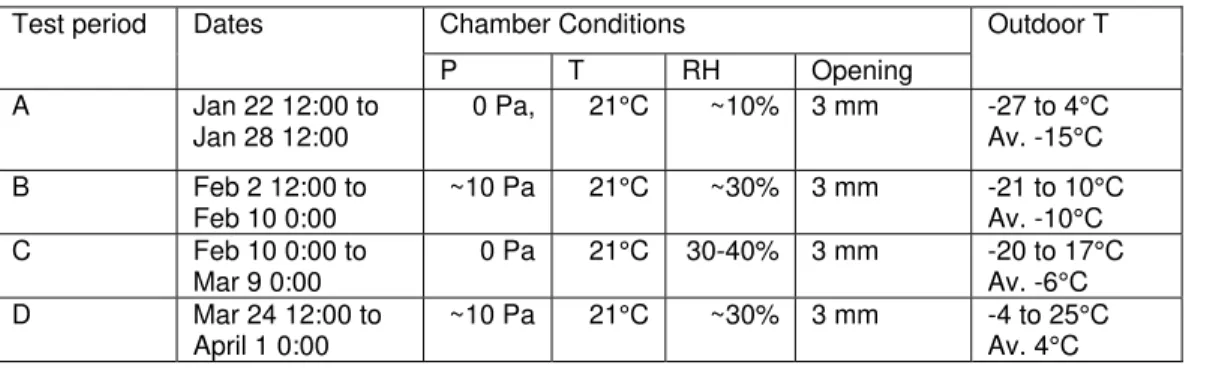
ESTING CONDITIONSFour periods were chosen for detailed evaluation from the experiment. Details of these four Test periods are listed in Table 2. Further details of the chamber and exterior conditions are shown in Figure.
Table 2. Details of the four Test periods
Test period Dates Chamber Conditions Outdoor T
P T RH Opening A Jan 22 12:00 to Jan 28 12:00 0 Pa, 21°C ~10% 3 mm -27 to 4°C Av. -15°C B Feb 2 12:00 to Feb 10 0:00 ~10 Pa 21°C ~30% 3 mm -21 to 10°C Av. -10°C C Feb 10 0:00 to Mar 9 0:00 0 Pa 21°C 30-40% 3 mm -20 to 17°C Av. -6°C D Mar 24 12:00 to April 1 0:00 ~10 Pa 21°C ~30% 3 mm -4 to 25°C Av. 4°C
EXPERIMENTAL RESULTS
Experimental results are presented in the following sections by two Test periods as stated in Table 2.
Test period A
During Test period A, the three wall specimens were exposed to cold outdoor temperatures. Indoor chamber conditions were held at 21°C, with no generated humidity or pressurization. Details of the conditions during Test period A are shown in Figure 5.
‐40 ‐30 ‐20 ‐100 10 20 30 40 50 60 70 80 90 100 22 ‐Ja n‐ 09 12 :0 0 23 ‐Ja n‐ 09 0:0 0 23 ‐Ja n‐ 09 12 :0 0 24 ‐Ja n‐ 09 0:0 0 24 ‐Ja n‐ 09 12 :0 0 25 ‐Ja n‐ 09 0:0 0 25 ‐Ja n‐ 09 12 :0 0 26 ‐Ja n‐ 09 0:0 0 26 ‐Ja n‐ 09 12 :0 0 27 ‐Ja n‐ 09 0:0 0 27 ‐Ja n‐ 09 12 :0 0 28 ‐Ja n‐ 09 0:0 0 28 ‐Ja n‐ 09 12 :0 0 Te m p e ra tu re (° C ), RH (% )
Outdoor and Chamber Conditions Outdoor TemperatureOutdoor RH
Test Period A Chamber Temperature Chamber RH
Figure 5: Test period A: Outdoor and chamber conditions
Pressure
The differential pressure was measured from the exterior of the wall to the room and from the stud cavity to the room. The resulting plot is shown in Figure 6. Spikes in the pressure data were caused by wind effects. During Test period A, the pressure at the exterior was almost always
positive, and higher than the pressure in the stud cavity. Thus, the wall was in a state of infiltration throughout Test period A.
0 2 4 6 8 10 12 14 16 22 -J an -0 9 0: 0 0 23 -J an -0 9 0: 0 0 24 -J an -0 9 0: 0 0 25 -J an -0 9 0: 0 0 26 -J an -0 9 0: 0 0 27 -J an -0 9 0: 0 0 28 -J an -0 9 0: 0 0 29 -J an -0 9 0: 0 0 D e lt a P in Pa
Differential Pressure Across Wall 1
Test Period A
Pressure at Exterior Pressure in stud cavity
Figure 6. Test period A: Differential pressure across Wall 1
Temperatures
The average temperature data from Test period A are shown in Figure 7. Temperatures at the exterior and interior surface of the sheathing board of Wall 2 were warmer than Wall 1 due to the exterior insulation. The average dew point temperature of chamber air (21°C, 10% RH) during this period was ~-9°C. Despite the low humidity in the chamber, the average temperature of the sheathing board of Wall 1 was below the dew point. In Wall 2, the exterior layer of XPS kept the average temperature at the exterior and interior surface of the sheathing board of Wall 2 above the dew point temperature of chamber air.
Test period A: Wall cross section showing average temperatures at interstitial locations
-20 -15 -10 -5 0 5 10 15 20 25 - 6 - 1 4 9 1 4 T e m p er a tu re ( °C ) W1 W2 - XPS
DewPoint of Chamber Air
vi n y l si d in g sh ea th in g m em br an e OS B st u d ca vi ty w it h fi ber gl as s in s u la ti on a ir / v a p o u r b a rr ie r (W 1 & W 2 o n ly ) dr y w a ll in s u la ti o n ( W 2 ) BOTTOM Figure 7:
Moisture
The average moisture content of air at various interstitial locations is plotted in Figure 8. The moisture content of air in the stud cavity near the surface of the OSB was lower on average than the moisture content of chamber air. This is consistent with the predominant infiltration of dry exterior air during Test period A. Wall 2 showed higher moisture content of air at both the exterior and interior of the OSB, compared to Wall 1. This could potentially be attributed to the low permeability of the XPS insulation reducing the infiltration of dry exterior air. Despite the air being drier in the cavity than chamber air, air at the interior surface of the OSB approached saturation levels in Wall 1 (Figure 9). The liquid detection strips of Wall 1 and Wall 2 didn’t show sign of wetness.
od A: Wall cross section showing average humidity ratio at interstitial locations
Figure 9- Test period A: Relative humidity at the exterior and interior of the sheathing board Figure 8: Test peri
0 0.5 - 6 - 1 4 9 1 4 Hum 1 ty Ra 1.5 2 2.5 id i ti o (gv /k g d a ) W1 W2 - XPS vi n yl si d in g s h e a th in g me mb ra n e OS B s tu d c a v ity w ith fi ber gl ass i n su lat ion a ir / v a p o u r b a rr ie r (W1& W 2 o n ly ) dr y w al l in s u la tio n ( W 2 ) BOTTOM Test Period A 0 10 20 30 40 50 60 70 80 90 100 22-J an-09 0: 00 23-J an-09 0: 00 24-J an-09 0: 00 25-J an-09 0: 00 26-J an-09 0: 00 27-J an-09 0: 00 28-J an-09 0: 00 29-J an-09 0: 00 Re la ti v e H u m id ity (% )
Relative Humidity at Sheathing Board
Test Period A
W1 - Interior of sheathing (top) W1 - Exterior of sheating (top) W2 - Interior of sheathing (top) W2 - Exterior of sheathing (top) Chamber Humidity
Test pe
During Test period B, the wall spe exposed to cold outdoor temperatures. Indoor chamber conditions were held at 21°C, with ~30% generated humidity and ~10 Pa pressurization. Details of the conditions during Test period B are shown in Figure 10. The target for humidification in Test period B was 30% While this was maintained throughout the majority of the test period, there were periodic dips in humidity caused by interaction of the humidification system with chamber pressurization – causing the water supply to the humidifiers to stop occasionally. The spike in humidity on February 5th was caused by troubleshooting of the humidification system.
Figure 10‐ Test period B: Outdoor and Chamber conditions
Pressure
The differential pressure across Wall 1 is plotted in Figure11. Pressure conditions for Wall 2 were similar to those of Wall 1. During Test period B, the pressure in the stud cavity exceeded the pressure at the exterior of the wall for the majority of the test period, due to the applied chamber pressure. Thus, the walls were predominantly in a state of exfiltration, forcing humid chamber air into the wall assembly.
riod B
cimens were again
RH. ‐40 ‐30 ‐20 ‐10 0 10 2‐ Fe b‐ 09 12 3‐ Fe b‐ 09 0: 0 3‐ Fe b‐ 09 4‐ Fe b‐ 09 4‐ Fe b‐ 09 5‐ Fe b‐ 09 5‐ Fe b‐ 09 6‐ Fe b‐ 09 6‐ Fe b‐ 09 7‐ Fe b‐ 09 7‐ Fe b‐ 09 8‐ Fe b‐ 09 8‐ Fe b‐ 09 9‐ Fe b‐ 09 9‐ Fe b‐ 09 10 ‐Fe b‐ Te m p e ra t 20 30 u re (° 40 50 80 90 100 :00 0 12 :00 0: 0 0 12 :00 0: 0 0 12 :00 0: 0 0 12 :00 0: 0 0 12 :00 0: 0 0 12 :00 0: 0 0 12 :00 09 0: 0 0 C ), RH Outdoor and Chamber Conditions Test Period B Outdoor Temperature Outdoor RH Chamber Temperature Chamber RH 60 70 (% )
0 2 4 6 8 10 12 14 16 0 2-F e b-09 0: 00 0 3-F e b-09 0: 00 0 4-F e b-09 0: 00 0 5-F e b-09 0: 00 0 6-F e b-09 0: 00 0 7-F e b-09 0: 00 0 8-F e b-09 0: 00 0 9-F e b-09 0: 00 1 0-F e b-09 0: 00 1 1-F e b-09 0: 00 D e lt a P in P a
Differential Pressure Across Wall 1 Test Period B
Pressure at Exterior Pressure in stud cavity
Figure11: Test period B: Differential pressure across Wall 1
emperatures
he average temperature data from Test period B are shown in Figure12. The average dew point of chamber air during this period was ~0°C. As in Test period A, the average
Figure12‐ Test period B: Wall cross section showing average temperatures at interstitial locations
T
T
temperature
temperature of the sheathing board of Wall 1 was below the dew point, while the Wall 2 sheathing board was kept above the dew point temperature by the XPS insulation.
-10 -5 0 5 10 15 20 25 - 6 - 1 4 9 1 4 T e m p e rat u re ( °C ) W1 W2 - XPS
DewPoint of Chamber Air
vi n yl si d in g s h eat h ing m e m br an e OS B s tu d c a v ity w ith fi b e rg la ss i n su la ti on a ir / v a p o u r b a rr ie r (W 1& W 2 on ly ) dr y w al l in s u la ti on ( W 2) BOTTOM Test Period B elevation viewed from interior
Moisture
The average moisture content of air at various interstitial locations is plotted in Figure 13. This figure shows that humid air entered the stud cavity of both walls during Test period B. Air in the stud cavity of Walls 1 at the interior surface of the OSB was on average 1.5 gv/kgda wetter than
exterior air. Air at this same location in Wall 2 was on average 2.5 gv/kgda wetter than exterior
air. Again, this can likely be attributed to the low air/vapour permeability of the XPS insulation. The high moisture content of air in the stud cavity, and the low surface temperatures in Wall 1 lead to favourable conditions for condensation on the interior surface of the OSB. Figure 14 shows the relative humidity of air at this surface. In Wall 1, relative humidity levels reached saturation (100%) on multiple occasions during Test period B. The liquid detection strips confirmed that condensation did occur on the interior surface of the OSB. Figure 15 shows that the resistance of liquid detection strips dropped in response to liquid at the base of the OSB in Wall 1. Similar trends in liquid detection were also seen at the bottom plate. Wall 2 did not experience the same wetting as Wall 1. Wetting was only detected briefly (maximum of 8 hours) during the spike in chamber humidity on February 5th. At this time, chamber humidity exceeded 70% RH, humidity of air at the interior of the sheathing membrane approached saturation (Figure 14), and dips in resistance of the liquid detection strips (associated with wetting) were seen at the interior of the OSB, and at the bottom plate.
Figure 13‐ Test period B: Wall cross section showing average humidity ratio at interstitial locations 0 0.5 1 1.5 2 2.5 3 3.5 4 a ti o (g v /k g 4.5 - 6 - 1 4 9 1 4 H u m id ity R da ) W1 W2 - XPS v iny l s id ing sh eat h ing m em br ane OS B st u d ca vi ty w it h fi ber gl as s i n su lat ion ai r / vapou r bar ri er (W 1& W 2 on ly ) dr yw al l in su lat ion ( W 2) BOTTOM
Test Period B
elevation viewed from interior0 20 40 60 80 100 R e la ti v e Hu m id ity (% )
Relative Humidity at Sheathing Board Test Period B 2/ 2 /20 09 0 :00 2/ 3 /20 09 0 :00 2/ 4 /20 09 0 :00 2/ 5 /20 09 0 :00 2/ 6 /20 09 0 :00 2/ 7 /20 09 0 :00 2/ 8 /20 09 0 :00 2/ 9 /20 09 0 :00 2/ 1 0/ 2 00 9 0: 0 0 2 /1 1/ 200 9 0: 0 0
W1 - Interior of sheathing (bottom) W1 - Exterior of sheating (bottom) W2 - Interior of sheathing (bottom) W2 - Exterior of sheathing (bottom) Chamber Humidity Figure 14‐ Test period B: Relative humidity at the exterior and interior of the sheathing board Figure 15‐ Liquid detection at the interior of the OSB at location 13
0 20000 40000 60000 80000 100000 120000 29 -J a n -09 31 -J a n -09 2-F e b-0 9 4-F e b-0 9 6-F e b-0 9 8-F e b-0 9 1 0 -F e b -0 9 1 2 -F e b -0 9 1 4 -F e b -0 9 1 6 -F e b -0 9 1 8 -F e b -0 9 R e si s tan c e ( k Ω )
Liquid Detection Tape at Bottom Plate Sensor 17L
Wall 1 Wall 2
O
SERVATIONSThe test walls responded in different ways to the test conditions.
Temperatures at the exterior and interior surface of the sheathing board of W2 were warmer than W1 due to the exterior insulation. The exterior layer of XPS kept this average temperature above the dew point temperature of chamber air.
Without subjecting the walls to pressure, both wall systems were predominately in a state of infiltration (due to wind effects and stack effect). As a result, the moisture content of air in the stud cavity near the surface of the sheathing board was lower than the moisture content of chamber air. W2 with XPS showed higher moisture content of air at both the exterior and the interior of the sheathing board compared to W1. This could potentially be attributed to the low permeability of the XPS insulation reducing the infiltration of dry exterior air.
When subjecting indoor conditions of humidity and pressure, both wall systems were predominately in a state of exfiltration. The average moisture content of air in the stud cavity near the surface of the sheathing board was high. This shows that humid air entered the stud cavity of all the three walls during that period. W2 showed higher moisture content than Wall W1. This was due to low permeability of the XPS insulation reducing the exfiltration of the moist air to the exterior. The high moisture content of air in the stud cavity and low temperatures in W1 lead to favourable condition for condensation on the interior surface of OSB. W2 didn’t experience the same wetting as Wall W1. The wetting in W2 was only detected briefly during a high humidity event, at all other times sheathing board surface temperatures were above the dew point of stud cavity air.
This study showed that the properties of the thermal insulation installed on the exterior of the wood-frame
g e
test specimen that experienced wintertime interstitial wetting had dried by the spring without apparent damage. In the study the wetting was short-lived as the right conditions for condensation ended up being in place for a few days at the time. That amount of wetting was
the wall assembly in the study.
C
ONCLUDING REMARKS The study showed that the properties of the thermal insulation installed on the exterior of the wood-frame wall cavity affects the temperature, vapour and air pressure gradients, and will consequently affect the wetting and drying potential of the assembly.
The study showed that air leakage through an assembly was a potent factor in transporting moisture to and from enclosed cavities. When combined with chamber pressurization forcing exfiltration of humid chamber air, the deficiencies in the air/vapour barrier and sheathing board created a path for moisture to enter and accumulate in the wall cavity (Test period B). The study showed that in cold conditions (such as Test period A), the components outboard
of the insulated stud cavity of a standard wood frame wall can be at temperatures below the dewpoint of unhumidified indoor air. Condensation can be avoided at these locations through use of exterior insulation (as in W2), maintaining infiltration conditions, or avoiding deficiencies in the air/vapour barrier.
The wall assembly with exterior insulation was less prone to interstitial condensation than similar walls without such exterior thermal lining. The study showed that the addition of an exterior insulating sheathing raised the temperature of the stud cavity aterials and can maintain it above the dew point of interior air, thus reducing the likelihoo and duration ofintersti ery cold, or the
B
wall cavity of Wall W2 affected the temperature, vapour and air pressure radients, and will consequently affect the wetting and drying potential of the assembly. Th
well handled by
m d tial condensation, within limits. When the outdoor climate was v
was at high humidity levels (for example the 70% RH in this experiment), the ion potential was reduced
.
indoor climatebenefit of the insulating sheathings on reducing the condensat
REFERENCE
[1] Vokey, D.; Nelson, C.; Friesen, C. 2006. “A simple and useful method to detect and pinpoint envelope failures during field testing of gypsum sheathed wall.” Proceedings of the Third
International Building Physics Conference, August 27-31, 2006. Montreal, Canada. pp. 419-424.
[2] Armstrong, M.M., Maref, W.; Rousseau, M.Z.; Lei, W.; Nicholls, M. 2009, “A field monitoring study of interstitial condensation in wood-frame walls in cold climate 12th Canadian Conference on Building Science and Technology (Montréal, Quebec 2009-05-06) pp. 1-12.
[3] Maref, W. et al. 2010, In Press. Evaluating the effects of Two Energy Retrofit Strategies for
Housing on the Wetting and Drying Potential of Wall Assemblies, Institute for Research in
Construction, National Research Council Canada.
[4] M. Armstrong, W. Maref, M. Rousseau, W. Lei and M. Nicholls, “A Field Monitoring Study of Interstitial Condensation in Wood-Frame Walls in Cold Climate, Proceedings of the 12th Canadian Conference on Building Science and Technology (12th CCBST), Montreal, Quebec, Canada, May 6-8, 2009. PP. 217-282.
[5] Maref, W.; Armstrong, M. and Rousseau, M.Z. Workshop on Moisture Management and Energy Rating in Building Envelopes / Part I : Characterization of Hygrothermal Performance of Wall Systems 12th Canadian Conference of Building Science and Technology (Montreal, QC
http://www.nrc-cnrc.gc.ca/obj/irc/doc/pubs/oral987.pdf
ACKNOWLEDGMENT
The authors wish to thank Anil Parekh at Natural Resources Canada (NRCan), Silvio Plescia at Canada Mortgage and Housing Corporation (CMHC) and Constance Thivierge at FPInnovations- Division Forintek for contributing funding for this project. Funding from NRC has enabled
NRC-C to build, operate and maintain a state-of-the-art Field Exposure of Walls facility
IR .
r thanks are also extended to NRC-IRC colleagues Robert Berzins, Khaled Abdulghani and cious technical contribution.
Ou

![Figure 2: Horizontal cross section of the three wall specimens Exterior Interior W1Vinyl sidingSheathing membraneOSB sheathing boardStud cavity with glass fibre batt insulation (RSI 3.5 [R20])Air/vapour barrierPainted drywallW2Vinyl sidingXPS insula](https://thumb-eu.123doks.com/thumbv2/123doknet/14133953.469435/6.918.146.820.136.292/horizontal-specimens-exterior-interior-sidingsheathing-membraneosb-insulation-barrierpainted.webp)