Science Arts & Métiers (SAM)
is an open access repository that collects the work of Arts et Métiers Institute of
Technology researchers and makes it freely available over the web where possible.
This is an author-deposited version published in: https://sam.ensam.eu
Handle ID: .http://hdl.handle.net/10985/19615
This document is available under CC BY-NC-ND license
To cite this version :
William BRIAND, Marc REBILLAT, Mikhail GUSKOV, Nazih MECHBAL - Damage imaging post processing for delamination size assessment of CFRP aeronautic structures - In: European Workshop on Structural Health Monitoring 2020, Italie, 2020-07 - Proceedings of the European Workshop on Structural Health Monitoring 2020 - 2020
Any correspondence concerning this service should be sent to the repository Administrator : [email protected]
Damage imaging post processing for delamination
size assessment of CFRP aeronautic structures
William Briand, Marc R´ebillat, Mikhail Guskov, and Nazih Mechbal
Arts et Metiers Institute of Technology, CNRS, CNAM, PIMM, HESAM Universit´e, F-75013 Paris, France
Abstract. Thanks to their high strength to mass ratio, composite materials are now widespread in the aerospace industry. Nevertheless, this type of material is sub-ject to internal damages like delamination. In order to detect and localize these damages, robust and precise Structural Health Monitoring algorithms exist for this purpose and have been validated experimentally. However, in order to avoid struc-tures catastrophic failures and to estimate their residual life, there is still a huge need of reliable damage size assessment methods. In this paper, a damage quantification method is proposed. This strategy is based on the extraction of a damage size sen-sitive feature computed from damage imaging results. Here damage imaging stands for methods that use ultrasonic Lamb waves-based map of damage localization like-lihood index. This feature is extracted from each labelled example of a training set in order to infer a mathematical model used to predict the area of a delamination of unknown damages. The proposed method is successfully validated on experimental data carried out on CFRP plate samples equipped with a piezoelectric transducers network.
Keywords: Structural Health Monitoring · Quantification · Composite · Guided waves · Piezoelectric
1
Introduction
In order to reduce their maintenance costs, airlines are increasingly interested in predictive maintenance systems. This type of maintenance consists of immobilizing an aircraft once a condition indicator exceeds a threshold, rather than wait for a pre-determined period of use. This indicator reflects the actual state of degradation of the monitored structure. To build this indicator, it is necessary to know the size of the detected damages to be able to estimate the remaining life of the structure. This is why there is a strong need for reliable and robust quantification algorithms in SHM
field. In this paper, a new quantification method based on post-processing of images resulting of localization algorithms is proposed. The localization methods of interest here are the ones based on Lamb waves propagation by means of a piezoelectric elements network. Some attempts have already been carried out to post-process Lamb wave based imaging results for damage size quantification purposes. In [3], the authors proposed a data-driven approach using a Convolutional Neural Networks trained on a dataset composed of images generated by SFE method and a localization algorithm called Excitelet [8]. In this dataset, an aluminium plate contains a hole with various sizes and positions. Once the model performs well on this training set, it is applied on numerical and experimental unknown datasets. Another quantification approach aims to assess the size of a crack and a hole [7]. It consists in localizing the tips of a crack and thus assessing its length, or localizing the edge of the hole and estimating its diameter using two different imaging techniques. The method is applied on an aluminium plate. In [11], the authors developed an algorithm based on Time of Arrival (ToA) localization to assess the size of an impact [11]. Each tip of the damage is localized and the damage size is computed as the area of the polygon formed by these tips. An application have been made on composite plate with data from simulation and from experiments.
However, in these articles only one localization method is applied. Thus the ap-plications are done on simple aluminium plate with artificial damage and rarely on CFRP material with delamination. Moreover, there is no method in the literature that can post-process images from different localization techniques and compare the results with each other. The approach proposed in this paper consists in monitor-ing the growth of a damage based on the computation of a new damage index that varies in a monotonic manner with the size of the damage. This feature is extracted from images coming from damage localization methods: it corresponds to the area of the region surrounding the estimated position of damage where the damage index is higher than a threshold. This damage index is computed for each element of a train-ing set composed of previous damaged states of the structure. Then a data-driven model is built with a polynomial regression. Finally, the size of unknown damages is assessed. Results of this method are compared for four different damage local-ization techniques: Time of Arrival (ToA) and Difference Time of Arrival (TDoA) [1], Delay And Sum (DAS) [6] and Reconstruction Algorithm for the Probabilistic Inspection of Damage (RAPID) [10]. As more and more aeronautic structures are made of composite materials, a reliable quantification method must be tested on this type of material. The proposed method is successfully validated on experimental data coming from CFRP plate samples equipped with a piezoelectric transducers network and undergoing fatigue solicitations. A method to automatically select its own parameters is proposed. Prediction results with a mean error of 6% are obtained on experimental results with the proposed approach.
In the following, the feature used for for the post-processing method is explained in details. Then proposed approach is explained in details. Finally, the post-processing method is successfully validated on experimental data of fatigue tests from NASA prognostics data repository with delamination close to real life damage.
2
Theory
2.1 HDLI feature
The new damage index proposed in this paper is based on post-processing of localiza-tion results. Typically, a localizalocaliza-tion method takes raw signal from piezoelectric sen-sors as input, and process them to obtain a map of the structure where each point is associated with a value of a particular Damage Localization Index (DLI). The higher this index is, the higher is the likelihood of finding a damage at this position. In this article, we will compare the performance between different common localization algorithms: Time of Arrival (ToA) and Difference Time of Arrival (TDoA) [1], Delay And Sum (DAS) [6] and Reconstruction Algorithm for the Probabilistic Inspection of Damage (RAPID) [10].
The idea is to compute a feature based on the previously mentioned maps that varies in a monotonic manner with the damage size. Thus the damage index is defined as this area surrounding the estimated damage position where the DLI is higher than a threshold. The assumption made here is that the area of this region depends on the actual size of the damage. To perform the computation of the area considered, a threshold is applied to the map giving a binary image where only the region with a DLI higher than the threshold can be identified. Then an image segmentation algorithm selects the region surrounding the estimate damage position and computes the area A of the region. Finally, the feature is defined as the ratio between the area calculated and the total area of the structure Atot. This damage index is called High Damage Localization Index (HDLI):
HDLI = A
Atot (1)
2.2 Damage quantification model
The proposed approach aims to estimate the size of an unknown damage. To per-form this task, a quantification model is built based on the HDLI feature previously described. This model is data-driven thus the workflow is divided into a learning step and a prediction step.
The learning set is composed of N damage cases labeled with the associated damage size {(S1, s1), . . . , (SN, sN)}. Siis the set of signals from the transducers for the ith damage case and si is the corresponding size of the damage.
Then each example of this dataset is processed with a given localization method, resulting a new dataset {(I1, s1), . . . , (IN, sN)} where Ii is the image returned by the localization algorithm. The HDLI feature hi is computed for each image, resulting in the learning dataset X = {(h0, s0), . . . , (hN, sN)} that will be used to train the regression model. HDLI values close to 0 are discarded to improve the sensitivity of the method for large damages since the purpose is to extrapolate a model toward higher damage sizes. In the following, H ∈ RN and S ∈ RN will denote respectively the vector of HDLI features and the vector of damage sizes of all N training samples. A polynomial regression of order d is then performed on X.
ˆ S = d X j=0 βjHj (2)
In Eq. 2, d is the degree of the polynomial, ˆS ∈ RN is the vector of estimated damage size and Hj ∈ RN is the vector of jth power of the components of H. To avoid over fitting of the regression problem, a variation of classic linear regression called ridge regression is used here [2]. It consists in adding a penalty term λ on the parameters βj in the ordinary least square regression problem in order to control for their amplitude. The optimal λ value is chosen to minimize the error over the learning set using a gradient descent algorithm. To avoid overtraining of the model on the learning data, a crossvalidation technique called Leave-One-Out is used.
One must chose a value for the degree of the polynomial. Any degree high enough will yield to the same regression model because coefficients relative to high degree terms will be close to zero thanks to the regularization. Throughout this paper, d is set to 8.
The data-driven model built earlier is then used to predict the size of an unknown damage. The first step is to process the signal with the damage localization method to get a DLI image of the structure. Then the HDLI htest is computed from this image. The corresponding size stest is finally estimated using the size quantification model previously inferred.
2.3 Methodology
The overview of the method’s steps are:
Step 1 Get signals from each transducer on the plate.
Step 2 Process the signals corresponding to the ith case with one of the damage lo-calization algorithm described earlier. The result is a DLI image of the structure. Step 3 Compute the HDLI associated with the image i.
Step 5 Perform the polynomial regression model using the training set of HDLI previously computed and the known damage size of the corresponding damage case.
Step 6 Compute the HDLI value of an unknown damage case. Step 7 Use the regression model to estimate the size of the damage.
In order to assess the performance of the inferred model, the following metric will be used in the rest of this paper. It is defined as the a relative error computed on learning or test set
ε = 1 n L X i=1 |ˆsi− si| si (3) where L is the size of the dataset (learning or test set).
2.4 Parameters tuning
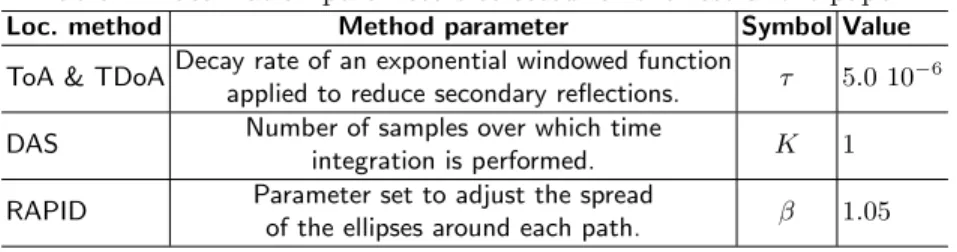
Table 1: Localization parameters selected for the rest of the paper.
Loc. method Method parameter Symbol Value ToA & TDoADecay rate of an exponential windowed function
applied to reduce secondary reflections. τ 5.0 10
−6
DAS Number of samples over which time
integration is performed. K 1 RAPID Parameter set to adjust the spread
of the ellipses around each path. β 1.05
The model described earlier depends on a set of parameters. In order to properly quantify the size of a damage, the data-driven model need to associate a HDLI value to a unique damage size. Thus the tuning of the model parameters need to result in a monotonic manner of the model. As mentioned earlier, 4 different localization methods are tested in this paper. Each of this algorithm depends on a tuning pa-rameter. The authors have found that these parameters have little impact on the quantification model, thus the value are selected empirically in Table 1.
The post-processing method presented in this paper aso depends on a threshold level called T in the HDLI computation step. The optimal threshold value Topt is selected as the one minimizing the error of the training set:
Topt= argmin T ∈R 1 2N N X i=1 ksi− ˆsik2 ! (4)
Since this cost function is not smooth, the derivative free optimization method called simplex [4] is used.
3
Application to experimental data
The post-processing method described in the previous section is applied to experi-mental data. These data are provided by NASA and Standford University [9].
3.1 Data description
The experimental setup consists in a CFRP sample with a dog-bone shape notched at the narrow part to induce a delamination in this region. 12 PZTs are bonded to the sample (6 on each tap). The PZTs placed at the top act only as actuators whereas the ones at the bottom acts only as sensors. The sample is placed in a tensile machine and tested in fatigue at a frequency of 5Hz and a stress ratio of 0.14. The experiment is regularly interrupted to perform Lamb waves propagation measurements along with X-ray control. From theses X-ray images, the delamination can be seen growing progressively with the number cycles. The area of the delamination is extracted from these images with the software Digimizer1. This leads to a dataset composed of a collection of raw signals labeled with the corresponding size of the damage. In the following, the first 70% of the dataset is used as learning set and the last 30% is used as a test set to measure the performance of the model on unknown damages.
The samples under study are the L1 coupons from the NASA database, corre-sponding to the stacking sequence [02/904]s. The excitation signal of the PZT is a 5-cycles tone burst with a central frequency of 250kHz and an amplitude of 50V. This frequency is selected as it’s the one where the Lamb waves modes S0 and A0 are the most distinct as mentioned by [5].
3.2 Results and analysis
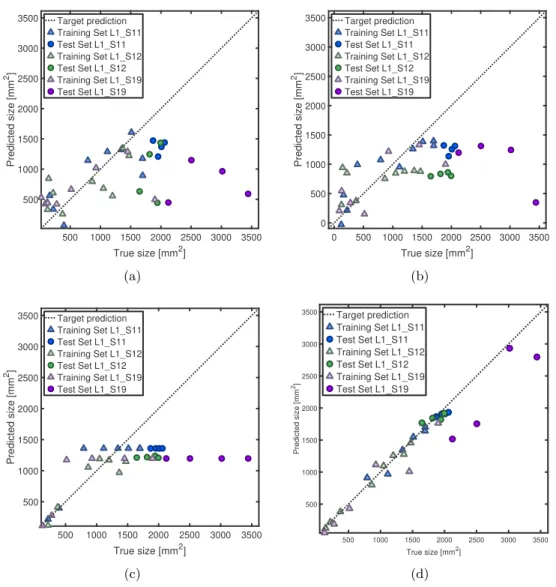
The image post-processing quantification method described in this paper is applied with the four different localization algorithms mentioned earlier. For each sample and each localization algorithm, the performance of the quantification process is evaluated by two means. First, a graph with the true size of the delaminated area on X axis and the size estimated with the quantification process on Y axis is shown Fig. 1. For the sake of space, L1S18 results are not shown under graph form since the scale is different from that of the other coupons. The X = Y line corresponds to a prediction without error. Thus the closer the points are to this line, the more accurate is the prediction. The other way to measure the performance of the algorithm is to compute the error 3 on both learning and test set.
500 1000 1500 2000 2500 3000 3500 True size [mm2] 500 1000 1500 2000 2500 3000 3500 Predicted size [mm 2] Target prediction Training Set L1_S11 Test Set L1_S11 Training Set L1_S12 Test Set L1_S12 Training Set L1_S19 Test Set L1_S19 (a) 0 500 1000 1500 2000 2500 3000 3500 True size [mm2] 0 500 1000 1500 2000 2500 3000 3500 Predicted size [mm 2] Target prediction Training Set L1_S11 Test Set L1_S11 Training Set L1_S12 Test Set L1_S12 Training Set L1_S19 Test Set L1_S19 (b) 500 1000 1500 2000 2500 3000 3500 True size [mm2] 500 1000 1500 2000 2500 3000 3500 Predicted size [mm 2] Target prediction Training Set L1_S11 Test Set L1_S11 Training Set L1_S12 Test Set L1_S12 Training Set L1_S19 Test Set L1_S19 (c) 500 1000 1500 2000 2500 3000 3500 True size [mm2] 500 1000 1500 2000 2500 3000 3500 Predicted size [mm 2] Target prediction Training Set L1_S11 Test Set L1_S11 Training Set L1_S12 Test Set L1_S12 Training Set L1_S19 Test Set L1_S19 (d)
Fig. 1: Damage quantification performance using different damage localization meth-ods on L1 coupons data from NASA. ToA (a), TDoA (b), DAS (c), RAPID (d). The diagonal Y = X line correspond to a prediction without error.
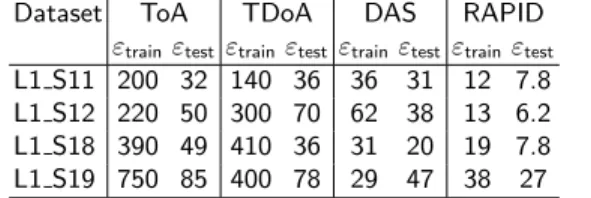
Table 2: Performance over the dataset measured with training and test error.
Dataset ToA TDoA DAS RAPID εtrain εtestεtrainεtest εtrain εtestεtrainεtest
L1 S11 200 32 140 36 36 31 12 7.8 L1 S12 220 50 300 70 62 38 13 6.2 L1 S18 390 49 410 36 31 20 19 7.8 L1 S19 750 85 400 78 29 47 38 27
ToA and TDoA exhibit poor results on both learning and test set. DAS method shows good performance on learning set but mediocre results for prediction on the test set. Finally, the RAPID method performs well on both learning and test sets. This tendency are confirmed both the error obtained table 2. It seems clear that the selected localization method highly influence the results of the quantification process. The HDLI feature computed with ToA and TDoA show no correlation with the true damage size, leading to poor performance on both datasets. An explanation could be that this localization methods only deal with the time of flight which is not very influenced by the size of the damage. On top of that, the high DLI region is made up of ellipses or hyperbolas which area does not clearly vary with the damage size. This phenomenon could influence the performance of the regression as well. Besides, DAS and RAPID both exhibit great results on the training set. This performance could be explained by the fact that DAS and RAPID take amplitude of the signals into account in addition to time of flight, which increase the dependence of the HDLI feature to the actual size of the damage. Moreover, high DLI area in the DAS and RAPID methods is circular and HDLI varies in a monotonic manner over the size of the damage which lead to a more accurate model. DAS method shows poor results on testing set. Indeed, above a certain level, the HDLI remains steady with the damage size. It means that above this level, each damage size leads to the same HDLI. On the opposite, RAPID method leads to a monotonic function between HDLI and damage size for the full range of learning set and test set.t
4
Conclusion
In this paper a new quantification method for damage size assessment of PZTs in-strumented structure was presented. This new algorithm consists in post-processing the image results from a given localization method to compute a feature called HDLI. This damage index is correlated with the actual size of the damage. A quantification model is then inferred on a learning dataset. The model thus obtained is used to pre-dict the size of unknown damage. This method was tested with experimental data
1
coming from fatigue tests of CFRP samples. The proposed approach was tested on four common localization methods and show promising results with a mean error of 6% obtained.
In the current approach, it is necessary to train a single model for each coupon under testing. Future work will focus on transfer learning, i.e. learning the model on the full dataset available for a given coupon and performing prediction with the quantification model on an another sample with similar material and geometrical properties.
Funding
This work has received funding from the European Union’s Horizon 2020 research and innovation program under the REMAP project (grant agreement number 769288). https://h2020-remap.eu/
References
1. Fendzi, C., Mechbal, N., R´ebillat, M., Guskov, M., Coffignal, G.: A general Bayesian framework for ellipse-based and hyperbola-based damage localization in anisotropic composite plates. Journal of Intelligent Material Systems and Structures 27(3), 350– 374 (Feb 2016)
2. Friedman, J., Hastie, T., Tibshirani, R.: The Elements of Statistical Learning, vol. 1. Springer series in statistics (2001)
3. Kulakovskyi, A.: Development of a SHM System by Elastic Guided Waves Applied to Aeronautic Structures. PhD Thesis, Universit´e Paris-Saclay, France (May 2019) 4. Lagarias, J.C., Reeds, J.A., Wright, M.H., Wright, P.E.: Convergence Properties of the
Nelder–Mead Simplex Method in Low Dimensions. SIAM Journal on Optimization 9(1), 112–147 (Jan 1998)
5. Larrosa, C., Lonkar, K., Chang, F.K.: In situ damage classification for composite lami-nates using Gaussian discriminant analysis. Structural Health Monitoring: An Interna-tional Journal 13(2), 190–204 (Mar 2014)
6. Michaels, J.E.: Detection, localization and characterization of damage in plates with anin situarray of spatially distributed ultrasonic sensors. Smart Materials and Structures 17(3), 035035 (May 2008)
7. Migot, A., Bhuiyan, Y., Giurgiutiu, V.: Numerical and experimental investigation of damage severity estimation using Lamb wave–based imaging methods. Journal of Intel-ligent Material Systems and Structures 30(4), 618–635 (Mar 2019)
8. Quaegebeur, N., Masson, P., Langlois-Demers, D., Micheau, P.: Dispersion-based imag-ing for structural health monitorimag-ing usimag-ing sparse and compact arrays. Smart Materials and Structures 20(2), 025005 (Feb 2011)
9. Saxena, A., Goebel, K., Larrosa, C.C., Chang, F.K.: CFRP Composites Data Set (2011) 10. Sharif-Khodaei, Z., Aliabadi, M.H.: Assessment of delay-and-sum algorithms for damage detection in aluminium and composite plates. Smart Materials and Structures 23(7), 075007 (May 2014)
11. Sorrentino, A., De Fenza, A.: Improved elliptical triangulation method for damage de-tection in composite material structures. Proceedings of the Institution of Mechanical Engineers, Part C: Journal of Mechanical Engineering Science 231(16), 3011–3023 (Aug 2017)