How cost-effective are Canadian IPO markets?
20
0
0
Texte intégral
(2) CIRANO Le CIRANO est un organisme sans but lucratif constitué en vertu de la Loi des compagnies du Québec. Le financement de son infrastructure et de ses activités de recherche provient des cotisations de ses organisationsmembres, d’une subvention d’infrastructure du ministère de la Recherche, de la Science et de la Technologie, de même que des subventions et mandats obtenus par ses équipes de recherche. CIRANO is a private non-profit organization incorporated under the Québec Companies Act. Its infrastructure and research activities are funded through fees paid by member organizations, an infrastructure grant from the Ministère de la Recherche, de la Science et de la Technologie, and grants and research mandates obtained by its research teams. Les organisations-partenaires / The Partner Organizations •École des Hautes Études Commerciales •École Polytechnique de Montréal •Université Concordia •Université de Montréal •Université du Québec à Montréal •Université Laval •Université McGill •Ministère des Finances du Québec •MRST •Alcan inc. •AXA Canada •Banque du Canada •Banque Laurentienne du Canada •Banque Nationale du Canada •Banque Royale du Canada •Bell Canada •Bombardier •Bourse de Montréal •Développement des ressources humaines Canada (DRHC) •Fédération des caisses Desjardins du Québec •Hydro-Québec •Industrie Canada •Pratt & Whitney Canada Inc. •Raymond Chabot Grant Thornton •Ville de Montréal. Les cahiers de la série scientifique (CS) visent à rendre accessibles des résultats de recherche effectuée au CIRANO afin de susciter échanges et commentaires. Ces cahiers sont écrits dans le style des publications scientifiques. Les idées et les opinions émises sont sous l’unique responsabilité des auteurs et ne représentent pas nécessairement les positions du CIRANO ou de ses partenaires. This paper presents research carried out at CIRANO and aims at encouraging discussion and comment. The observations and viewpoints expressed are the sole responsibility of the authors. They do not necessarily represent positions of CIRANO or its partners.. ISSN 1198-8177.
(3) How cost-effective are Canadian IPO markets?* Maher Kooli† and Jean-Marc Suret‡ Résumé / Abstract L’objectif de cette étude est l’analyse des divers coûts associés aux émissions initiales d’actions canadiennes. Elle repose sur l’analyse comparée d’échantillons importants d’émissions américaines et canadiennes. Nous avons étudié l’ensemble des émissions de la période 19971999, et seules ont été omises les émissions pour lesquelles l’information requise n’était pas disponible. Les coûts directs et indirects ont été estimés. Le marché canadien présente un avantage net par rapport au marché américain en ce qui concerne les coûts d’émission des entreprises de petite taille. Les coûts sont semblables pour les émissions de grande taille. Dans les deux pays, le processus d’émission reste onéreux, notamment pour les émissions d’un montant peu élevé mais nos résultats contredisent l’argument voulant qu’en raison de la structure provinciale de sa réglementation, le marché canadien soit moins attrayant que celui des ÉtatsUnis pour l’obtention de capital. The purpose of this paper is to shed some light on the costs associated with initial public offerings (IPOs), and this is performed by undertaking a large sample of Canadian and United States IPOs. More specifically, we gather information in the universe of firm-commitment and best-effort IPOs in Canada and in the United States, from 1997 to 1999, and measure their direct and indirect costs. Overall, we are able to confirm that the Canadian market is superior to its U.S. counterpart in terms of IPO costs. In other words, do Canadian firms have access to equity capital on a competitive basis in comparison with U.S. firms. However, we confirm that the going public process is costly, particularly for small firms.. Mots clés : Premier appel public à l'épargne, coûts directs, coûts indirects, Canada, États-Unis.. Keywords: Initial Public Offering, directs costs, indirect costs, Canada, US.. * We thank Caroline Cakebread (the editor) and Paul Halpern for their helpful comments on earlier versions of this paper, and we also thank an anonymous reviewer. Financial support is acknowledged from CIRANO (Montréal) and from SSHRC † Corresponding author: Maher Kooli, Ph.D., Research Advisor, Caisse de dépôt et placement du Québec, Depositor’s accounts management, 1981 McGill College Avenue, 6th floor, Montréal (Québec), Canada, H3A 3C7, Tel: (514) 842-3261 #4807, Fax: (514) 847 5443, e-mail: mkooli@cdpcapital.com ‡ School of Accountancy (Laval University) and CIRANO (Montréal)..
(4) How cost-effective are Canadian IPO markets? Executive summary The going public decision for Canadian businesses has been a subject of great debate due to concerns about a lack of access to capital, or a higher cost of capital, might place Canadian firms in a disadvantageous position in comparison with international competitors, especially American ones. Previous reports and studies claim for higher direct issuing costs linked with the particular structure of securities regulation in Canada. This debate, however, may not be easily solved without a study that compares the issue cost of Canadian and U.S. IPOs. There has been little research undertaken in this direction. Two studies released by the Conference Board of Canada show the cost advantage of Canadian IPOs over the U.S. ones. However, given the size of the sample of Canadian IPOs used in these studies [49 TSE IPOs for Williams and Shutt (2000), and only 16 TSE IPOs for Higgins (1994)], and considering the heterogeneity of the Canadian market, it is premature to assume that their results are applicable to all Canadian IPOs. To assess these concerns, information based on the analysis of large samples is needed. Furthermore, Kryzanowski and Rakita (1999), in a recent article, find that fees charged by U.S. banks for distributing IPOs stocks are only marginally greater, on average, than fees charged by Canadian firms, for the 1993-1997 period. Therefore, it will be interesting to see how the current situation is different from the previous one, and what we have learned from it. In this study, we undertake a large sample of Canadian and American IPOs. In particular, we gather information on the universe of firm-commitment and best-effort IPOs in Canada and in the U.S., from 1997 to 1999, and measure their direct and indirect costs. This research is of particular interest to Canadian entrepreneurs who are contemplating whether or not they should go public in Canada, in the U.S., or in both markets simultaneously. Underwriters, who are key participants in the IPO market, will also be interested in this research. Moreover, this study could raise the interest of investors, who are concerned by how much money is left on the table in IPOs, and of policy makers, who are responsible to foster a business climate that encourages innovations. This paper contributes also to the actual debate relative to the costs associated with the non centralized regulatory system in our country. Our results show that the total direct costs of best effort offerings are higher than those of firmcommitment offerings. For example, in Canada, total direct costs, measured as a percent of the gross proceeds, average 19.19% for best-effort offerings, and 14.39% for firm-commitment offerings. One possible reason for this is that small Canadian firms performing a best efforts deal are mostly those who are not able to access the firm-commitment contract, or if they did, the size of the underwriter discount would be too high. Thus, to raise capital at a lower cost, small Canadian firms should explore different funding sources, including private placements or venture capital arrangements. In both countries, the underwriting fees are the largest single component of the total direct costs. The average underwriting fees of an IPO in Canada varies from 8.12% for issues between US $110 million to 5.53% for issues of more than US $100 million. In the U.S., the average underwriting fees of an IPO varies from 9.39% for issues between US $1-10 million to 6.26% for. 1.
(5) issues of more than US $100 million. Thus, it costs more to find buyers for small IPOs than for larger ones. The underpricing analysis shows that, on average, Canadian IPOs are less underpriced than U.S. IPOs (18.95% versus 37.75%). On a weighted average basis, the difference is even more substantial (5.11% versus 38.16%). This result is largely associated with a time clustering. Several large U.S. IPOs exhibited huge underpricing during this period. To further examine the situations on both markets, we look at the variation in the average cost within each size group across exchanges (see Table 5 “Direct costs by size offering” below). Comparing the average percentage of direct costs of IPOs on the eight exchanges by size category reveals that the TSE has lower direct costs than its competitors, whatever the size category. In other words, Canadian firms have access to equity capital on a competitive basis in comparison with U.S. firms. However, we confirm that the going public process is costly, particularly for small firms, but we find no evidence of a competitive disadvantage of the Canadian new issues market. Our results suggest that, despite of a provincial regulation of securities, Canada allows for lower direct issue costs than those in U.S. for small Initial Public Offerings, and similar conditions for the larger ones.. 2.
(6) 1. Introduction The going public decision for Canadian businesses has been a subject of great debate due to concerns that a lack of access to capital, or a higher cost of capital, might place Canadian firms at a disadvantageous position in comparison with international competitors, especially those in the U.S. The Five Year Review Committee of the Ontario Securities Act wrote in his report (2002, p. 22)1 that “balkanized approach to securities regulation [in Canada] makes it more time consuming and expensive for issuers to raise capital across the country”. MacIntosh (1997), drawing upon results from Sawiak (1996), indicated that compliance with multiples regulatory systems in Canada create both direct and opportunity costs for initial issuers. This debate, however, may not be easily solved without a study that compares the issue costs of Canadian and U.S. IPOs. There has been little research undertaken in this direction. Two studies released by the Conference Board of Canada show the cost advantage of Canadian IPOs over U.S. ones. However, given the size of the sample of Canadian IPOs used in these studies [49 TSE IPOs for Williams and Shutt (2000), and only 16 TSE IPOs for Higgins (1994)] and considering the heterogeneity of the Canadian market, it is premature to assume that their results are applicable to all Canadian IPOs. To assess these concerns, information based on the analysis of large samples is needed2. Furthermore, Kryzanowski and Rakita (1999), in a recent article, find that fees charged by U.S. banks for distributing IPOs stocks are only marginally greater on average than fees charged by Canadian firms, during the 1993-. 1. OSC (2002). Five Year Revise Committee and substantiating documents. Reviewing the Securities Act (Ontario) <http://www.osc.gov.on.ca>. 2 Higgins (1994, p.15) points out that “further research covering a longer time frame could provide a larger sample, from which conclusions could be drawn with greater confidence”.. 3.
(7) 1997 period. Therefore, it will be interesting to see how the current situation is different from the previous one, and what we have learned from it. In this study, we undertake a large sample of Canadian and American IPOs. In particular, we gather information on the universe of firm-commitment and best-effort IPOs in Canada and in the U.S., from 1997 to 1999, and measure their direct and indirect costs. This is, to our knowledge, the first large scale examination of IPO costs in Canada. This research is of particular interest to Canadian entrepreneurs who are contemplating whether or not they should go public in Canada, in the U.S., or in both markets simultaneously. Underwriters, who are key participants in the IPO market, will also be interested in this research. Moreover, this study could raise the interest of investors who are concerned by how much money is left on the table in IPOs, and of policy makers who are responsible to foster a business climate that encourages innovations. An effective and cost efficient IPO process would, indeed, assure the financing needed by innovative and growing companies.. 2. The Data and the costs of going public The data used in this study come from several sources and cover the 1997-1999 period. For the Canadian sample, we use the Financial Post’s Record of New Issues. This source provides data from all Canadian IPOs including offering prices, gross proceeds, underwriters, and underwriter’s spread. Data for other expenses, contract type and industry are taken from final IPO prospectuses available on SEDAR Web site (http://www.sedar.com). For the U.S. sample, we use EDGAR Online Web site (http://www.edgar-online.com), which provides information derived from U.S. Securities. 4.
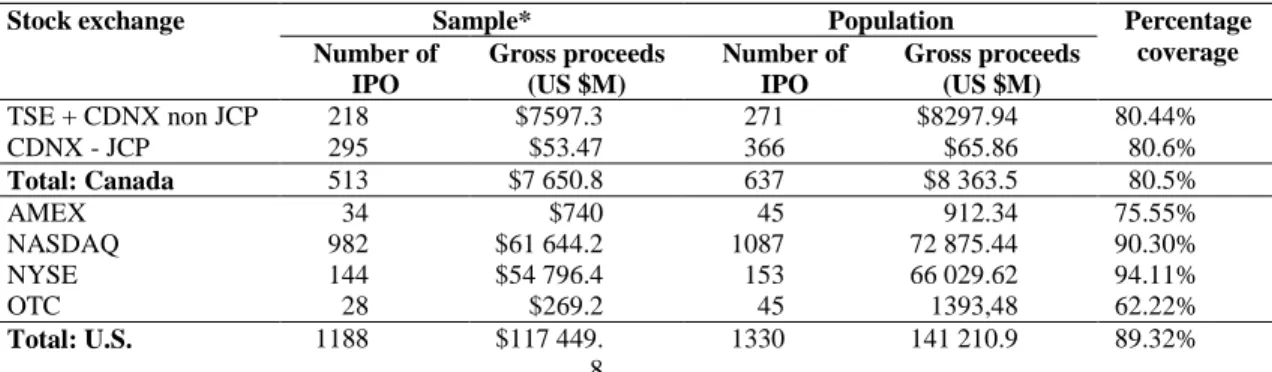
(8) and Exchange Commission data on U.S. new issues. For both sample, we exclude unit offerings, closed-end funds, real estate investment trusts offerings (REITs), American Depositary Receipts (ADRs) and Regulation-A offerings. Table 1 (see “Sample set compared with population” below) shows a comparison of the sample with the total population of IPOs for each Canadian and major U.S. stock exchange during the 1997-1999 period. The final sample consists of 513 common equity Canadian IPOs and 1188 common equity U.S. IPOs during the 1997-1999 period. Most of the Canadian IPOs come from technology, mining, oil and gas companies (44.64% of the sample), but 55.46% of the aggregate gross proceeds is raised by financial services and real estate companies. Moreover, Junior Capital Pool3 (JCP) IPOs represent 57.5% of Canadian IPOs, while the TSE IPOs account for 99.13% of the total capital raised on the Canadian market. As in the Canadian sample, most of the U.S. IPOs come from the technology sector (30.72% of the sample), and 35% of the aggregate gross proceeds is raised by financial services and technology IPOs. Nevertheless, a direct comparison between the sizes of the IPO markets in the two countries cannot be made easily. If one takes the number of IPOs as an indicator, Table 1 clearly shows the dominance of the NASDAQ exchange (high-tech exchange), and of the U.S. economy. If we look at the ratio of IPOs on Canadian exchanges with respect to those on the American exchanges, we observe approximately 10 IPOs on the NASDAQ for every 1 on the TSE for the 1997-1999 period. According to the Conference Board Study (1994), the ratio of IPOs on. 3. The Junior Capital pool (JCP) program was enacted to help junior start up companies to get the opportunity to become listed. A JCP company is a form of public listing exclusive to the CDNX. A JCP is not required to have an already established business, and is not even required to identify a business or project for which the raised capital will be used (blind pool). Thus, JCP IPOs are risky and small issues, which explain why we analyse them separately from TSE and CDNX non JCP IPOs.. 5.
(9) the TSE to IPOs on the NASDAQ is highly variable, ranging from 5:1 to 25:1, for the 1984-1993 period.. Table 1: Sample set compared with population. Stock exchange. TSE + CDNX non JCP CDNX - JCP Total: Canada AMEX NASDAQ NYSE OTC Total: U.S.. Sample* Number of Gross proceeds IPO (US $M) 218 $7597.3 295 $53.47 513 $7 650.8 34 $740 982 $61 644.2 144 $54 796.4 28 $269.2 1188 $117 449. 8. Population Number of Gross proceeds IPO (US $M) 271 $8297.94 366 $65.86 637 $8 363.5 45 912.34 1087 72 875.44 153 66 029.62 45 1393,48 1330 141 210.9. Percentage coverage 80.44% 80.6% 80.5% 75.55% 90.30% 94.11% 62.22% 89.32%. *124 Canadian IPOs and 142 U.S. IPOs had to be dropped because data on the “other expenses” aren’t available; 5 Canadian IPOs listed exclusively on U.S. exchange are also picked out. JCP for Junior Capital Pool. There are two major direct cost components in an IPO: (i) the direct expenses, and (ii) the underwriter’s commission (or spread). Direct expenses are composed of legal expenses, accounting and auditing fees, registration and transfer agent fees, printing costs, taxes, filing fees for the securities commissions, and other out-of-pocket costs. These costs are reported in the offering prospectus. The underwriter’s commission is the largest direct cost. It is the difference between the offer price and the price per share received by the company. The indirect cost of going public consists primarily of the underpricing4 which results from the underwriter practice for pricing new issues below their market value. It is an indirect cost supported by issuers since it represents “money left on the table”. The existence of the underpricing phenomenon in IPOs is well documented by the finance. 4. Underpricing = 100%* [(first closing market price-offering price)/offering price].. 6.
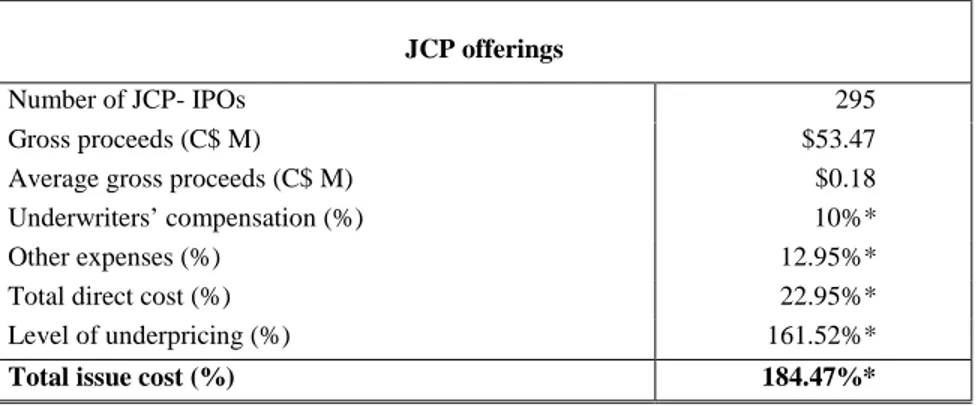
(10) literature, and seems to be a common characteristic in most international markets5. We do not attempt to capture the opportunity costs created by the delays associated with the process, neither the intangibles costs associated with the time and efforts of the management team.. 3. Costs and methods of raising capital through an IPO Firms going public use generally the firm-commitment or the best-effort method. In the firm-commitment method, the underwriter guarantees the proceeds of the issuing firm. He bears therefore the risk of undersubscription, and should be compensated through the underwriter’s discount. Nevertheless, in a case of oversubscription, the price cannot be raised, so the issue must be rationed. However, the number of shares may be increased by an overallotment option. The motivation for this option is to provide buying support for the shares without exposing the underwriter to excessive risk. In the case of best-effort offerings, the underwriter acts more like an agent of the issuer and does not guarantee the net proceeds of the offering. Therefore, the issuing firm bears the risk of the operation. If the minimum number is not sold, the issue is cancelled and the paid-in amount is returned to subscribing investors. Hence, in this situation, we would expect the underwriter discount to be lower. In Canada, the JCP program is an interesting option for emerging companies that need to raise small amounts of capital. However, while the JCP program simplifies the process of going public, it is not without its inherent costs. Table 2 shows the direct and indirect. 5. In this study, no explanation or discussion of underpricing is attempted. For details, see Kooli and Suret (2001). The existing literature suggests that the level of underpricing is, on average, larger for smaller and riskier firms, in hot markets, and for offerings issued by less prestigious underwriters.. 7.
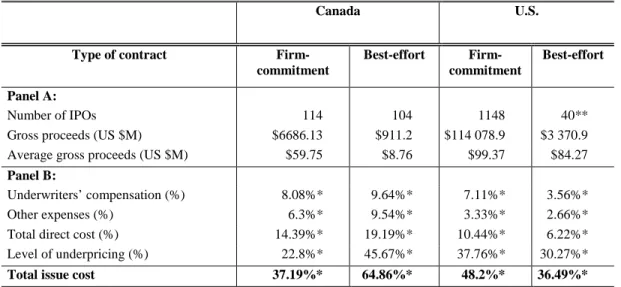
(11) costs of going public via a JCP program. As shown, it costs 22.95%, on average, for JCP companies to raise C$ 53.46 million, and the average underwriting fees clusters around 10%. However, we have to keep in mind that JCP companies are riskier issuers, and IPO shares are sold between C$ 0.10 and C$ 0.30, which explain their high degree of underpricing.. Table 2: Direct and indirect costs of JCP IPOs, for the 1997-1999 period. JCP offerings Number of JCP- IPOs Gross proceeds (C$ M) Average gross proceeds (C$ M) Underwriters’ compensation (%) Other expenses (%) Total direct cost (%) Level of underpricing (%). 295 $53.47 $0.18 10%* 12.95%* 22.95%* 161.52%*. Total issue cost (%). 184.47%*. * Significant at 1%.. Panel A of Table 3 (see “Direct and indirect costs categorized by contract type” below) reports descriptive statistics for the 218 Canadian firms (excluding JCP companies) that were taken public by contract type. Panel A shows that, in Canada, the average firmcommitment offer raises almost seven times as much money as the average best-effort offer (US $ 59.75 million versus US $ 8.76 million). Panel B of Table 3 shows the direct costs of going public for the two contract types. As shown, it is evident that the total direct costs of best-effort offerings are higher than those of firm-commitment offerings. Total direct costs, measured as a percent of the gross proceeds, average 19.19% for best-effort offerings, and 14.39% for firm-commitment offerings. The t-value on the difference in means between firm-commitment and best8.
(12) effort issues is significant at the 5% level. This result raises the following question: why small Canadian firms are still using the best effort contract in spite of its apparent cost disadvantage? One possible explanation is that small Canadian firms performing a best efforts deal are mostly those who are not able to access the firm-commitment contract, or if they would, the underwriter’s discount would be too high6. Thus, to raise capital at a lower cost, small Canadian firms should explore different funding sources, including private placements, or venture capital arrangements. The U.S. sample shows no considerable variation in the average gross proceeds raised by either firm-commitment or best-effort offerings (US $99.37 million versus US $82.27 million). Furthermore, firm-commitment contracts are used in 96.63% of all offers and best-effort contracts are uncommon.. Furthermore, the total direct costs of best-effort offerings are lower than those of firm-commitment offerings. This finding is consistent with the theoretical backdrop that confirms that in best-effort offerings, the bank only pledges to provide its “best effort” to sell shares, and consequently, investment bank compensation should be lower. However, a further exam of the U.S. sample reveals that out of the 40 best-effort offerings, 34 are financial services IPOs. These companies, even if they need an external broker service to sell their shares, are less concerned by the certification of the price, and hence, the underwriter discount is lower (3.56% vs. 7.11% for firm-commitment offerings). Thus, the low cost of best-effort contracts, in our U.S. sample, would be an industry’s phenomenon. 6. A further exam of the Canadian sample reveals that, out of the 380 best-effort offerings, 355 are CDNX IPOs. Of these, 181 are technology, mining, oil and gas IPOs. Thus, most emerging companies that are not able to access the TSE will choose the CDNX as a first step before graduating to a senior exchange, and will be introduced on a best-effort basis.. 9.
(13) Table 3: Direct and indirect costs categorized by contract type, excluding JCP IPOs, for the period 1997-1999 Canada Type of contract. Firmcommitment. U.S. Best-effort. Firmcommitment. Best-effort. Panel A: Number of IPOs Gross proceeds (US $M) Average gross proceeds (US $M). 114 $6686.13 $59.75. 104 $911.2 $8.76. 1148 $114 078.9 $99.37. 40** $3 370.9 $84.27. Panel B: Underwriters’ compensation (%) Other expenses (%) Total direct cost (%) Level of underpricing (%). 8.08%* 6.3%* 14.39%* 22.8%*. 9.64%* 9.54%* 19.19%* 45.67%*. 7.11%* 3.33%* 10.44%* 37.76%*. 3.56%* 2.66%* 6.22%* 30.27%*. Total issue cost. 37.19%*. 64.86%*. 48.2%*. 36.49%*. ¤. * Significant at 1%. T-value on the difference in mean between firm-commitment and best-effort issues is significant at 5%. ** Out of the 40 best-effort offerings, 34 are financial services IPOs.. 4. A comparison of Canadian and U.S. costs of IPOs Table 4 shows direct and indirect costs of going public in Canada for firm-commitment offerings7. It costs 8.57%, on average, for TSE companies to raise US $6,596 million, while it costs 19%, on average, for CDNX companies to raise US $93 million. Similarly, we find that TSE IPOs are less underpriced than CDNX IPOs. Thus, as expected, the TSE exhibits the lowest cost for IPOs in Canada. This result is in line with those of Williams and Shutt (2000), and Higgins (1994), and confirms the fact that firms who are not able to access the TSE market are riskier issuers who pay more on the CDNX market to go public.. 7. We compare only Canadian firm-commitments contract costs with U.S. firm-commitments since that is really the only contract type used in the U.S.. 10.
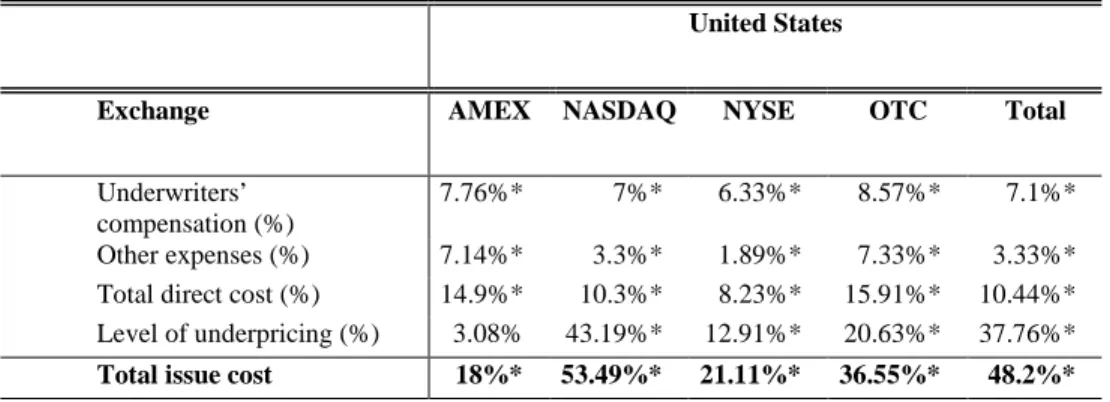
(14) Table 4: Canadian IPO markets Canada Exchange. TSE. CDNX. Total. Underwriters’ compensation (%) Other expenses (%) Total direct cost (%) Level of underpricing (%). 5.91%*. 9.52%*. 7.54%*. 2.65%* 8.57%* 12.02%*. 9.47%* 19.00%* 62.71%*. 5.73%* 13.27%* 34.89%*. Total issue cost. 20.59%*. 81.72%*. 48.16%*. * Significant at 1%.. Table 5 reports direct and indirect costs of going public in the U.S. for firm-commitment offerings. As Table 5 shows, it is clear that in the U.S., the NYSE has a direct cost advantage for firms going public. However, if we include the underpricing degree as an indirect cost, we find that the AMEX is the lowest cost for IPOs in the U.S. Overall, our results across exchanges support the logic that direct costs are relatively greater for small issues than for large issues. Corwin and Harris (1999) explain the differences across exchanges by (i) the differences in initial listing fees, (ii) the prestige factor that underwriters can use to attract more potential investors, and (iii) the quality certification that can reduce investor’s uncertainty about the value of the offer, and consequently should result in lower underpricing.. Table 5: U.S. IPO markets United States Exchange Underwriters’ compensation (%) Other expenses (%) Total direct cost (%) Level of underpricing (%) Total issue cost. AMEX. NASDAQ. NYSE. OTC. Total. 7.76%*. 7%*. 6.33%*. 8.57%*. 7.1%*. 7.14%* 14.9%* 3.08%. 3.3%* 10.3%* 43.19%*. 1.89%* 8.23%* 12.91%*. 7.33%* 15.91%* 20.63%*. 3.33%* 10.44%* 37.76%*. 18%*. 53.49%*. 21.11%*. 36.55%*. 48.2%*. * Significant at 1%.. 11.
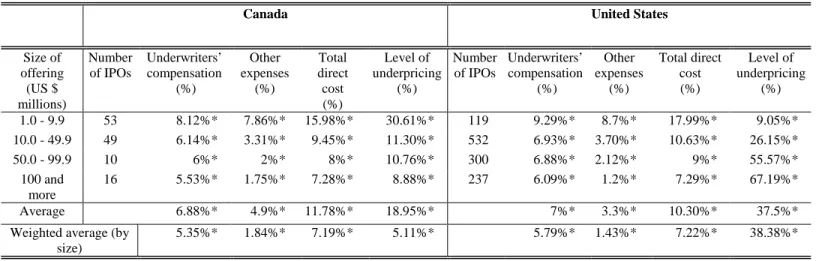
(15) To compare issue costs between two markets, we have to take issue size in consideration. Table 6 (see “Comparative cost by size offering” below) summarizes the costs of going public in Canada and in the United States in relation with the size of the offering. The average total direct cost of an IPO in Canada varies from 15.98% for issues between US $1-10 million to 7.28% for issues of more than US $100 million. In the U.S., the average total direct cost of an IPO varies from 17.99% for issues between US $1-10 million to 7.29% for issues of more than US $100 million. Thus, we find that the average direct cost of issuing a small IPO in Canada (less than US $10 million) is less than the one in the U.S. However, the direct cost for larger IPOs (more than US $100 million) is similar in both countries.. Table 6: Comparative cost by size offering, excluding JCP companies, for the 1997-1999 period Canada Size of offering (US $ millions) 1.0 - 9.9 10.0 - 49.9 50.0 - 99.9 100 and more Average. Number of IPOs. 53 49 10 16. Weighted average (by size). Underwriters’ compensation (%). Other expenses (%). United States. 8.12%* 6.14%* 6%* 5.53%*. 7.86%* 3.31%* 2%* 1.75%*. Total direct cost (%) 15.98%* 9.45%* 8%* 7.28%*. 6.88%*. 4.9%*. 11.78%*. 5.35%*. 1.84%*. 7.19%*. Level of Number Underwriters’ Other underpricing of IPOs compensation expenses (%) (%) (%) 30.61%* 11.30%* 10.76%* 8.88%*. 119 532 300 237. Total direct cost (%). Level of underpricing (%). 9.29%* 6.93%* 6.88%* 6.09%*. 8.7%* 3.70%* 2.12%* 1.2%*. 17.99%* 10.63%* 9%* 7.29%*. 9.05%* 26.15%* 55.57%* 67.19%*. 18.95%*. 7%*. 3.3%*. 10.30%*. 37.5%*. 5.11%*. 5.79%*. 1.43%*. 7.22%*. 38.38%*. * Significant at 1%.. In both countries, the underwriting fees are the largest component of the total direct costs The average underwriting fees of an IPO in Canada varies from 8.12% for issues between US $1-10 million to 5.53% for issues of more than US $100 million. In the U.S., the average underwriting fees of an IPO varies from 9.39% for issues between US $1-10 12.
(16) million to 6.26% for issues of more than US $100 million. Thus, it costs more to find buyers for small IPOs than for larger ones. An analysis of the variation in the average underwriting fees within each size group further suggests that U.S. underwriters extract slightly higher fees than Canadian underwriters in providing access to a larger and deeper capital market with more liquidity. Interestingly, we find that the average underwriters’ spread is 7.1%, which confirms the results of previous U.S. studies for issues between US $20 and 80 million. Chen and Ritter (2000) explain the “7% solution” in the U.S. by the fact that issuers have placed relatively little attention on fees. Moreover, U.S. underwriters avoid competing on fees because they do not want to turn the IPO business into a commodity business. Ljungqvist and Wilhelm (1999) give another explanation to the clustering around 7%. They point out that establishing spread commission at 7% simplifies bargaining. Kryzanowski and Rakita (1999) examine the collusion question in the Canadian context and do not find an abnormally high level among investment bankers (at 6%) for the 19931997 period. Our Canadian sample also confirms the absence of collusion for the 19971999 period. A comparison of underwriters’ spread in other countries reveals that spreads in Canada and in the U.S. are high. For example, IPOs spreads are 5.3% in Japan and 3.1% in France. The United Kingdom spread is even lower (2.1%)8. The fact that Canadian and U.S. underwriters charge a greater premium when the issuing firm seeks a Canadian or a U.S. listing could be interpreted as evidence of Canadian and U.S. underwriters. 8. See Ljungqvist and Wilhelm (1999).. 13.
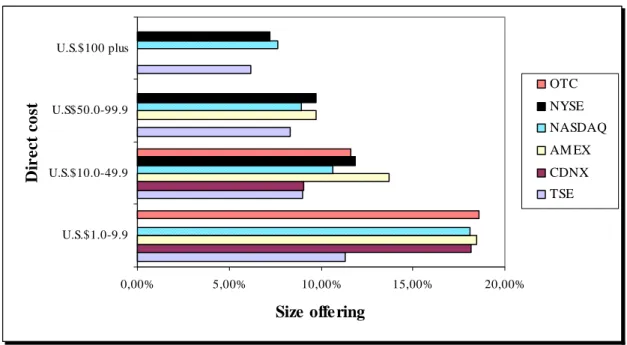
(17) maintaining market power in their local capital markets. We could also think that Canadian and U.S. underwriter’s network contributes most to pricing and distribution. Moreover, numerous studies suggest that the best-known empirical anomaly associated with the process of going public is the frequent incidence of large returns accruing to investors in IPOs at the time of the offering. There is also some perception that underwriters are capable of controlling this underpricing. If the Canadian and U.S. spread premium reflects the expectation of higher quality service, we should observe a trade-off between underpricing and spreads. In other words, we should observe a negative correlation between gross spreads and underpricing. We examine this relationship and the evidence of a trade-off is fairly weak for U.S. IPOs, and totally absent for Canadian IPOs. Could we say then, that Canadian and U.S. firm management teams are not rational in their selection of underwriters or capital markets? To answer this question, we need a further in-depth investigation, which is beyond the scope of this study. We leave this debate for future research. The underpricing analysis shows that, on average, Canadian IPOs are less underpriced than U.S. IPOs (18.95% versus 37.75%). On a weighted average basis, the difference is even more substantial (5.11% versus 38.16%). This result is linked to a date clustering. During the studied period, several large U.S. IPOs exhibited huge and uncommon initial returns: VA Linux Sys (US M$132, IR 697.5%), Foundry Networks (525%), CacheFlow (426.58%). To further examine the situations on both markets, we look at the variation in the average cost within each group size across exchanges (see Figure 1 “Direct costs by offering size” below). Comparing the average percentage of direct costs of IPOs on the eight exchanges. 14.
(18) by category size reveals that the TSE has lower direct costs than its competitors in every size category. In other words, Canadian firms have access to equity capital on a competitive basis in comparison with U.S. firms. Figure 1: Direct costs by offering size, excluding JCP companies and issues under US $ 1 million, during 1997-1999. U.S.$100 plus. Direct cost. OTC NYSE. U.S$50.0-99.9. NASDAQ AM EX CDNX. U.S.$10.0-49.9. TSE U.S.$1.0-9.9. 0,00%. 5,00%. 10,00%. 15,00%. 20,00%. Size offering. The existence of major economies of scale is evident, from Figure 1, for Canadian and U.S. offerings9.. 5. Conclusion The purpose of this study is to assess whether or not Canadian firms have access to equity capital on a competitive basis in comparison with their U.S. counterparts. Our results. 9. To confirm this observation we consider the following simple linear regression: ln(total direct cost) = b1 + b2*ln(gross proceeds)+ e. The results for Canadian IPOs show that the adjusted R-square is 0.34 (0.5 for U.S. IPOs) and the estimated coefficient b2 is -0.021 with t-statistic = -8.34 (b2 is -0.025 with t-statistic = -34.39 for U.S. IPOs). Thus, the total direct cost varies inversely with the size of the offering.. 15.
(19) show that the total direct costs of best-effort offerings are higher than those of firmcommitment offerings (21.91% vs. 13.27%). The implication of this result is that if the entrepreneur is unable to obtain a firm-commitment from an underwriter, different funding sources including private placements and venture capital arrangements, should be explored. The firm may also go public by other means, such as reverse take-over (RTO) or back-door listing.. We also look at the variation in the average cost within each group size across exchanges, and overall, we are able to confirm that Canadian market is superior to its U.S. counterparts in terms of IPO costs. In other words, Canadian firms have access to equity capital on a competitive basis in comparison with U.S. firms. However, we confirm that the going public process is costly, particularly for small firms.. We don’t find any evidence of a competitive disadvantage for the Canadian market in comparison to the U.S one.. Our results, as well as the previous conclusions from. Williams and Shutt (2000), and Higgins (1994) do not support the claim that issuers in Canada suffer from supplementary costs linked to the actual structure of the Canadian securities regulation.. 16.
(20) References Aggarwal, R. and P. Rivoli, 1991, “Evaluating the costs of going public”, Journal of Business Venturing 6, 351-361. Anand, A., D. Johnston and G, Peterson, 1999, Canadian securities regulation: cases, notes & materials, Chapter 5, Butterworths. Chen, H. and J. Ritter, 2000, “The seven percent solution”, Journal of Finance 55, No 3, 1105-1131. Corwin S. and J. Harris, 1999, “The initial listing decisions of firms that go public”, University of Georgia Working Paper. Higgins, J., 1994, “Canada an U.S. cost comparisons of initial public offerings (IPOs)”, The Conference Board of Canada, No 94-119. Kooli, M. and J.M. Suret, 2001, “The underpricing of Canadian initial public offerings”, CIRANO Working Paper. Kryzanovski, L. and I. Rakita, 1999, “Is the U.S. 7% solution equivalent to the Canadian 6% solution”, Canadian Investment Review, 27-35. Ljungqvist, A. and W. Wilhelm, 1999, “The seven percent solution? An international perspective on underpricing”, Oxford University Working Paper. MacInstosh, J. G., 1997, A national securities commission for Canada? in TJ Courchene et E.H. Neaves. Reforming the Canadian Financial Sector: Canada in Global Perspective, John Deutsch Institute for the Study of Economic Policy, 185-239. Ritter, J., 1987, “The costs of going public”, Journal of Financial Economics 19, 269281. Sawiak, G.V, WJ. Braithwaite and P. Olasker., 1996, Report to the Standing Senate Committee on Banking, Trade and Commerce on the Transaction costs of a decentralized system of securities regulation, April. Williams, H. and T. Shutt, 2000, “A comparison of IPO markets”, The Conference Board of Canada, No 296-00.i i. 17.
(21)
Figure
+3
Documents relatifs
/ La version de cette publication peut être l’une des suivantes : la version prépublication de l’auteur, la version acceptée du manuscrit ou la version de l’éditeur. Access
Les objectifs généraux de l’enquête sont de connaître, pour les entreprises qui ont déjà réalisé une réduction des horaires collectifs (dans le cadre des lois Robien ou Aubry),
Le potentiel d’introduction de bactéries pathogènes d’origine hydrique dans le réseau de distribution et leur capacité de survie et de recroissance de ces organismes dans
We report herein the case of a new genotype described on the basis of solely a small partial sequence and discuss the poor reliability of this fragment to correctly infer
(1965) ont suivi cette évolution par dix prélèvements effectués tous les 15 jours à partir du 30 mai, les résultats des teneurs en éléments minéraux dans
masculine sur laquelle il est fondé : C’est la division sexuelle du travail, distribution très stricte des activités imparties à chacun des deux sexes, de leur lieu, leur moment,
According to our hypothesis, implementation of VigilanS in the Nord– Pas-de-Calais will significantly reduce suicide and suicide reattempt rates not only in patients
Higher is the market price of risk in the insurance linked securities market, higher is the cost of capital rate, whatever the return period.. Our results differ
