Sources of Labrador Sea sediments since the last glacial maximum inferred
from Nd-Pb isotopes
N. Fagel,1 C. Innocent,2 C. Gariepy and C. Hillaire-Marcel
Geotop, UQAM (Université du Québec à Montréal), Case Postale 8888, Succ. Centre Ville, Montréal, H3C 3P8, Québec, Canada 1 Present address: Laboratoire de Géologie des Argiles, Université de Liège, B18, Sart Tilman, B-4000 Liège, Belgium
2 Present address: BRGM (Bureau des Recherches Géologiques et Minières), Analytical Dept., 3 Avenue Claude Guillemin, BP 6009, 45060 Orléans Cedex 2, France
Abstract
Pb isotopes have been measured in the clay-size fraction of Late Glacial and Holocene deep-sea sediments recovered from two Labrador Sea piston cores that have been previously analyzed for Nd isotopes. The newly acquired Pb isotopic data allow us to better constrain the different source areas that supplied clay-size material during the last deglaciation, until 8.6 kyr (calendar ages). Nd-Pb data can be modeled mainly as a mixture between a Precambrian crust and Lower Paleozoic material originating from the denudation of the pan-African orogen. The old material originates mainly from the Archean, Lower Proterozoic, or both terranes of Greenland (and also probably corresponding terranes of Labrador), although minor input of other Precambrian material is recorded in some detrital carbonate-rich deglacial samples from Orphan Knoll. The Phanerozoic crustal end member consists of sediment material mainly originating from northwestern Europe. This source area is found to be the only significant source of young crustal material in early Holocene sediments from the Greenland Rise. No significant input from the mid-Atlantic volcanism is apparent. This study puts further constraints on the deep circulation pattern during the last deglaciation. It is concluded that at that time, European Phanerozoic material was carried from the Norwegian Sea through the Wyville Thompson Ridge into the Iceland Basin by the North East Atlantic Deep Water. No evidence for an overflow is found either south of the Iceland (Iceland-Scotland Ridge) or through the Denmark Strait.
1. INTRODUCTION
Nd and Pb isotopes have proven to be powerful tracers of the origin and provenance of deep-sea sediments (e.g., White et al., 1985; White and Dupré, 1986; McLennan et al., 1989; Dia et al., 1992). In particular, they have been used to investigate the origin of deep-sea sediments in subduction areas (e.g., Vroon et al., 1995, and references therein), where crustal and mantle sources having different Nd and Pb isotopic compositions are involved. They may be also suitable tracers of the origin of deep-sea sediments of the northwestern North Atlantic (Labrador Sea), where, at present, mid-Atlantic mantle sources interact with old crustal North American supplies.
The Labrador Sea has been extensively studied for decades because it is one of the areas of formation of the North Atlantic deep water (NADW), which ventilates the world ocean and which is a key factor for thermohaline circulation and subsequently for the regulation of the Earth's climate (e.g., Broecker and Denton, 1989; Broecker et al., 1990). Several articles have been published dealing with Nd isotopes, Pb isotopes, or both (e.g., Grousset et al., 1993; Gwiazda et al., 1996a; Revel et al., 1996a,b; Hemming et al., 1998) in Quaternary deep-sea sediments from this area. They focus mainly on the analysis of sandy detrital layers that have been associated with major coolings of the northern North Atlantic (i.e., the so-called Heinrich events [HEs], or Heinrich layers, of the northeastern North Atlantic and corresponding carbonate-rich detrital events of the Labrador Sea). The origin of these layers is now well constrained (e.g., Grousset et al., 1993; Gwiazda et al., 1996a, b; Revel et al., 1996a; Andrews et al., 1998; Hemming et al., 1998, 2000). However, this is not the case for the sources of clay-size deep-sea sediments, which record continuous sedimentary supplies through time in addition to punctual events.
Some of the articles cited above include isotopic studies on the "fine" fraction of deep-sea sediments. However, they do not refer to the same size fraction: Revel et al. (1996b) worked on the 10- to 63-µm and <10-µm fractions, and Hemming et al. (1998) worked on the <63-µm fraction. In contrast, Innocent et al. (1997) and Fagel et al. (1999) worked on the clay-size (<2 µm) fraction. Among these different size fractions, the clay-size fraction appears to be of particular interest to trace the sedimentary supplies driven by deep currents. Clay-size particles may be transported by deep currents, then deposited when the current strength decreases, but are less sensitive to further current winnowing after deposition as a result of their cohesive behavior. Innocent et al. (2000) have demonstrated that respective isotopic informations provided by the clay fraction, the cohesive silt fraction (2 to 10 µm), and the noncohesive (10 to 63 µm) fine fraction are different but complementary. In this
article, changes in sediment sources since the last glacial maximum (LGM, ~25 kyr ago) are discussed on the basis of a glacial and postglacial (from ~26 to 8 kyr) Nd-Pb data set. We focus on the clay-size fraction because this represents the best component for examining deep-sea sediment sources, rather than Fe-Mn crusts, because the latter are considered to record changes in seawater composition (e.g., Goldstein and O'Nions, 1981).
2. DEEP CURRENTS: PREVIOUS STUDIES
In the Labrador Sea, deep-sea sedimentation is strongly influenced by the Western Boundary undercurrent (WBUC), a contour-flowing current that drives the main water masses involved in the NADW (McCartney, 1992; Lucotte and Hillaire-Marcel, 1994). Winnowing by the WBUC is evidenced on both the Greenland and Labrador Margin by the lower sedimentation rates and low lateral 230Th fluxes on the slope relative to those observed on the rise (Hillaire-Marcel et al., 1994a; Vallières, 1997). Sediment transport by the WBUC has been also emphasized by clay mineralogical studies on the finest (<2 µm) fraction of surface deep-sea sediments (Fagel et al., 1996). The WBUC is responsible for the erosion and transport of clay-size particles from the eastern basins (Irminger and Iceland Basins), then for further redeposition in the Labrador Sea. However, sediment material incoming from the eastern basins is composite, as indicated by isotopic Nd (Innocent et al., 1997) and U-Th studies (Vallières, 1997; Veiga-Pires and Hillaire-Marcel, 1998). Sediments of the Irminger Basins are influenced by both mantle mid-Atlantic and European Phanerozoic input. Also, a major input of material from the Denmark Strait overflow water (DSOW), with Sm-Nd signatures comparable to the European Phanerozoic crust, has been emphasized (Innocent et al., 1997).
It has been long documented that the WBUC was active during the LGM (Ledbetter and Balsam, 1985). However, mineralogical (Fagel et al., 1997) and isotopic (Innocent et al., 1997; Fagel et al., 1999) tracers indicate that it was sluggish, in agreement with the hypothesis of a reduced NADW production at that time (Boyle, 1995). Then it increased rapidly in strength shortly after the isotopic stage 2/1 transition (Bilodeau, 1994; Fagel et al., 1997, 1999), as was also the case for the northeastern North Atlantic (McCave et al., 1995). According to Fagel et al. (2001), an increased influence of the DSOW is documented 4.5 kyr ago, on the basis of detailed mineralogical studies on smectites. Conversely, Veiga-Pires and Hillaire-Marcel (1998), on the basis of U-Th data, indicate a slightly older age of emplacement of a present-day sedimentary dynamics, between the end of the Younger Dryas (YD) and 6 to 8 kyr ago.
3. SEDIMENT MATERIAL: LOCATION, LITHOLOGY, AND CHRONOLOGY
Late Glacial and Holocene sediments were sampled from two piston cores collected in the Labrador Sea (CSS Hudson cruises 1990 and 1991; Fig. 1). The cores were taken at a water depth of ~3400 m, along the pathway of the modern WBUC.
3.1. Greenland Margin: Inlet of the WBUC
Piston core 90-013-013 (PC 13) was taken from the Southwest Greenland Rise (Fig. 1). In the upper part of the core, the oxygen isotopic curve (δ18O on planktonic foraminifera) displays a deglaciation in two steps, with two shifts at ~440 cm (~16 kyr, termination 1A) and ~350 cm (~10 kyr, termination 1B). A short interval (388 to 400 cm) characterized by high δ18O values is related to the YD cold event (12 kyr at 399 cm). The sediment is mainly composed of clay-rich silts and clays. Numerous tephra layers can be identified. In particular the Vedde tephra, which is contemporaneous to the YD, is found between 350 and 400 cm (stage 1). Two thin, sandy layers occur between 440 to 450 cm (~16 kyr) and 505 to 510 cm (~24 kyr). Such layers, which are correlated with HEs defined in the northern North Atlantic Ocean (Stoner et al., 1996), mainly reflect ice-rafted supplies related to major cooling phases. PC 13 is characterized by high sedimentation rates (>30 cm/ka) during the Holocene and lower rates (~10 cm/ka) during the glacial stage (Hillaire-Marcel et al., 1994b). For the glacial/interglacial interval we studied, the chronometry of PC 13 is based on the isotopic stratigraphy and thirteen 14C dates (Table 1). Ages reported for each sample depth are estimated by linear interpolation between adjacent 14C ages. These interpolated ages are then calibrated by means of the curve of Stoner et al. (1998). Thirty-eight samples (including the sandy layer HE 1) were selected for Nd and Pb isotopic analyses between core depths of 243 to 530 cm, corresponding to calibrated ages ranging between 8.6 and 26.1 kyr (Table 1). This sampling interval, averaging one sample per 7 cm, allows for a time resolution of ~250 yr.
3.2. Canadian Margin: Outlet of the WBUC
Piston core 91-045-094 (PC 94) was collected from the western Labrador Sea (Fig. 1). The planktonic oxygen isotopic curve depicts once again a two-step deglaciation, with a light event dated ~17 and 14 kyr (Hillaire-Marcel et al., 1994b). The subsequent peak of high δ18O values (190 to 200 cm) dated approximately 13 to 13.5 kyr is older than the YD. The hemipelagic clayey sedimentation is interrupted by massive sandy detrital carbonate-rich layers. These layers have been correlated with HEs of the North Atlantic Ocean (Stoner et al., 1996) and reflect ice surges on the Hudson Strait Shelf that triggered turbiditic flows of eroded Paleozoic carbonates (Andrews et al., 1995). The recent increase of biogenic carbonates from 205 cm has been related to
the Bölling-Allerod warm event (Hillaire-Marcel et al., 1994b). The mean sedimentation rate is ~18 cm/ka. The clay mineralogy evolves from smectite-poor assemblages before the Bölling-Allerod to smectite-rich assemblage after, but the mean clay trend is disturbed by the repeated sandy detrital layers (Fagel et al., 1997). Since the LGM, the age model is based on both the oxygen isotope stratigraphy and eight 14C dates. As for PC 13, the calibrated ages have been interpolated from the curve of Stoner et al. (1998). Ten samples were selected between depths of 109 to 301 cm (19.2 to 8.5 kyr, Table 2). Five of these samples were recovered from three detrital carbonate-rich layers, respectively: the so-called detrital carbonate (DC) 1 related to HE 1, DC 0 related to HE 0 during the YD cold event, and a light detrital carbonate layer (see Stoner et al., 1996).
Fig. 1. Geographic map of the Northern North Atlantic showing coring sites in the Labrador Basin, major surface, deep current trajectories (modified from McCartney, 1992; Schmitz and McCartney, 1993; Dickson and Brown, 1994; Lucotte and Hillaire-Marcel, 1994), and structural terranes outcropping in the nearby continents (after Bridgewater et al., 1991; Kalsbeek et al., 1993; Campbell et al., 1996). See text for further explanations. PC 13 = piston core 90-013-013; PC 94 = piston core 91-045-094; DSO = Davis Strait overflow; DSOW = Denmark Strait overflow water; GC = Greenland current; ISOW = Iceland-Scotland overflow water; LC = Labrador current; LDW = lower deep water; NEADW = Northeast Atlantic deep water; NWADW = Northwest Atlantic deep water; NADW = North Atlantic deep water; NSOW = Norwegian Sea overflow water; WBUC = Western Boundary undercurrent; WTRO = Wyville Thompson Ridge overflow.
Table 1. Nd and Pb isotopic data from carbonate-free <2 µm material from piston core 90-013-013 on the Greenland Rise. Sample interval depth (cm) 14 C age (yr BP) Calibrated age (yr) 147 Sm/ 144 Nd 143 Nd/144Nd Є Nd 206Pb/ 204 Pb 207 Pb/ 204 Pb 208 Pb/ 204 Pb 207 Pb/ 206 Pb 208 Pb/ 206 Pb Stage 1 238-240 7790 8593 243-244 7837 8635 0.1205 0.511977 (04) -13.1 18.966 15.564 39.118 0.821 2.065 256-257 7972 8758 0.1212 0.511965 (15) -12.6 19.039 15.550 39.025 0.818 2.053 271-272 8128 8905 0.1220 0.512028 (11) -11.9 18.978 15.566 39.174 0.821 2.067 282-283 8243 9017 0.1196 0.511955 (12) -13.3 18.836 15.483 38.957 0.823 2.068 296-297 8388 9169 0.1144 0.511722 (05) -17.9 18.547 15.417 38.869 0.832 2.098 309-310 8523 9324 0.1167 0.511867 (07) -15.0 18.596 15.432 38.855 0.830 2.092 325-326 8689 9549 0.1160 0.511841 (06) -15.5 18.634 15.467 38.911 0.830 2.091 329-330 8731 9612 0.1189 0.511935 (09) -13.7 18.559 15.459 38.675 0.833 2.084 333-334 8773 9680 0.1166 0.511848 (05) -15.4 18.723 15.493 38.983 0.828 2.084 338-340 8830 9787 339-340 8840 9797 0.1181 0.511935 (08) -13.7 18.648 15.471 38.942 0.830 2.091 Duplicate 0.511896 (09) -14.5 343-344 8920 9879 0.1177 0.511931 (15) -13.8 18.732 15.512 38.991 0.829 2.084 347-348 9020 9961 0.1157 0.511801 (06) -16.3 18.712 15.507 38.753 0.829 2.074 352-353 9160 10064 — 0.511805 (05) -16.2 18.811 15.495 38.986 0.824 2.075 356-357 9200 10151 0.1118 0.511854 (26) -15.3 18.899 15.499 38.911 0.821 2.061 360-361 9390 10343 0.1199 0.512006 (05) -12.3 18.974 15.534 39.107 0.819 2.064 364-365 9710 10779 0.1204 0.511990 (08) -12.6 18.966 15.573 38.875 0.822 2.052 368-370 10040 11254 371-372 10098 11428 0.1175 0.511981 (05) -12.8 18.915 15.560 38.910 0.823 2.060 374-375 10157 11574 0.1194 0.512008 (06) -12.3 19.003 15.527 39.138 0.818 2.062 378-379 10235 11715 0.1159 0.511851 (08) -15.4 382-383 10313 11819 0.1127 0.511782 (09) -16.7 18.779 15.514 39.024 0.827 2.081 Duplicate 0.1124 0.511805 (08) -16.2 387-388 10410 11915 0.1155 0.511851 (15) -15.4 18.899 15.540 39.207 0.823 2.077 388-390 10430 11940 392-393 10546 11969 0.1153 0.5118763 (13) -15.1 18.819 15.522 38.946 0.825 2.072 397-398 10691 11996 0.1149 0.511897 (10) -14.5 18.637 15.454 38.631 0.830 2.075 Duplicate 0.1150 — — 401-402 10910 12169 0.1152 0.511829 (05) -15.8 18.764 15.487 38.952 0.826 2.078 406-407 11228 12562 0.1148 0.511900 (18) -14.4 18.831 15.492 39.065 0.823 2.077 410-411 11482 12888 0.1098 0.511697 (10) -18.4 18.775 15.493 39.079 0.826 2.085 414-415 11736 13193 0.1100 0.511649 (06) -19.3 18.732 15.483 38.954 0.827 2.082 418-419 11990 13465 0.1111 0.511694 (04) -18.4 18.639 15.497 38.671 0.832 2.077 Duplicate — 0.511681 (07) -18.7 424-425 12266 13830 0.1079 0.511639 (10) -19.5 18.717 15.419 38.858 0.824 2.078 428-429 12450 14040 0.1077 0.511615 (15) -20.0 18.662 15.517 38.934 0.832 2.089 Duplicate — 0.511639 (10) -19.5 434-435 12516 14148 0.1056 0.511528 (07) -21.7 18.727 15.485 39.128 0.827 2.092 439-440 12560 14297 0.1082 0.511648 (11) -19.3 18.750 15.517 39.004 0.828 2.083 443-444 13355 15132 0.1086 0.511632 (11) -19.6 18.874 15.516 39.180 0.822 2.079 Stage 2 448-449 14150 16137 0.1121 0.511773 (07) -16.9 18.822 15.493 38.834 0.824 2.066 Duplicate — 0.511781 (12) -16.7 466-467 15254 18220 0.1126 0.511790 (13) -16.5 18.537 15.447 38.854 0.834 2.099 478-480 16990 19600 479-480 17122 19796 0.1130 0.511736 (05) -17.6 18.544 15.469 38.729 0.835 2.091 490-491 18574 21338 0.1100 0.511689 (09) -18.5 18.687 15.481 38.843 0.829 2.081 497-498 19489 22395 0.1094 0.511635 (05) -19.6 18.590 15.462 38.840 0.832 2.092 508-510 20950 24016 529-530 22190 26064 0.1104 0.511621 (05) -19.8 18.809 15.505 39.138 0.825 2.083
Nd isotopic data have been reported in Fagel et al. (1999). Ages reported for each sample depth were estimated by direct linear interpolation of available AMS 14C ages (italics), assuming a constant sedimentation rate, since they are relatively constant over short time intervals (Hillaire-Marcel et al., 1994b). Then these interpolated ages were calibrated using the curve of Stoner et al. (1998). Details on AMS 14C
dating procedures can also be found in Hillaire-Marcel et al. (1994b). Sample 448-449 was collected within detrital-rich Heinrich-like layer HE1.
Table 2. Nd and Pb isotopic data from carbonate-free <2 µm material from piston core 91-045-094 on the Labrador Rise.
Sample interval depth (cm) 14 C age (years BP) Calibrated age (yr) 147 Sm/ 144 Nd 143 Nd/144Nd Є Nd 206Pb/ 204 Pb 207 Pb/ 204 Pb 208 Pb/ 204 Pb 207 Pb/ 206 Pb 208 Pb/ 206 Pb Stage 1 87.5-89.5 7260 7293 109-110 (DC) 7792 8485 0.1057 0.511462 (04) -22.9 18.889 15.558 39.218 0.824 2.079 123.5-125.5 8410 9316 129-130 (DC) 8573 9591 0.1033 0.511373 (07) -24.7 18.823 15.535 39.140 0.826 2.082 142-144 8960 10328 179-180 (DC: HE0-C0) 11395 12314 0.1003 0.511442 (08) -23.3 19.218 15.617 0.813 2.064 192-194 12250 13053 206-207 12850 13797 0.1057 0.511521 (05) -21.8 18.977 15.536 39.252 0.819 2.071 211-213 13060 14102 232-233 (DC HE1-C1) 13249 15248 0.0983 0.511471 (09) -22.8 18.831 15.570 39.017 0.827 2.075 239-240 (DC HE1-C1) 14000 15644 0.0966 0.511370 (06) -24.7 18.676 15.518 39.005 0.831 2.091 Stage 2 246-247 (DC HE1-C1) 14235 16040 0.0976 0.511416 (10) -23.2 18.755 15.498 38.902 0.826 2.076 254.5-256.5 14520 16551 259-260 14745 16782 0.1086 0.511701 (06) -18.3 18.773 15.525 38.895 0.828 2.074 286-287 16548 18341 0.1074 0.511709 (06) -18.1 18.772 15.548 38.916 0.829 2.076 291-293 16870 18662 301-302 17110 19216 0.1082 0.511689 (07) -18.5 18.587 15.517 38.777 0.835 2.089 328-330 17760 20576
Nd isotopic data have been reported in Fagel et al. (1999). Age estimation is similar to PC 13 (Table 1). Detrital carbonate layers have been correlated with Heinrich Layers of northern North Atlantic (see text for further explanations). Measured AMS 14C dates are in italics.
4. ANALYTICAL TECHNIQUES
Sm-Nd concentrations and Nd-Pb isotopic compositions were analyzed on the carbonate-free clay-size fraction. Sm-Nd data have been previously published (Fagel et al., 1999). After wet sieving, the <63-µm fraction was decarbonated in 0.1 N HCl. Excess acid was removed by washing and centrifuging. The <2-µm fraction was removed after a settling time estimated by Stokes's law (Fagel et al., 1997).
Analytical techniques for Sm-Nd have been described elsewhere (Innocent et al., 1997), and only a brief outline will be given here. After dissolution in HF-HNO3, Sm and Nd were separated by means of standard procedures (Richard et al., 1976). Sm and Nd were run on a VG Sector mass spectrometer. The accuracy of 147Sm/144Nd ratios is better than 2%. During the course of this study, 21 analyses of La Jolla standard gave an average value of 0.511849 ± 12 (2σ standard deviation). Duplicate analyses have been performed on some samples for both Sm and Nd concentration and for Nd composition. (Table 1). All duplicates fall within uncertainty, which is negligible considering the overall variation of Nd isotopic compositions. Total blanks were also considered negligible (lower than 150 pg for both Sm and Nd), and no blank correction has been carried out.
For Pb isotopes, ~20 mg of the clay-size fraction was dissolved in a HF-HNO3 mixture, evaporated to dryness, redissolved in a HNO3-HCl mixture, again evaporated, and finally dissolved in 0.8 N HBr. After chemical extraction on anion columns in an HBr environment (Manhès et al., 1978), Pb was loaded with silica gel and H3PO4 on a Re filament (e.g., Cameron et al., 1969). The Pb isotopic compositions were measured in static mode on a VG Sector 54 mass spectrometer at temperature steps ranging between 1350 and 1450°C as controlled by an optical pyrometer. During the course of the study, 27 analyses of NIST 981 standard gave average ratios of 206Pb/204Pb = 16.96, 207Pb/ 204Pb = 15.50, and 208Pb/204Pb = 36.70, with a typical 2σ standard deviation of 0.1‰ per amu, which reflects the stability of the measured NIST data during this study. However, when compared with the accepted value of the NIST standard (Todt et al., 1996), these raw data indicate a systematic shift of Pb isotopic ratios (especially 206Pb/204Pb) that cannot only result from mass fractionation, but was due to the evolution of the Faraday cup efficiencies through time. Consequently, Pb isotopic ratios have been corrected by -0.07%, -0.02%, and 0.001% per amu, respectively, to be normalized to the recognized value of the NIST 981 standard (Todt et al, 1996), taking into account both the mass fractionation and the cup bias. This latter has been corrected by comparison of our value to NIST 981 data obtained before on the same mass spectrometer under similar analytical conditions (Carignan and Gariépy, 1995). Because of the extremely low amount of material available, it has not been possible to conduct any duplicate analyses. For the same reason, it has not been possible to measure Pb concentrations before isotopic analyses for the same amount of lead to be loaded for all samples. Such uncertainties, though obviously higher than those that could have been derived from
high-precision Pb isotopic analyses remain low considering the whole Pb data set. Total blanks (lower than 100 pg) were considered negligible, and no blank correction has been conducted. The Pb results, together with previously published Sm-Nd data (Fagel et al., 1999) are reported in Table 1 (PC 13) and in Table 2 (PC 94).
5. RESULTS AND DISCUSSION 5.1. Pb Results
When compared with Sm-Nd data on the same samples (Fagel et al, 1999; also reported in Tables 1 and 2), a striking feature is that the Pb isotopic compositions are comparable from one core to another, as shown by downcore plots (Fig. 2): 18.537 < 206Pb/204Pb < 19.039, 15.432 < 207Pb/204Pb < 15.573, 38.631 < 208Pb/204Pb < 39.207 for PC 13; and 18.587 < 206Pb/204Pb < 19.218, 15.498 < 207Pb/204Pb < 15.570, 38.777 < 208Pb/204Pb < 39.318 for PC 94. Such Pb isotopic compositions plot slightly right of both the 4.57- and 4.45-Ga geochrons in the 207Pb/204Pb vs. 206Pb/204Pb diagram (Fig. 3a). In addition, they fall slightly below the two-stage evolution curve of Stacey and Kramers (1975). In the 208Pb/204Pb vs. 206Pb/204Pb diagram (Fig 3b), samples plot close to the Stacey and Kramers evolution curve. Clay-size fractions of Labrador Sea sediments display Pb isotopic compositions very different from fine (<63 µm) material extracted from Heinrich layers of the northern North Atlantic (Hemming et al., 1998). The Pb isotopic data can be also compared with Late Cenozoic (0 to 5 Ma) sediments from the nearby Arctic Ocean (Winter et al., 1997), which display Pb isotope characteristics typical of the estimated upper continental crust (see Hemming and McLennan, 2001, and references therein). Clay-size fractions of northern North Atlantic deep-sea sediments have slightly but significantly lower 207Pb/204Pb ratios.
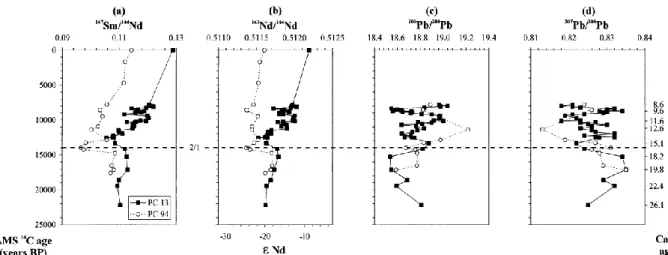
Fig. 2. Record of (a) 147Sm/144Nd, (b) 143Nd/144Nd, (c) 206Pb/204Pb, and (d) 207Pb/206Pb ratios through time, for both PC 13 and PC 94. (a) and (b) are also available in Fagel et al. (1999). Isotopic compositions are reported as a function of the estimated age of deposition—that is, ages reported for each sample depth were estimated by linear interpolation between two AMS 14C dates (see also Tables 1 and 2). Calendar ages are reported on the right side of the plot. The isotopic stage 2/1 boundary is marked by the dashed line. Sm-Nd data obtained on surface sediments (Innocent et al., 1997) have also been plotted.
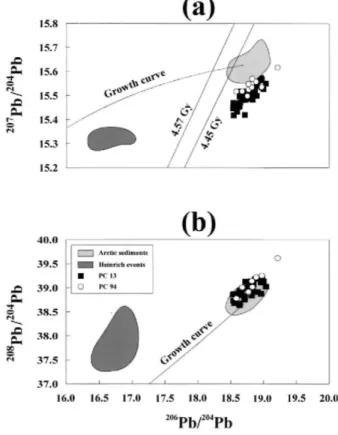
Fig. 3. (a) 207Pb/204Pb-206Pb/204Pb and (b) 208Pb/204Pb-206Pb/204Pb isotopic diagrams for PC 13 (black squares) and PC 94 (open circles) samples. Light gray fields correspond to Pb isotopic data obtained on Late Cenozoic sediments from the nearby Arctic Ocean (Winter et al., 1997), whereas darker gray fields correspond to available whole-rock Pb data on ice-rafted deposits (Heinrich layers) from the northern North Atlantic (Hemming et al., 1998). Both growth curves have been calculated according to the two-stage model of Stacey and Kramers (1975). Also, two geochrons have been plotted at 4.57 Gyr and 4.45 Gyr, corresponding, respectively, to the age of the oldest meteorites (e.g., Allègre et al., 1995) and to the youngest possible age of the Earth (Zhang, 1998). It is shown in both diagrams that clay-size sediments from PC 13 and even PC 94 display Pb isotopic characteristics completely different from the Heinrich layers.
5.2. Potential Source Areas
5.2.1. Sm-Nd Systematics
On the basis of both geology and Sm-Nd systematics, four potential sources were distinguished (Innocent et al., 1997; Fagel et al., 1999): (1) the mid-Atlantic volcanism providing mantlelike Nd and high Sm/Nd; (2) Lower Paleozoic material derived from the denudation of the pan-African orogen, outcropping in northwestern Europe, northeastern Greenland and also in Scandinavia; (3) Upper and post-Paleozoic material related to the Variscan orogeny, with Sm-Nd signatures comparable to the Lower Paleozoic material; and finally (4) North American Shield-derived material. In the two articles cited above, Sm-Nd signatures of these end members were characterized after a statistical study based on published data sets, except for the North American Shield, for which the average signatures were deduced from data on surface deep-sea sediments (Innocent et al., 1997). For both the Lower Paleozoic material of NW Europe and the Upper to post-Paleozoic material, only shale and greywacke data, which best average the Sm-Nd signature of a structural terrane (Goldstein et al., 1984), were considered. For the mid-Atlantic volcanism, we considered that the best estimate of the Sm-Nd characteristics is the median, rather than the mean, as the contribution of some minor rocks (rhyolites, etc.) is highly overestimated in the overall published data set. Because we are tracing the sources of past sediments by use of present-day end members, we believe this approach is more reliable than the use of present-day shelf or riverine sediments. This is because local and rapid changes in sediment supplies often affect these depositional environments and the Sm-Nd signature of a structural terrane is not expected to vary within the short period of time considered here.
In this article, we compare this data set Sm-Nd average signatures of the three different terranes constituting the Scandinavian peninsula (Paleozoic rocks, Sveconorwegian terrane of Proterozoic, and the older Scandinavian Shield). In addition, terranes constituting the North American Shield, which includes a large variety of structural units (Bridgewater et al., 1991; Kalsbeek et al., 1993, and references therein; Campbell et al., 1996, and references therein), have been distinguished and handled separately. Unfortunately, no shale or greywacke data
is available for these terranes. Thus, rocks as representative as possible of typical upper continental crust were selected (in most cases, granitoïds having Si <70%).
5.2.2. Pb Isotopes
Lead isotopic data help us to better discriminate the different geographic source areas of a given structural terrane that have comparable Sm-Nd isotopic signatures. For the European source areas only shale and greywacke data have been taken into account. As for Sm-Nd, the three different terranes constituting the Scandinavian peninsula, as well as the different surrounding terranes constituting the North American Shield, have been handled separately and characterized for their average Pb isotopic compositions (Table 3).
It should be kept in mind that the geochemical behavior of Pb during the sedimentary cycle is markedly different from Sm-Nd. From the craton to the ocean, Pb is mainly carried by river-suspended loads. It is now known that the Pb isotopic compositions of the suspended loads do not always reflect those of the cratons from which they originate (Asmeron and Jacobsen, 1993; Allègre et al., 1996). However, Nd and Pb isotopes are correlated in suspended loads of rivers draining postarchean areas, providing indication that in this case, the Pb isotopic data reflect the isotopic composition of the average crustal source rocks (Asmeron and Jacobsen, 1993). For rivers draining archean shields, the lack of Nd-Pb correlation (Asmeron and Jacobsen, 1993) indicates that the isotopic composition of Pb that is provided to the oceans is different from that of the source rocks. Thus, Pb isotopes measured in suspended loads from some West Greenland rivers (Asmeron and Jacobsen, 1993) have also been reported in Table 3.
Another important problem that has been raised (von Blanckenburg, 1999; von Blanckenburg and Nägler, 2001) is that glacial weathering processes release incongruently a labile fraction of strongly radiogenic Pb from old cratons into the ocean. However, von Blanckenburg and Nägler (2001) suggested that the nonlabile Pb should have an isotopic composition close to that of the bulk rock because of the very low amount of labile Pb. In this context, clay-size fractions of deep-sea sediments should be considered as "residues". Moreover, if they would be affected by the incongruent release of Pb, then major Pb isotopic shifts should be expected between cold (i.e., LGM, YD) and warm (i.e., Bolling-Alleröd) climatic episodes. As it is not the case here (Fig. 2), we consider that this effect is not significant.
Table 3. Nd and Pb isotopic signature for regional end-members.
Potential end members Variable 147Sm/
144Nd 143 Nd/ 144Nd 206 Pb/ 204Pb 207 Pb/ 204Pb 208 Pb/ 204Pb 207 Pb/ 206Pb 208 Pb/ 206Pb
Mid-Atlantic volcanism Number of data 52 77
Mean 0.1877 0.513006 18.641 15.515 38.308 0.841 2.076 Median 0.1756 0.512997 18.490 15.495 38.278 0.839 2.067 Europe
Variscan crust Number of data 17 12
Mean 0.1144 0.512080 18.840 15.702 39.024 0.834 2.072 Median 0.1151 0.512074 18.891 15.723 39.135 0.831 2.072 Pan-African crust Number of data 57 12
Mean 0.1171 0.512045 18.950 15.549 38.709 0.821 2.044 Median 0.1154 0.512037 18.772 15.529 38.562 0.829 2.058 Scandinavia
Sveconorwegian belt Number of data 15 38
Mean 0.1257 0.512044 18.925 15.633 39.755 0.833 2.541 Median 0.1199 0.511980 17.981 15.556 38.276 0.864 2.458 Pan-African crust Number of data 19 36
Mean 0.1052 0.512137 18.451 15.604 38.250 0.846 2.073 Median 0.1042 0.512160 18.419 15.602 38.201 0.847 2.072 Scandinavian shield Number of data 19
Mean 0.1153 0.511588 Median 0.1122 0.511525 Greenland
Pan-African crust Number of data 3
Mean 18.596 15.594 38.895 0.839 2.092 Median 18.388 15.598 38.870 0.848 2.107 Ketilidian belt Number of data 21 64
Mean 0.1135 0.511697 21.236 15.624 39.084 0.757 1.890 Median 0.1137 0.511699 20.816 15.653 39.115 0.754 1.863 Naqssuqtoqidian belt Number of data 18 212
Mean 0.1009 0.511046 16.673 14.920 37.935 0.950 2.363 Median 0.1007 0.510973 15.227 14.692 36.164 0.966 2.362 Archean craton Number of data 11 97
Mean 0.0894 0.510671 14.914 14.738 35.646 1.003 2.430 Median 0.0916 0.510699 14.417 14.755 35.300 1.028 2.428 Early Archaean gneisses Number of data 109 11
Mean 0.1310 0.510989 12.600 13.902 35.527 1.104 2.584 Median 0.1195 0.510738 12.366 13.785 32.290 1.114 2.607 Baffin Island Number of data 2
Mean 0.9925 0.510925 Median
Labrador
Early Archaean gneisses Number of data 9
Mean 13.200 14.070 34.202 1.067 2.595 Median 13.115 14.045 33.709 1.075 2.651 Nain province Number of data 15
Mean 15.684 14.618 36.894 0.939 2.375 Median 15.986 14.548 36.825 0.925 2.395 Southern Canada
Grenvillian belt Number of data 9
Mean 16.805 15.428 36.403 0.919 2.168 Median 16.867 15.416 36.449 0.914 2.164 Trans-Hudsonian orogen Number of data 34 59
Mean 0.1215 0.511828 19.263 15.610 38.202 0.834 2.031 Median 0.1105 0.511761 18.440 15.520 37.450 0.840 2.062 Superior province Number of data 86 81
Mean 0.1122 0.511200 25.526 16.657 44.515 0.711 1.852 Median 0.1056 0.511068 22.719 16.226 42.301 0.714 1.835 West Greenland Rivers Number of data 6 2
Mean 0.0940 0.509676 17.265 14.733 37.553 0.854 2.176 Median 0.0945 0.509658
Data for mid-Atlantic volcanism, Variscan belt, Panafrican crust of northwestern Europe and Scandinavan shield have been previously reported in Fagel et al. (1999). Data for West Greenland rivers are from Goldstein and Jacobsen (1987; 1988) and Asmeron and Jacobsen (1993). Data for Canadian Shield Composite are from McCulloch and Wasserburg (1978)). For the newly defined end-members it was not always possible to carry out a statistical treatment, especially as Nd and Pb isotopes have not been always measured on the same samples. This hinders normalizing calculations. For clarity, only simple means and medians have been reported. These two parameters are considered to give a good indication of the uncertainty of the end-member signature. In spite of the very low number of available Pb isotopic data, the Panafrican crust of northeastern Greenland is found to have Pb isotopic signatures clearly different from other Phanerozoic crustal terranes.
5.2.3. Eolian Input
Finally, we would like to address in a few words the problem of airborne particles. It is unlikely that aerosols contribute significantly to the isotopic signature of clay-size fraction of Labrador deep-sea sediments. First, in the northern North Atlantic Ocean, deep-sea clays are considered to be mainly transported by bottom currents (Biscaye, 1965). Indeed, Biscaye reported that the topographic control over (clay) mineral distribution by the Mid-Atlantic Ridge precludes significant eolian transport by the jet stream. Second, mineralogical data on surface sediments do not favor the hypothesis of an aeolian transport (Fagel et al., 1996). Third, ocean waters are at present thermally stratified, which inhibits vertical exchange processes in the water column (Véron et al., 1993). As waters were not stratified during the LGM (Hillaire-Marcel et al., 1994b), a huge aeolian input should be expected and recorded by Nd and Pb isotopes, especially as the amount of airborne particles was much higher during the LGM (Thompson and Mosley-Thompson, 1981). Because there is no evidence for such an input in our data, we consider that if it exists, the eolian contribution is negligible.
5.3. Sources of the Clay-Size Fraction of Sediments and Their Evolution since the LGM
The Nd-Pb data obtained in the two cores allow us to propose a reconstruction of sedimentary input during the last deglaciation. However, most of the information is derived from PC 13 because of the relatively large number of analyses available. Moreover, PC 94 contains a greater influence from ice-rafted detritus than PC 13 and available isotope data are scarce. As such, data from the two cores will not be discussed separately.
5.3.1. North American Shield
It has been concluded on the basis of Sm-Nd signatures alone that clay-size sediments from both piston cores are strongly influenced by the input from the North American Shield (i.e., Fagel et al., 1999). In this study, Nd-Pb data on West Greenland river suspended loads (Goldstein and Jacobsen, 1987, 1988; Asmeron and Jacobsen, 1993) have been considered as the most reliable North American Shield end member. Indeed, the Pb isotopic
signature seems to constitute a reasonable mean of the different surrounding Precambrian cratons (Table 3). However, the Nd isotopic composition of these river loads is slightly but significantly less radiogenic than those of Precambrian rocks. Such very low Nd isotopic compositions (lower than 0.5100, Table 3) result probably from the fact that these rivers drain old, archean material (Isua gneisses), whereas the North American Shield also includes younger, Proterozoic terranes.
Comparing Nd and Pb isotopic compositions (Fig. 4) produces a striking feature as the North American Shield does not constitute a major source of material in clay-size fractions. Most of the sedimentary supplies come from younger Phanerozoic areas (Table 3, Fig. 4). Clearly, this is enhanced by the very low Nd isotopic composition of the end member we have chosen (i.e., river loads, mean of 0.509676; Table 3), but the same result would be also derived with the average isotopic compositions of the Precambrian terranes (Table 3).
Calculated mixing lines between the North American Shield end member (represented by data on West Greenland river loads) and different possible younger crustal terranes are drawn on Figures 4, 5, and 6. They indicate that at least another Precambrian end member should be involved to explain the Nd-Pb data set. This is particularly evident for PC 94, but also, at a lesser degree, for a number of PC 13 samples (Figs. 4b and 5b). Such a source should have high µ value, but none of the two high µ Precambrian terranes that have been defined (Ketilidian belt of southern Greenland and western Superior province, Table 3) fits the data. Obviously, there are many terranes of the North American Shield that have not been studied yet for Pb isotopes. In this area, however, the only terrane for which Nd-Pb data are available (the trans-Hudsonian orogenic belt; Table 3) does not constitute a good candidate. This undefined source is best emphasized in deglacial samples from PC 94 that are all strongly influenced by ice rafted deposits. These samples all fall within the DCLs, which likely originate from the Hudson Bay area and would be related to local instabilities of the Laurentide ice sheet during the last deglaciation (e.g., Andrews et al., 1995). This high µ Precambrian source may originate from the undifferentiated Churchill province of Baffin Island, or from the Hudson Bay (Fig. 1).
5.3.2. Mid-Atlantic Volcanism
The mid-Atlantic volcanism is at present an important source of clay-size material at the inlet of the Labrador Sea (Innocent et al., 1997). During stage 2, its relative contribution was strongly reduced, although it probably did not disappear completely (Fagel et al., 1999). It was suggested on the basis of the Sm-Nd study (Fagel et al., 1999) that after a decrease down to zero 14.3 ky ago, it increased significantly until now, marking the initiation of the modern deep circulation gyre through the northern North Atlantic. However, Pb isotopes do not support these conclusions, as shown by Figures 4 and 5. The increase of both the 147Sm/144Nd and the Nd isotopic ratios results from the input of material from young Phanerozoic pieces of crust (this point is discussed in detail in the following paragraph). Also, it is worth noting that all deglacial samples provide Nd isotopic ratios that are not higher than those of the average Phanerozoic crustal end members, unlike surface samples for which the mid-Atlantic volcanism contribution is evident (Innocent et al., 1997).
5.3.3. Phanerozoic Crustal Terranes
The Pb isotopic data (reported in Table 3) indicate that the different pieces of crust made of Paleozoic rocks related to the denudation of the pan-African orogen display distinct signatures, allowing us to discriminate the different source areas providing young Phanerozoic crustal material. This discrimination was not possible or at least difficult on the basis of Sm-Nd data only. The pan-African crust of northwestern Europe is isotopically different from that of Scandinavia (Table 3). The pan-African crust of northeastern Greenland displays Pb isotopic compositions slightly different from the two others. Upper and post-Paleozoic material from Western Europe (from hereon reported as "Variscan crust") displays higher 207Pb/ 204Pb and 207Pb/206Pb ratios than Lower Paleozoic material from Northwestern Europe or Northeastern Greenland (further reported as "pan-African crust"). This potentially allows us to discriminate between the different source-areas of pan-African material, on the basis the hypothesis that Pb isotopic compositions of Phanerozoic source rocks are not shifted during weathering, erosion and riverine transport (see above).
Fig. 5 indicates that the main source that contributes to deglacial sedimentary input is the pan-African crust of northwestern Europe. This is an important result because the pan-African crust of northeastern Greenland, which is driven by the DSOW, is at present the major source of clay-size sediments of offshore Greenland (Innocent et al., 1997). In particular, post-YD PC 13 samples that are not related to the so-called 8.5-ka BP event indicate that the only significant input of crustal Phanerozoic material during the early Holocene would come from the pan-African terranes of northwestern Europe (Figs. 5 and 6). This would indicate that, during stage 1, there was no overflow through the Denmark Strait before 8.6 kyr. According to Ruddiman and McIntyre (1981), this site was deglaciated after 10 ka BP (end of the YD), this is to say more than 1500 yr before. No influence of the pan-African crust of Scandinavia has been recognized, in agreement with Sm-Nd data (Figs. 4b and 5). In any case, this would probably have also supplied material originating from the Sveconorwegian terrane, which has peculiar Pb characteristics and would have been enhanced by Pb isotopes (Table 3). Moreover there is no
evidence for an input of European Variscan material during the early Holocene, which indicates that Phanerozoic material was not transported at that time by the Lower Deep Water through the Charlie-Gibbs Fracture Zone (Fig. 1). Rather, this suggests that it has been driven from the Norwegian Sea by the North East Atlantic Deep Water, through the Wyville Thompson Ridge rather than through the Iceland-Scotland Ridge, as suggested by the absence of mid-Atlantic volcanism material. This is consistent with paleomagnetic data (Kissel et al., 1997).
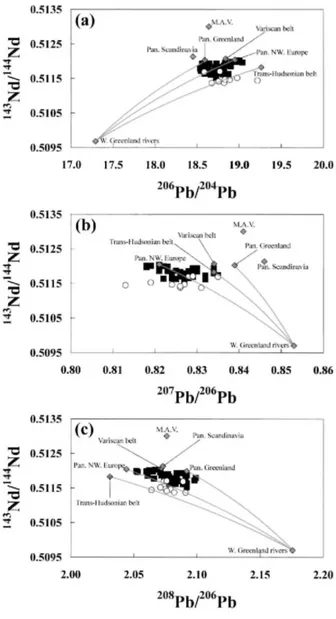
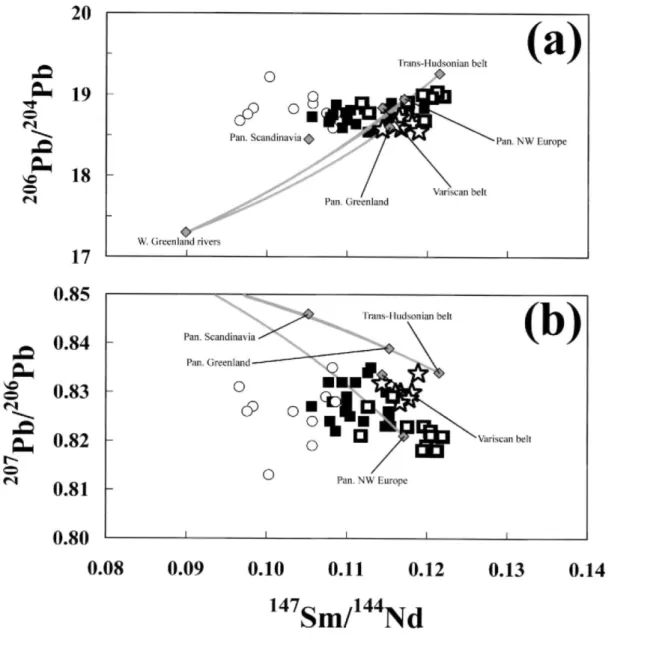
Fig. 4. Nd-Pb isotopic diagrams for (a) 206Pb/204Pb, (b) 207Pb/206Pb, and (c) 208Pb/206Pb. Symbols are the same as in Fig. 3. Potential end members are plotted as gray diamonds. MAV = mid-Atlantic volcanism (north of the Charlie Gibbs fracture zone). Bold gray curves represent a two-end-member mixing between a high 143Nd/144Nd component (achieved for Phanerozoic upper crusts of northwestern Europe and northeastern Greenland and for the trans-Hudsonian orogenic belt) and a Precambrian crust, represented by Nd-Pb data on West Greenland River suspended loads (Table 3). Calculations have been conducted by the simple mean. When considering the mean and the median for each end member (Table 3), it is easy to see that the uncertainty on each end member is low considering overall Nd-Pb data. For the pan-African crust of northeastern Greenland, because no Sm-Nd data are available, we have arbitrarily taken the isotopic ratios of Goldstein et al. (1984): 147Sm/144Nd = 0.115, 143Nd/144Nd = 0.51204. Such values are believed to represent a good estimation of this piece of crust, as indicated by Sm-Nd signatures of other pan-African terranes (Table 3).
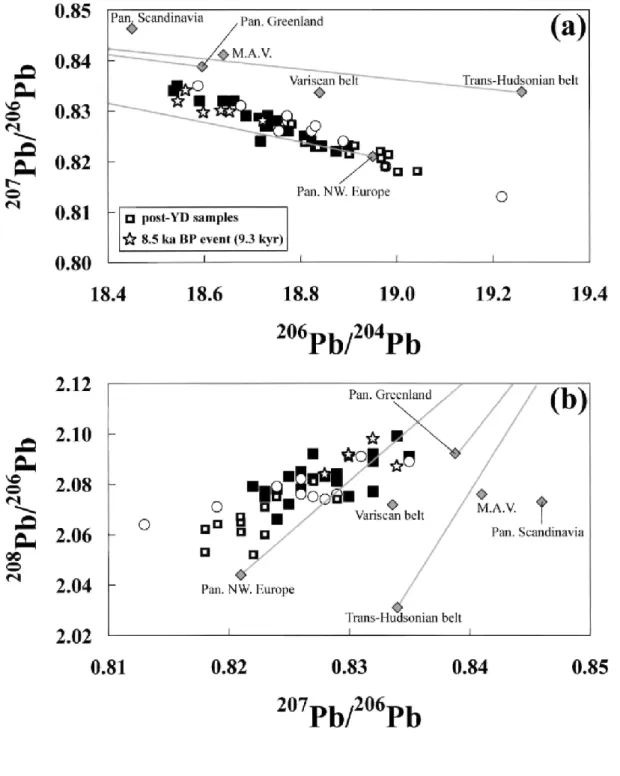
Fig. 5. 207Pb/206Pb-206Pb/204Pb diagram for PC 13 (black squares) and PC 94 (open circles) samples. Symbols are the same
as in Fig. 3. Post-YD and 8.5-ka BP samples from PC 13 have been distinguished. Mixing curves between the same end members as in Fig. 4 are represented. Because the two panels are Pb-Pb correlation diagrams, the mixing curves are straight lines. Holocene samples from PC 13 are slightly shifted toward the Phanerozoic end member compared with upper Pleistocene and 8.5-ka BP samples (9.3 kyr, calibrated age). The only mixing lines that plot on (or very close to) the PC 13/PC 94 domain are those featuring the pan-African crust of northwestern Europe.
Fig. 6. (a) 147Sm/144Nd-206Pb/204Pb and (b) 147Sm/144Nd-207Pb/206Pb diagrams. Symbols are the same as in Fig. 5. Mixing curves between the same end members as in Fig. 3 are represented.
6. CONCLUSION
The sources of the clay-size fraction of deep-sea sediments from the Labrador Sea since the LGM have been better constrained by using Pb isotopes, in conjunction with previously obtained Sm-Nd data. As a whole, Nd-Pb data imply two distinct major sources. The first is the Precambrian shield of North America. Most of this material comes from the Archean and/or Paleoproterozoic terranes. Deglacial samples from Orphan Knoll, influenced by ice-rafted deposits imply additional Precambrian sources (which are likely related to those in the Hudson Bay area, the Baffin area, or both).
The other major sediment source is constituted by Phanero-zoic upper crustal material. The Pb isotopes indicate that most of this input originates from Lower Paleozoic terranes of northwestern Europe. Mid-Atlantic volcanism has not been found to contribute significantly to the deglacial deep-sea sediments of the Labrador Sea. The contribution of other possible Phanero-zoic structural units is at the best minor, and becomes less significant for early Holocene samples of the Greenland Rise. This indicates that the "young" Phanerozoic material was mainly driven by the North East Atlantic Deep Water from the Norwegian Sea through the Wyville Thompson Ridge. No evidence has been found for an early overflow through the Denmark Strait during the final step of the last deglaciation (9 to 8.5 kyr). It follows that the modernlike circulation, typical of interglacial periods (at least for isotopic stage 3; Kissel et al., 1999), was active recently (<8.5 kyr calendar age) under a warm climate. This hypothesis is consistent with results derived from short-lived isotopic data (Veiga-Pires and Hillaire-Marcel,
1998) and fine clay mineralogical data (Fagel et al., 2001). Acknowledgments
We thank Dr. B. Peucker-Ehrenbrink, S. R. Hemming, and C. R. Neal for their constructive reviews of the article in manuscript. This work was supported by the Natural Sciences and Engineering Research Council of Canada (award to N.F.). The English text has been kindly improved by J. Scoates.
REFERENCES
Allègre C. J., Manhès G., and Gopel C. (1995) The age of Earth. Geochim. Cosmochim. Acta 59, 1445-1456.
Allègre C. J., Dupré B., Négrel P., and Gaillardet J. (1996) Sr-Nd-Pb isotope systematics in Amazon and Congo River systems: Constraints about erosion processes. Chem. Geol. 131, 93-112.
Andrews J. T., McLean B., Kerwin M., Manley W., Jennings A. E., and Hall F. (1995) Final stages in the collapse of the Laurentide ice sheet, Hudson Strait, Canada, NWT: 14C AMS dates, seismic stratigraphy and magnetic susceptibility logs. Quat. Sci. Rev. 14, 983-1004. Andrews J. T., Cooper T. A., Jennings A. E., Stein A. B., and Erlenkeuser H. (1998) Late Quaternary iceberg-rafted detritus events on the Denmark Strait—Southeast Greenland continental slope (~65°N): Related to North Atlantic Heinrich events? Mar. Geol. 149, 211-228. Asmeron Y. and Jacobsen S. B. (1993) The Pb isotopic evolution of the Earth: Inferences from river water suspended loads. Earth Planet.
Sci. Lett. 115, 245-256.
Bilodeau G.(1994) Paléoécologie des foraminifères benthiques et paéocéanographie de la Mer du Labrador au cours du Quaternaire récent. Ph.D. dissertation. UQAM.
Biscaye P. E. (1965) Mineralogy and sedimentation of recent deep-sea clay in the atlantic Ocean and adjacent seas and oceans. Geol. Soc.
Am. Bull. 76, 803-832.
Boyle E. A. (1995) Last-glacial-maximum North Atlantic deep water: On, off or somewhere in between? Phil. Trans. R. Soc. London Ser. A 348, 243-253.
Bridgewater D., Marker M., and Mengel F. (1991) The eastern extension of the early Proterozoic orogenic zone across the Atlantic. Rep.
ECSOOT Transect Mtng. 34, 100-107.
Broecker W. S. and Denton G. H. (1989) The role of ocean-atmosphere reorganization in glacial cycles. Geochim. Cosmochim. Acta 53, 63-89.
Broecker W. S., Bond G., and Klas M. (1990) A salt oscillator in the Glacial Atlantic? 1. Concepts. Paleoceanography 5, 459-467. Cameron A. G. W., Smith D. H., and Walker R. L. (1969) Mass spectrometry of nanogram size samples of lead. Anal. Chem. 41, 525-526. Campbell L. M., Bridgewater D., and Farmer G. L. (1996) A comparison of Proterozoic crustal formation along the Torngat-Naqssqtoqidian-Lapland collision belts: Preliminary constraints from Nd and Pb isotopic studies in Northern Labrador. Rep. ECSOOT Transect Mtng. 45, 22-36.
Carignan J. and Gariépy C. (1995) Isotopic composition of epiphytic lichens as a tracer of the sources of atmospheric lead emissions in southern Quebec, Canada. Geochim. Cosmochim. Acta 59, 4427-4443.
Dia A., Dupré B., and Allègre C. J. (1992) Nd isotopes in Indian Ocean used as a tracer of supply to the ocean and circulation paths. Mar.
Geol. 103, 349-359.
Dickson R. R. and Brown J. (1994) The production of North Atlantic deep water: Sources, rates, and pathways. J. Geophys. Res. 99, 12319-12341.
Fagel N., Robert C, and Hillaire-Marcel C. (1996) Clay mineral signature of the NW Atlantic Boundary Undercurrent. Mar. Geol. 130, 19-28.
Fagel N., Hillaire-Marcel C, and Robert C. (1997) Changes in the Western Boundary undercurrent outflow since the last glacial maximum, from smectite/illite ratios in deep Labrador Sea sediments. Paleoceanography 12, 79-96.
Fagel N., Innocent C, Stevenson R. K., and Hillaire-Marcel C. (1999) Deep circulation changes in the Labrador Sea since the last glacial maximum: New constraints from Sm-Nd data on sediments. Paleoceanography 14, 777-788.
Fagel N., Robert C, Preda M., and Thorez J. (2001) Smectite composition as a tracer of deep circulation: The case of the northern North Atlantic. Mar. Geol. 172, 309-330.
Goldstein S. L. and O'Nions R. K. (1981) Nd and Sr isotopic relationships in pelagic clays and ferromanganese deposits. Nature 292, 324-327.
Goldstein S. L., O'Nions R. K., and Hamilton P. J. (1984) A Sm-Nd isotopic study of atmospheric dust particulates from major river systems.
Earth Planet. Sci. Lett. 70, 221-236.
Goldstein S. J. Jacobsen S. B. (1987). The Nd and Sr isotopic system-atics of river-water dissolved material: Implications for the sources of Nd and Sr in seawater. Chem. Geol. 66:2454-272.
Goldstein S. J. and Jacobsen S. B. (1988) Nd and Sr isotopic system-atics of river water suspended material: Implications for crustal evolution. Earth Planet. Sci. Lett. 87, 249-265.
Grousset F. E., Labeyrie L., Sinko J. A., Cremer M., Bond G., Duprat J., Cortijo E., and Huon S. (1993) Patterns of ice-rafted detritus in the glacial North Atlantic (40°-55°N). Paleoceanography 8, 175-192.
ice-rafted debris in Heinrich layer 2. Paleoceanography 11, 77-93.
Gwiazda R. H., Hemming S. R., and Broecker W. S. (1996b) Provenance of icebergs during Heinrich event 3 and the contrast to their sources during the other Heinrich episodes. Paleoceanography 11, 371-378.
Hemming S. R., Broecker W. S., Sharp W. D., Bond G. C, Gwiadza R. H., McManus J. F., Klas M., and Hadjas I. (1998) Provenance of Heinrich layers in core V28-82, northeastern Atlantic: 40Ar/39Ar ages of ice-rafted hornblende, Pb isotopes in feldspar grains, and Nd-Sr-Pb
isotopes in the fine sediment fraction. Earth Planet. Sci. Lett. 164, 317-333.
Hemming S. R., Gwiazda R. H., Andrews J. T., Broecker W. S., Jennings A. E., and Onstott T. (2000) 40Ar/39Ar and Pb-Pb study of individual hornblende and feldspar grains from southeastern Baffin Island glacial sediments: Implications for the provenance of the Heinrich layers. Can. J. Earth Sci. 37, 879-890.
Hemming S. R. and McLennan S. M. (2001) Pb isotope composition of modern deep sea turbidites. Earth Planet. Sci. Lett. 184, 489-503. Hillaire-Marcel C, De Vernal A., Lucotte M., Mucci A., Bilodeau G., Rochon A., Vallières S., and Wu G. ((1994a)) Productivité et flux de carbone dans la Mer du Labrador au cours des derniers 40 000 ans. Can. J. Earth Sci. 31, 139-158.
Hillaire-Marcel C, De Vernal A., Bilodeau G., and Wu G. (1994b) Isotope stratigraphy, sedimentation rates, deep circulation and carbonate events in the Labrador Sea during the last~200 ka. Can. J. Earth Sci. 31, 63-89.
Innocent C, Fagel N., Stevenson R. K., and Hillaire-Marcel C. (1997) Sm-Nd signature of modern and late Quaternary sediments from the northwest North Atlantic: Implications for deep current changes since the last glacial maximum. Earth Planet. Sci. Lett. 146, 607-625. Innocent C, Fagel N., and Hillaire-Marcel C. (2000) Sm-Nd isotope systematics in deep-sea sediments: Clay size versus coarser fractions.
Mar. Geol. 168, 79-87.
Kalsbeek F., Austrheim H., Bridgewater D., Hansen B. T., Pedersen S., and Taylor P. N. (1993) Geochronology of Archaean and Proterozoic events in the Ammassalik area, south-east Greenland, and comparisons with the Lewisian of Scotland and the Nagssugtoqidian of West Greenland. Precamb. Res. 62, 239-270.
Kissel C., Laj C., Lehman L., Labeyrie L., and Bout-Roumazeilles V. (1997) Changes in the strength of the Iceland Scotland Overflow Water in the last 200,000 years: Evidence from magnetic anisotropy analysis of core Su90-33. Earth Planet. Sci. Lett. 152, 25-36.
Kissel C., Laj C., Labeyrie L., Dokken T., Voelker A., and Blamart D. (1999) Rapid climatic variations during marine isotopic stage 3: Magnetic analysis of sediments from Nordic Seas and North Atlantic. Earth Planet. Sci. Lett. 171, 489-502.
Ledbetter M. T. and Balsam W. M. (1985) Paleoceanography of the deep Western Boundary undercurrrent on the North American continental margin for the past 25000 yr. Geology 13, 181-184.
Lucotte M. and Hillaire-Marcel C. (1994) Identification des masses d'eau dans les mers du Labrador et d'lrminger. Can. J. Earth Sci 31, 5-13. Manhès G., Minster J. F., and Allègre C. J. (1978) Comparative uranium-thorium-lead and rubidium-strontium study of the Saint-Séverin amphoterite: Consequences for early solar system chronology. Earth Planet. Sci. Lett. 39, 14-24.
McCartney M. S. (1992) Recirculating components to the deep boundary current of the northern North Atlantic. Progr. Oceanogr. 29, 283-383.
McCave I. N., Manighetti B., and Beveridge N. A. S. (1995) Circulation in the glacial North Atlantic inferred from grain-size measurements.
Nature 374, 149-151.
McCulloch M. T. and Wasserburg G. J. (1978) Sm-Nd and Rb-Sr chronology of continental crust formation. Science 200, 1003-1011. McLennan S. M., McCulloch M. T., Taylor S. R., and Maynard J. B. (1989) Effects of sedimentary sorting on neodymium isotopes in deep-sea turbidites. Nature 337, 547-549.
Revel M., Sinko J. A., Grousset F. E., and Biscaye P. E. (1996a) Sr and Nd isotopes as tracers of North Atlantic lithic particles: Paleoclimatic implications. Paleoceanography 11, 95-113.
Revel M., Cremer M., Grousset F. E., and Labeyrie L. (1996b) Grain-size and Sr-Nd isotopes as tracer of paleo-bottom current strength, Northeast Atlantic Ocean. Mar. Geol. 131, 233-249.
Richard P., Shimizu N., and Allègre C. J. (1976) 143Nd/146Nd: A natural tracer, an application to oceanic basalts. Earth Planet. Sci. Lett. 31,
269-278.
Ruddiman W. F. and McIntyre A. (1981) The North Atlantic Ocean during the last deglaciation. Palaeogeogr. Palaeoclimatol. Palaeo-ecol. 35, 145-214.
Schmitz W. J. and McCartney M. S. (1993) On the North Atlantic circulation. Rev. Geophys. 31, 29-49.
Stacey J. S. and Kramers J. D. (1975) Approximation of terrestrial lead isotope evolution by a two-stage model. Earth Planet. Sci. Lett. 26, 207-221.
Stoner J. S., Channell J. E. T., and Hillaire-Marcel C. (1996) The magnetic signature of rapidly deposited detrital layers from the deep Labrador Sea: Relationship to North Atlantic Heinrich layers. Pale-oceanography 11, 309-325.
Stoner J. S., Channell J. E. T., and Hillaire-Marcel C. (1998) A 200 kyr geomagnetic chronostratigraphy for the Labrador Sea: Indirect correlation of the sediment record to SPECMAP. Earth Planet. Sci. Lett. 159, 165-181.
Thompson L. G. and Mosley-Thompson E. (1981) Microparticle concentration variations linked with climatic change: Evidence from polar ice cores. Science 212, 812-815.
Todt W., Cliff R. A., Hanser A., and Hofman A. W. (1996) Evaluation of a 202Pb-205Pb double spike for high-precision lead isotope analysis.
In: Earth Processes, Reading the Isotopic Code (eds. A. Basu and S. R. Hart), pp. 429-437. AGU.
paléocéanographiques et la paléoproductivité du bassin. Ph.D. dissertation. UQAM.
Veiga-Pires C. C. and Hillaire-Marcel C. (1998) U and Th isotope constraints on the duration of Heinrich events H0-H4 in the southern Labrador Sea. Paleoceanography 14, 187-199.
Véron A. J., Church T. M., Paterson C. C., and Flegal A. R. (1993) Use of stable isotopes to characterize the sources of the anthropogenic lead in the North Atlantic surface waters. Geochim. Cosmochim. Acta 58, 3199-3206.
von Blanckenburg F. (1999) Tracing past ocean circulation? Science 286, 1862-1863.
von Blanckenburg F. and Nägler T. F. (2001) Weathering versus circulation-controlled changes in radiogenic isotope tracer composition of the Labrador Sea and North Atlantic deep water. Paleoceanography 16, 424-434.
Vroon P. Z., Van Bergen M. J., Klaver G. J., and White W. M. (1995) Strontium, neodymium, and lead isotopic and trace element signatures of the East Indonesian sediments: Provenance and implications for Banda Arc magma genesis. Geochim. Cosmochim. Acta 59, 2573-2598. White W. M., Dupré B., and Vidal P. (1985) Isotope and trace element geochemistry of sediments from the Barbados Ridge-Demerara Plain region, Atlantic Ocean. Geochim. Cosmochim. Acta 49, 1875-1886.
White W. M. and Dupré B. (1986) Sediment subduction and magma genesis in the Lesser Antilles: Isotopic and trace element constraints. J.
Geophys. Res. 91, 5927-5941.
Winter B. L., Johnson C. M., and Clark D. L. (1997) Strontium, neodymium, and lead isotope variations of authigenic and silicate sediment components from the Late Cenozoic Arctic Ocean: Implications for sediment provenance and the source of trace metals in seawater.
Geochim. Cosmochim. Acta 61, 4181-4200.