HAL Id: hal-00302118
https://hal.archives-ouvertes.fr/hal-00302118
Submitted on 21 Sep 2006HAL is a multi-disciplinary open access
archive for the deposit and dissemination of sci-entific research documents, whether they are pub-lished or not. The documents may come from teaching and research institutions in France or abroad, or from public or private research centers.
L’archive ouverte pluridisciplinaire HAL, est destinée au dépôt et à la diffusion de documents scientifiques de niveau recherche, publiés ou non, émanant des établissements d’enseignement et de recherche français ou étrangers, des laboratoires publics ou privés.
First comparison of a global microphysical aerosol model
with size-resolved observational aerosol statistics
D. V. Spracklen, K. J. Pringle, K. S. Carslaw, G. W. Mann, P. Manktelow, J.
Heintzenberg
To cite this version:
D. V. Spracklen, K. J. Pringle, K. S. Carslaw, G. W. Mann, P. Manktelow, et al.. First comparison of a global microphysical aerosol model with size-resolved observational aerosol statistics. Atmospheric Chemistry and Physics Discussions, European Geosciences Union, 2006, 6 (5), pp.8871-8915. �hal-00302118�
ACPD
6, 8871–8915, 2006 Comparison of global aerosol model against observed statistics D. V. Spracklen Title Page Abstract Introduction Conclusions References Tables Figures J I J I Back CloseFull Screen / Esc
Printer-friendly Version
Interactive Discussion Atmos. Chem. Phys. Discuss., 6, 8871–8915, 2006
www.atmos-chem-phys-discuss.net/6/8871/2006/ © Author(s) 2006. This work is licensed
under a Creative Commons License.
Atmospheric Chemistry and Physics Discussions
First comparison of a global
microphysical aerosol model with
size-resolved observational aerosol
statistics
D. V. Spracklen1,*, K. J. Pringle1,**, K. S. Carslaw1, G. W. Mann1, P. Manktelow1, and J. Heintzenberg2
1
Institute for Atmospheric Science, School of Earth and Environment, University of Leeds, UK
2
Leibniz-Institute for Tropospheric Research, Permoserstr., 04318 Leipzig, Germany
*
now at: Atmospheric Chemistry Modeling Group, Department of Earth and Planetary Sciences, Harvard University, USA
**now at: Met Office, Hadley Centre, Exeter, UK
Received: 4 September 2006 – Accepted: 8 September 2006 – Published: 21 September 2006
ACPD
6, 8871–8915, 2006 Comparison of global aerosol model against observed statistics D. V. Spracklen Title Page Abstract Introduction Conclusions References Tables Figures J I J I Back CloseFull Screen / Esc
Printer-friendly Version
Interactive Discussion
Abstract
A statistical synthesis of marine aerosol measurements from experiments in four di ffer-ent oceans is used to evaluate a global aerosol microphysics model (GLOMAP). We compare the model against observed size resolved particle concentrations, probabil-ity distributions, and the temporal persistence of different size particles. We attempt
5
to explain the observed size distributions in terms of sulfate and sea spray and quan-tify the possible contributions of anthropogenic sulfate and carbonaceous material to the number and mass distribution. The model predicts a bimodal size distribution that agrees well with observations as a grand average over all regions, but there are large regional differences. Notably, observed Aitken mode number concentrations are more
10
than a factor 10 higher than in the model for the N Atlantic but a factor 7 lower than the model in the NW Pacific. We also find that modelled Aitken mode and accumula-tion mode geometric mean diameters are generally smaller in the model by 10–30%. Comparison with observed free tropospheric Aitken mode distributions suggests that the model underpredicts growth of these particles during descent to the MBL. Recent
15
observations of a substantial organic component of free tropospheric aerosol could explain this discrepancy. We find that anthropogenic continental material makes a sub-stantial contribution to N Atlantic marine boundary layer (MBL) aerosol, with typically 60–90% of sulfate across the particle size range coming from anthropogenic sources, even if we analyse air that has spent an average of >120 h away from land. However,
20
anthropogenic primary black carbon and organic carbon particles do not explain the large discrepancies in Aitken mode number. Several explanations for the discrepancy are suggested. The lack of lower atmospheric particle formation in the model may explain low N Atlantic particle concentrations. However, the observed and modelled particle persistence at Cape Grim in the Southern Ocean, does not reveal a diurnal
25
cycle consistent with a photochemically driven local particle source. We also show that a physically based cloud drop activation scheme is needed to explain the observed change in accumulation mode geometric mean diameter with particle number.
ACPD
6, 8871–8915, 2006 Comparison of global aerosol model against observed statistics D. V. Spracklen Title Page Abstract Introduction Conclusions References Tables Figures J I J I Back CloseFull Screen / Esc
Printer-friendly Version
Interactive Discussion
1 Introduction
Marine aerosol plays an important role in global climate. Oceans cover a large frac-tion of the Earth’s surface and cloud condensafrac-tion nuclei (CCN) concentrafrac-tions in the marine boundary layer (MBL) are typically lower than over continental regions, making marine stratocumulus clouds particularly susceptible to change from anthropogenic
5
sources (Pawlowska and Brenguier,2000).
Sea spray plays an obvious and well documented role in maintaining super-micrometre particle concentrations in the MBL (Fitzgerald,1991), but its contribution to sub-micrometre particle concentrations is less well understood. Recently, techniques have become available that allow the chemical characterisation of sub-micrometre
10
aerosol and subsequent observations have shown sea salt aerosol with dry diameters down to as small as 10 nm (Bigg et al.,1995;O’Dowd et al.,1997;Nilsson et al.,2001;
Zhou et al., 2001; Geever et al.,2005;Clarke et al.,2006). Recent sea salt aerosol
source functions now calculate sea salt production down to these smaller sizes (Gong,
2003b;Martensson et al.,2003;Clarke et al.,2006). In addition, particulate organic
15
matter is now known to contribute to sub-micrometre aerosol mass (Leck and Bigg,
2005a;O’Dowd et al., 2004). There is also new evidence suggesting that during the
summer in the Arctic, primary particulate matter from marine biogenic sources may be an additional source of marine aerosol (Bigg et al.,2004;Heintzenberg et al.,2006;
Leck and Bigg,1999,2005a,b;Leck et al.,2002,2004;Lohmann and Leck,2005). The
20
relative contribution of this source and its geographical extent outside the Arctic is so far unknown.
A number of modelling studies have advanced our understanding of what physical processes determine the particle size distribution in the MBL (e.g.,Kreidenweis et al.,
1991;Raes and Van Dingenen,1992;Lin et al.,1992;Pandis et al.,1994;Russell et al.,
25
1994;Raes,1995;Capaldo et al.,1999;Katoshevski et al.,1999;Pirjola et al.,2000).
Observations and models show that entrainment of aerosol from the free troposphere (FT) is important in maintaining MBL aerosol concentrations (Raes,1995;Covert et al.,
ACPD
6, 8871–8915, 2006 Comparison of global aerosol model against observed statistics D. V. Spracklen Title Page Abstract Introduction Conclusions References Tables Figures J I J I Back CloseFull Screen / Esc
Printer-friendly Version
Interactive Discussion
1996; Raes et al., 1997; Bates et al., 1998b). Aerosol in the FT immediately above
the MBL is reasonably constant in time because particles formed in the cold upper troposphere have time to evolve into a self-preserving size distribution through slow subsidence of air. This persistence of the overlying aerosol is believed to sustain a fairly constant MBL aerosol despite periodic scavenging of the larger sea salt particles.
5
The extent to which the aerosol distribution is repopulated by local nucleation pro-cesses is not clear. A statistical analysis of observed remote MBL aerosol distribu-tions shows that particles below 10 nm diameter only occur in 3% of the observadistribu-tions
(Heintzenberg et al., 2004), although regions such as the N Atlantic do have a
sta-tistically significant ultrafine mode around 20 nm dry diameter. These observations
10
suggest that in situ particle production in the MBL is limited, although there is evidence that nucleation may be important in coastal areas (O’Dowd et al.,1999) and ultrafine particles may be formed after precipitation scavenging of existing aerosol (Clarke et al.,
1998;Covert et al.,1992,1996;Weber et al.,1995,1998).
Most previous studies have also assumed that aerosol entrained from the FT is
15
composed entirely of sulfate, derived entirely from natural emissions. There are other sources of aerosol material in the FT that need to be considered. For example, some of the aerosol material may be derived from anthropogenic sulfur or involatile particles like black carbon. Secondary organic material may also contribute to the mass of en-trained aerosol. The work ofHeald et al. (2005) suggests that a large fraction of FT
20
aerosol may be secondary organic in origin, and at least some of this will reach the remote MBL.
Much of our understanding of MBL aerosol has stemmed from the results of box and single column model simulations (e.g., Kreidenweis et al., 1991; Raes and Van
Din-genen, 1992; Lin et al.,1992; Pandis et al., 1994; Russell et al.,1994;Raes,1995;
25
Capaldo et al., 1999; Katoshevski et al., 1999; Pirjola et al., 2000). These
simula-tions have examined the maintenance of MBL Aitken and accumulation mode aerosol through a combination of sea spray emission and entrainment from the FT. The ide-alised nature of most of these studies and the limited spatial scale of the models means
ACPD
6, 8871–8915, 2006 Comparison of global aerosol model against observed statistics D. V. Spracklen Title Page Abstract Introduction Conclusions References Tables Figures J I J I Back CloseFull Screen / Esc
Printer-friendly Version
Interactive Discussion that they have not been able to assess the importance of continental aerosol sources.
Several sophisticated global aerosol models have been developed, a need originally highlighted byRaes et al.(1995) in order to fully understand MBL aerosol. These mod-els allow changes in the aerosol size distribution to be predicted through calculation of the driving microphysical processes (Adams and Seinfeld,2002;Ghan et al.,2001;
5
Gong et al.,2002,2003a;Herzog et al.,2004;Rodriguez and Dabdub,2004;Spracklen
et al.,2005a,b;Stier et al.,2005;Vignati et al.,2004;Wilson et al.,2001). The princi-pal advantage of a global model over a box or column model is that it naturally takes account of the spatial and temporal changes in aerosol in the MBL and overlying FT driven by variations in meteorology. In the box models, assumptions had to be made
10
about the nature of the particles entrained from the FT into the MBL. Global model FT aerosol varies depending on regional variations in source gas concentrations (DMS, SO2), vertical transport in clouds and subsidence rates. Global models also account for the long-range transport of aerosol, including that derived from continental primary emissions, marine DMS and anthropogenic SO2, while box model studies have been
15
limited to single columns of the atmosphere influenced by local emissions only.
The availability of global aerosol microphysics models now permits a more detailed evaluation of our understanding of MBL aerosol. InSpracklen et al.(2005a) we showed that a global aerosol microphysics model of the sulfate and sea salt system (GLOMAP) is capable of capturing observed CN concentrations in the MBL and FT. We also
20
showed that modelled particle size distributions are broadly in agreement with typical observations. GLOMAP simulates a surface mean MBL CN concentration of 465 cm−3
(Spracklen et al.,2005a) which compares well with the aerosol climatology of
Heintzen-berg et al. (2000) which gives a global average value (weighted by latitudinally bined ocean surface area) of about 490 cm−3. Adams and Seinfeld(2002) use a sectional
25
scheme in the GISS general circulation model. For a sulfate-only simulation they re-port global mean surface (including the continental BL) CN number of 221 cm−3. Their simulated mean MBL number would be even lower than this (as simulated number is highest over continental areas) and would be less than 50% of either observations
ACPD
6, 8871–8915, 2006 Comparison of global aerosol model against observed statistics D. V. Spracklen Title Page Abstract Introduction Conclusions References Tables Figures J I J I Back CloseFull Screen / Esc
Printer-friendly Version
Interactive Discussion or the GLOMAP mean. Their more recent study (Pierce and Adams,2006) suggests
that sub-micrometre sea spray may enhance particle concentrations over the Southern Ocean by 150–500%. However, the estimated contribution of sea spray emissions to CCN based on model simulations will depend very much on the modelled concentra-tions of sub-micrometre sulfate concentraconcentra-tions.
5
In this paper we use statistical analyses of observed remote MBL aerosol (
Heintzen-berg et al.,2000,2004) to carry out a comprehensive evaluation of the factors control-ling its properties. We extend previous comparisons of modelled and observed integral variables like CN and CCN to a full evaluation of the size distribution. This is the first detailed comparison between a global sectional aerosol process model and remote
10
MBL aerosol size distributions. This comparison will be the basis from which we can build an understanding of how biogenic and anthropogenic continental sources impact the marine aerosol distribution.
2 Model description
GLOMAP is an extension to the TOMCAT global 3-D off-line Chemical Transport Model
15
(e.g.,Chipperfield et al.,1993;Stockwell and Chipperfield,1999). A detailed descrip-tion of GLOMAP is given inSpracklen et al. (2005a). The aerosol distribution is de-scribed using a sectional scheme with 20 bins spanning dry diameters from about 3 nm to 25 µm. Two moments are simulated in each size section (particle number density and mass per particle). Carrying two moments for each size section allows the average
20
particle mass in each bin to vary, whereas this is fixed in single moment schemes. In the baseline runs presented here, GLOMAP is restricted to sea salt and sulfate aerosol. To minimise computational expense we simulate both components in one internally mixed distribution. That is we assume instantaneous mixing of sea salt and sulfate in any size bin. We assume this internally mixed distribution to have the physical
25
and chemical properties of sulfate aerosol. Sea salt and sulfate aerosol activate at similar diameters so the impact of this assumption will be small.
ACPD
6, 8871–8915, 2006 Comparison of global aerosol model against observed statistics D. V. Spracklen Title Page Abstract Introduction Conclusions References Tables Figures J I J I Back CloseFull Screen / Esc
Printer-friendly Version
Interactive Discussion GLOMAP includes the processes of aerosol nucleation, condensation, growth,
co-agulation, wet and dry deposition, transport, and cloud processing.
Aerosol nucleation is calculated using the binary homogeneous H2SO4−H2O scheme of Kulmala et al. (1998) which calculates nucleation rates as a function of temperature, relative humidity and gas phase concentration of sulfuric acid.
5
The baseline model uses a simple scheme to activate aerosol to cloud droplets. All particles greater than 50 nm dry diameter are assumed activated in low stratiform clouds. Monthly mean cloud fraction is from the International Satellite Cloud Clima-tology Project D1 database (Rossow and Schiffer,1999). GLOMAP includes both in-cloud and below-in-cloud aerosol wet deposition in convective and frontal precipitation
10
as diagnosed by European Centre for Medium-Range Weather Forecasts (ECMWF) analyses.
Primary sea salt emissions are from Gong (2003b) which calculates sea salt flux between 70 nm and 20 µm dry diameter. TheGong(2003b) scheme extends the range of theMonahan et al.(1986) scheme to particle sizes below 0.2 µm where the original
15
scheme had been found to overestimate sea salt flux. A recent global model study
by Pierce and Adams (2006) has used new sea salt schemes (Clarke et al., 2006;
Martensson et al.,2003), which emit sea salt aerosol down to sizes as small as 10 nm
dry diameter. This study found that over the Southern Ocean this ultrafine sea salt can increase CCN concentrations by more than 50%.
20
Oceanic DMS emissions are calculated using sea surface DMS concentrations from
Kettle et al. (1999) and the sea-to-air transfer velocity of Liss and Merlivat (1986).
Volcanic SO2 emissions are from Andres and Kasgnoc (1998). Anthropogenic SO2 emissions are from Benkovitz et al. (1996). In the baseline model all anthropogenic sulfur is assumed to be emitted as gaseous SO2.
25
Model runs presented here use a spatial resolution of 2.8◦×2.8◦ latitude × longi-tude with 31 hybrid σ-p levels extending from the surface to 10 hPa. Large-scale at-mospheric transport is specified from European Centre for Medium-Range Weather Forecasts (ECMWF) analyses at 6-hourly intervals. Tracer advection is performed
us-ACPD
6, 8871–8915, 2006 Comparison of global aerosol model against observed statistics D. V. Spracklen Title Page Abstract Introduction Conclusions References Tables Figures J I J I Back CloseFull Screen / Esc
Printer-friendly Version
Interactive Discussion ing the scheme ofPrather(1986). Sub-grid transport is calculated using the convection
scheme ofTiedtke(1989) and turbulent mixing in the boundary layer is calculated using the paramaterization ofHoltslag and Boville(1993).
3 Observations
We use MBL aerosol observations from two recently compiled statistical analyses
5
(Heintzenberg et al., 2000, 2004). Heintzenberg et al. (2000) reviewed MBL
obser-vations made over the last 30 years and presented them on a 15◦latitude × 15◦ longi-tude grid. Observations were made from January through December and cover 25% of the 15◦ by 15◦ ocean grid squares (see Fig. 1a of Heintzenberg et al.,2000). The data were then further binned into 15◦latitude bands. Two latitude bands contained no
10
observations (75◦S–90◦S and 60◦N–90◦N). Distributions were fitted with 4 lognormal modes, but due to lack of data, global distributions were available only for the Aitken and accumulation modes.
Heintzenberg et al. (2004) compiled MBL observations from five marine aerosol
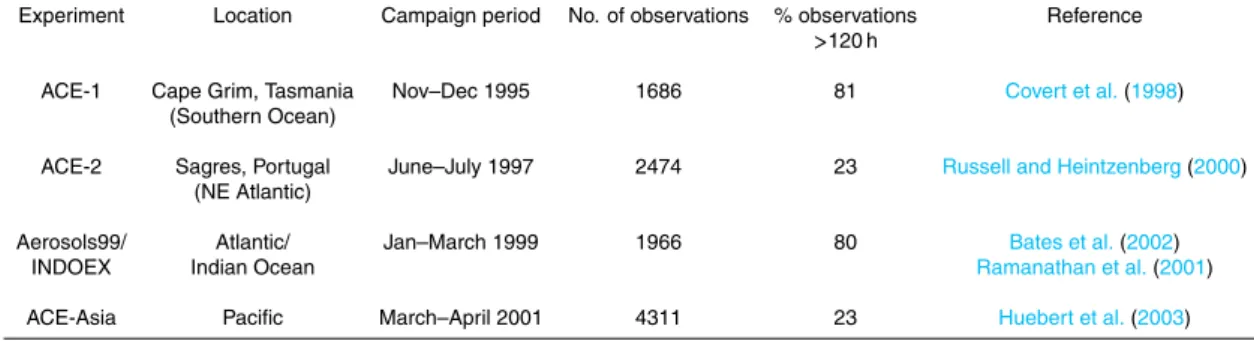
experiments (ACE-1, ACE-2, ACE-Asia, INDOEX and Aerosols99), which are
sum-15
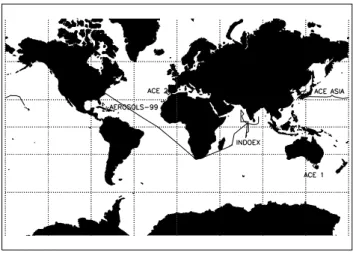
marised in Table 1. The location of the field campaigns is illustrated in Fig.1. These experiments span virtually an annual cycle (January to April, June to July and Novem-ber to DecemNovem-ber) and cover 4 different regions of ocean (Atlantic, Pacific, Indian and Southern oceans) in both Northern and Southern Hemispheres. To minimise conti-nental contamination, and to give a better description of remote “background” MBL
20
aerosol,Heintzenberg et al. (2004) filtered the observations to include data only with back trajectories of at least 120 h without land contact.Heintzenberg et al.(2000) does not include any filtering to remove air masses with continental origin.
Aerosol size distributions were measured with a twin differential mobility particle spectrometer (TDMPS) with a minimum detection limit of 3 nm dry diameter. The upper
25
size detection limit varied between 614 and 900 nm dry diameter. Counting statistics control the accuracy of particle counters at both the lower and upper particle size limit.
ACPD
6, 8871–8915, 2006 Comparison of global aerosol model against observed statistics D. V. Spracklen Title Page Abstract Introduction Conclusions References Tables Figures J I J I Back CloseFull Screen / Esc
Printer-friendly Version
Interactive Discussion Below 20 nm diameter, the low flow of sample air to the instrument results in high
counting uncertainties (Heintzenberg et al.,2004). At the upper size limit of the instru-ments, low atmospheric concentrations also results in higher counting uncertainties.
Heintzenberg et al.(2004) only included data where counting uncertainties were less
than 100%.
5
4 Approach
4.1 Description of the model runs
A series of simulations has been carried out starting with a baseline sulfate/sea-spray run and progressively incorporating further aerosol components or a refined treatment of specific processes.
10
1. Baseline sulfate/sea-spray run. We use the version of GLOMAP as described in
Spracklen et al. (2005a). The model includes no primary particulate emissions
from anthropogenic sources (all anthropogenic sulfur is emitted as a gas) and there are no emissions of carbonaceous particles. Activation of aerosol particles into cloud droplets occurs at a fixed particle size.
15
2. Additional species. Several model simulations are used to investigate the contri-bution of primary anthropogenic aerosol sources to the size districontri-bution. First we assume a contribution from primary sulfate and then we include carbonaceous aerosol (from industrial and biomass burning sources).
3. Sensitivity to cloud processing. In these simulations we include a mechanistic
20
calculation of cloud drop number in low-level clouds. The importance of these simulations is that they capture the dependence of activation diameter on the particle size distribution and should give more realistic conversion from Aitken to accumulation mode particles.
ACPD
6, 8871–8915, 2006 Comparison of global aerosol model against observed statistics D. V. Spracklen Title Page Abstract Introduction Conclusions References Tables Figures J I J I Back CloseFull Screen / Esc
Printer-friendly Version
Interactive Discussion 4.2 Method of comparing model and observations
The model was initialised with an aerosol-free atmosphere on 1 October 1995, and spun up for 90 days. Results presented here are for an annual run for January-December 1996.
GLOMAP output was collocated with observations in both time and space by using
5
surface model grid squares that lie within the geographic boundaries of the field exper-iment and during the calendar months when the different experiments took place. For
Heintzenberg et al.(2000) the geographic boundaries are defined as the 15◦ latitude
by 15◦longitude squares where observations occurred. ForHeintzenberg et al.(2004) the observations are from a combination of surface stations and ship-based
measure-10
ments. The observations for ACE-1 and ACE-2 are from 2 surface stations at Cape Grim, Tasmania and Sagres, Portugal. For comparison with these stations we use ocean model grid squares immediately adjacent to the surface station. The observa-tions for INDOEX/Aerosols99 and ACE-Asia are from ship-based measurements. Here we use model grid squares along the line of ship cruise.
15
Table 1 shows the number of observations in each field campaign that contribute to the distributions ofHeintzenberg et al. (2004). Heintzenberg et al. (2004) combined results from all experiments to produce a “grand average” distribution. The modelled “grand average” size distribution is generated by weighting the results from model grid squares depending on the number of observational data points contributed from each
20
campaign.
Heintzenberg et al.(2004) filtered out observations for which computed back
trajec-tories passed over land within 120 h of the observation. To do likewise in GLOMAP we emit a tracer of known lifetime from all land masses and use the concentration of this tracer to calculate average age of air in any grid box. For comparison with
Heintzen-25
berg et al. (2004) we only include grid boxes where the average age of air exceeds 120 h.
ACPD
6, 8871–8915, 2006 Comparison of global aerosol model against observed statistics D. V. Spracklen Title Page Abstract Introduction Conclusions References Tables Figures J I J I Back CloseFull Screen / Esc
Printer-friendly Version
Interactive Discussion
5 MBL number-size distribution
5.1 General properties of the global MBL aerosol
Here we compare the baseline GLOMAP model of sulfate and sea spray with MBL ob-servations from all the marine experiments (termed the “grand average” by
Heintzen-berg et al.,2004). Figure 2a compares the GLOMAP size-dependent 5th, 50th and
5
95th percentiles of number concentrations and the observations from Heintzenberg
et al. (2004). This comparison is shown also as a probability density function (PDF) of the number concentrations (N(dp)=dN(dp)/d log(dp)) in Fig. 2b. We note that at small particle diameters, observations end at between 6 and 20 nm depending on the particle number concentration, whereas the model ends at smaller particle sizes. This
10
is caused by counting statistics in the particle sensors resulting in large uncertainty at small diameters (Heintzenberg et al.,2004) and does not imply any discrepancy with the model.
The baseline model run predicts a median particle number (particles greater than 3 nm diameter) concentration of 250 cm−3, which compares well with the observed
15
value of 248 cm−3. Note that this is lower than the observed (Heintzenberg et al.,
2000) and modelled (Spracklen et al.,2005a) aerosol number reported when we do not filter out air masses with less than 120 h since continental contact (see Sect.1).
GLOMAP’s median distribution captures some of the key features of the observed MBL median distribution. Firstly, the model has a bimodal submicrometre distribution,
20
with Aitken and accumulation modes at approximately the correct number concentra-tions (although modelled Aitken and accumulation modes are smaller than observed.) Secondly, both model and observations show “closed” size distributions at small sizes, with a low probability of particles with diameters less than 20 nm. This observation, which is well captured in the model, has been used to suggest that particle nucleation
25
and subsequent growth to observable sizes is infrequent in the MBL (Heintzenberg
ACPD
6, 8871–8915, 2006 Comparison of global aerosol model against observed statistics D. V. Spracklen Title Page Abstract Introduction Conclusions References Tables Figures J I J I Back CloseFull Screen / Esc
Printer-friendly Version
Interactive Discussion 5.2 Regional variations in the size distribution
A comparison of modelled and observed particle number from all four experiments sug-gests overall good agreement (Fig.2). However, there are some large differences be-tween the model and observations at a regional level. Figure3compares the modelled and observed size distributions for the different field campaigns inHeintzenberg et al.
5
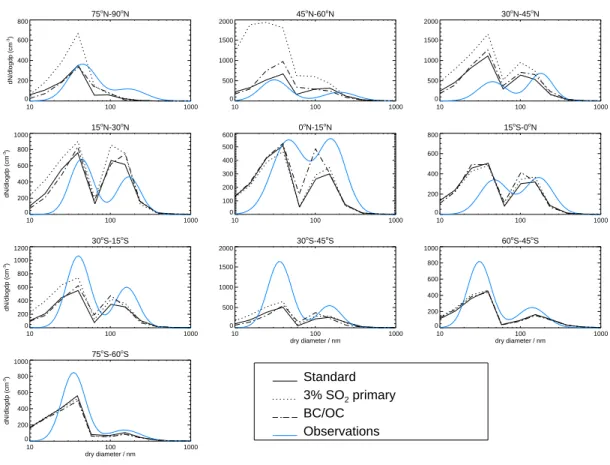
(2004), which have been filtered to reduce continental contamination (see Sect. 4.2). Figure 4 summarises the comparison in terms of the parameters of fitted log-normal modes. To aid comparison withPierce and Adams(2006), in Fig.5 we also compare with the unfiltered zonally averaged size distributions originally presented in
Heintzen-berg et al. (2000) (baseline model run is the solid black line). As we show below,
10
the binning of observations in latitude bands may hide some interesting differences between the model and observations for the separate regional campaigns.
A clear difference between the model and the observations is the underprediction of Aitken mode number between 45◦S and 30◦S by >50% (Fig. 5 and Fig. 3, ACE-1). A smaller discrepancy exists between 75◦S and 45◦S. Model underprediction of
15
total aerosol number at these latitudes has been reported previously (Spracklen et al.,
2005a;Easter et al.,2004;Pierce and Adams,2006). InSpracklen et al.(2005a) we
suggested that this was due to a strong seasonal cycle at these latitudes. Observa-tions were generally made during the Southern Hemisphere spring or summer when DMS emissions are large and previous model comparisons have used model annual
20
mean. In this work we only use model results for the same calendar months as the observations and Aitken mode number is still underpredicted by between 30 and 50%. Recent work byPierce and Adams(2006) has suggested that ultrafine sea salt has an important impact on submicron marine aerosol size distributions. They showed that emission of ultrafine sea salt, particularly with theMartensson et al. (2003) scheme,
25
resulted in significant increases in Aitken mode number between 45◦S and 75◦S, but only a very minor increase in Aitken mode number between 45◦S and 30◦S. Their work suggests that the lack of ultrafine sea salt in our model may be responsible for
ACPD
6, 8871–8915, 2006 Comparison of global aerosol model against observed statistics D. V. Spracklen Title Page Abstract Introduction Conclusions References Tables Figures J I J I Back CloseFull Screen / Esc
Printer-friendly Version
Interactive Discussion underprediction of Aitken mode number between 45◦S and 75◦S but is unlikely to be
the cause of the underprediction between 45◦S and 30◦S. Further work is required to fully explore the role of ultrafine sea salt.
There are other differences between modelled and observed Aitken mode number in other regions (Fig. 3). For example, in ACE-2 (N. Atlantic) the ratio modelled/observed
5
number is 0.06, while it is 7.4 for ACE-Asia (NW Pacific). In both cases the modelled Aitken mode particles are too small. Model Aitken number for ACE-Asia may be over-predicted due to lack of dust aerosol in the model. Dust is a major component of East Asian aerosol outflow and was sampled on a number of occasions during ACE-Asia. Dust aerosol provides additional surface area increasing the fraction of sulfate found
10
in the coarse mode. Tang et al. (2004) showed that downwind of East Asia between 10 and 15% of sulfate occurs in the supermicron mode. For INDOEX/Aerosols99 the model/observed Aitken number ratio is 1.5, indicating much better agreement at lower latitudes, but again the particles are too small in the model. The model underpredic-tion of Aitken mode size is present at all locaunderpredic-tions and as a grand average the Aitken
15
mode geometric mean diameter of the pollution-filtered model is 72% of that observed. This difference equates to the modelled Aitken particle volume being only 37% of that observed.
The accumulation mode number concentrations are generally in fair agreement, and the model captures some of the observed differences between the different regions.
20
The biases (model divided by observations) in accumulation mode number are: ACE-1 (0.57), ACE-2 (1.1), INDOEX/Aerosols99 (1.1), and ACE-Asia (1.9). The accumula-tion mode size is underpredicted in all regions except for the Southern Ocean (ACE-1). The biases (model divided by observations) are: ACE-1 (1.4), ACE-2 (0.83), IN-DOEX/Aerosols99 (0.73), and ACE-Asia (0.85).
25
Heintzenberg et al.(2000) reported that both Aitken and accumulation mode
diame-ters are about 25% bigger in the Northern than the Southern hemispheres. This trend is supported by observations in the field campaigns inHeintzenberg et al.(2004) but is not captured by the model. It is interesting that accumulation mode size is either well
ACPD
6, 8871–8915, 2006 Comparison of global aerosol model against observed statistics D. V. Spracklen Title Page Abstract Introduction Conclusions References Tables Figures J I J I Back CloseFull Screen / Esc
Printer-friendly Version
Interactive Discussion predicted or overpredicted by the model in the remote Southern Ocean (75◦S–30◦S)
whereas it is generally underpredicted in the NH. Particle size in the NH may be larger due to emissions from continental sources (e.g., primary emissions of carbonaceous aerosol or emissions of volatile organic compounds that are oxidised to secondary organic aerosol), which are not included in the baseline model runs presented here.
5
Alternatively differences in cloud processing between hemispheres may influence the activation diameter which is fixed in this model run. In Sects.5.3 and 8 we explore the effect of anthropogenic primary emissions and of more detailed aerosol activation schemes on the modelled aerosol size distribution.
Another difference between the model and observations is in the minimum between
10
the Aitken and accumulation modes (apparent in Fig.2). The modelled number con-centration at the minimum is too low. The deep minimum is caused by the use of a fixed activation diameter (50 nm) during cloud formation in the model. In reality, this activa-tion diameter varies according to variaactiva-tions in updraft velocity as well as the shape of the particle size distribution. This issue is also connected with the way that the
diame-15
ter of the observed Aitken and accumulation modes (and the minimum between them) increases from the 5% to the 50% to the 95% percentiles (e.g., the minimum increases as 63, 78 and 110 nm). That is, particle distributions with higher concentrations tend to have larger accumulation modes. The model does not capture this property. These effects are explored in Sect.8.
20
5.3 Effect of anthropogenic aerosol on the size distribution
In Sect.5.2we showed that the model greatly underpredicts the concentration of Aitken mode particles over the N. Atlantic (based on a comparison with observations from ACE-2). Although the analysis included only airmasses that were more than 120 h from land, it is still possible that anthropogenic material contributes to the particle loading.
25
Before examining the effect of anthropogenic emissions on the size distribution, we quantify the effectiveness of the 120 h cut-off in filtering out continental contamination. We do this by using the model to track separate anthropogenic (anth) and natural (nat)
ACPD
6, 8871–8915, 2006 Comparison of global aerosol model against observed statistics D. V. Spracklen Title Page Abstract Introduction Conclusions References Tables Figures J I J I Back CloseFull Screen / Esc
Printer-friendly Version
Interactive Discussion sulfur tracers. SO2(anth) is emitted directly from anthropogenic combustion sources
(including 3% as primary sulfate particles) and SO2(nat) is derived from DMS oxidation products and directly from volcanic emissions. Through gas phase oxidation these two tracers produce H2SO4(anth) and H2SO4(nat). We then track separate anthropogenic and natural particulate components formed after either nucleation or condensation of
5
the two different H2SO4 tracers or aqueous phase oxidation of the two different SO2 tracers.
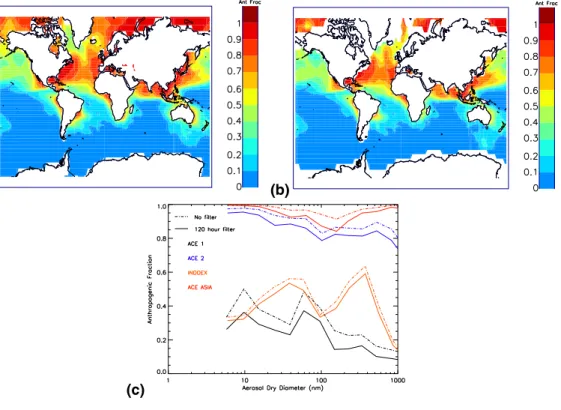
Figure6a and b show the contribution of natural and anthropogenic sulfate to the total aerosol mass in the boundary layer with and without the 120 h filter, respectively. The unfiltered results show that between 60 and 90% of the N. Atlantic particulate sulfate is
10
anthropogenic in origin. Including the age filter has little influence on the extent to which anthropogenic sources impact on MBL aerosol. The average fraction of anthropogenic sulfate across the aerosol size distribution is shown for the geographic regions covered by each field campaign in Fig.6c. A fraction in excess of 70% is calculated across the entire size spectrum for ACE-2 and ACE-Asia regions both with and without the
15
age filter. The strong continental influence on aerosol across each of these regions may explain why the model fails to accurately predict Aitken mode concentrations. The inclusion of other continental material such as carbonaceous aerosol and condensable organics may lead to a better agreement between model and observations.
ACE-1 stands out from Fig.6 as being the campaign from which observations best
20
characterised natural aerosol processes. Nevertheless, our model suggests there was probably still a substantial continental influence on air sampled across Cape Grim, even when excluding air masses aged less than 120 h since contact with land. From these model results it appears that the majority of the remote marine air sampled across each campaign is likely to have been contaminated with continental material. Figure6shows
25
that there are few regions of the Northern Hemisphere ocean where the influence of anthropogenic sulfate on marine aerosol is negligible.
ACPD
6, 8871–8915, 2006 Comparison of global aerosol model against observed statistics D. V. Spracklen Title Page Abstract Introduction Conclusions References Tables Figures J I J I Back CloseFull Screen / Esc
Printer-friendly Version
Interactive Discussion 5.4 Effect of primary anthropogenic emissions on MBL size distributions
The baseline model run presented in Sects.5.1and 5.2includes anthropogenic SO2 emissions but no emissions of primary anthropogenic particles. Here we investigate the contribution of anthropgenic primary emissions to MBL size distributions and ex-plore to what extent they may explain disrepancies between model and observations
5
as outlined in Sects.5.1and5.2.
5.4.1 Effect of primary sulfate emissions
Spracklen et al. (2005a) and Adams and Seinfeld (2002) have shown that primary
anthropogenic sulfate particles can greatly increase continental boundary layer CN number, and may also affect particle concentrations over oceanic regions downwind. In
10
Spracklen et al.(2005b) we showed in particular that N Atlantic MBL CN concentrations
could be increased by between 100 and 300% by such emissions. As inSpracklen et al.
(2005b) we follow the approach of Adams and Seinfeld (2003) and assume primary
particles are emitted as two lognormal modes with geometric mean diameters of 10 and 70 nm and standard deviations of 1.6 and 2.0, respectively. Fifteen percent by
15
mass of the primary particles is assumed to be emitted in the small mode and the remainder in the large mode.
The effect of these anthropogenic primary emissions on modelled Aitken and accu-mulation mode number and size is summarised in Fig.4as triangles.
Figures3 and 5show the effect of including primary emissions (dotted line) on
re-20
gional and zonal number size distributions. When we do not filter out continental air masses including primary emissions causes a large increase in model Aitken mode between 45◦N and 60◦N resulting in an overprediction of Aitken mode number here by about a factor of 4. The impact of primary sulfate emissions is smaller when we filter out continental airmasses (Fig.4). ACE-Asia and INDOEX modelled median number
25
increase by about 25% and ACE-2 concentrations by about 50%. ACE-2 95th per-centile number increases by a factor of 2.5. However, ACE-2 Aitken mode number is
ACPD
6, 8871–8915, 2006 Comparison of global aerosol model against observed statistics D. V. Spracklen Title Page Abstract Introduction Conclusions References Tables Figures J I J I Back CloseFull Screen / Esc
Printer-friendly Version
Interactive Discussion still greatly underpredicted even with primary emissions.
Including primary emissions has relatively little impact on the size of the Aitken mode and does not help to explain model underprediction of mode diameter.
5.4.2 Effect of industrial and biomass burning black and organic carbon
Anthropogenic black and organic carbon particles have also been observed at remote
5
MBL sites (Heintzenberg and Bigg,1990). During the Joint Global Ocean Flux Study (JGOFS) cruises between Nova Scotia and the Canary Islands during September– October 1992,Van Dingenen et al. (1995) observed high concentrations of carbona-ceous aerosols up to about 600 km from the continents.
We examine the potential influence of black carbon (BC) and organic carbon (OC)
10
particles on the MBL aerosol distributions. The effect on regional Aitken and accumu-lation mode aerosol is summarised in Fig.4as squares.
BC and OC from fossil fuel combustion are emitted in the model with a number mode radius of 15 nm and geometric standard deviation 1.8 and from biofuel sources with radius 40 nm (Bond et al.,2004). BC and OC from wild fires are emitted according to
15
Van der Werf et al.(2003) with number mode radius of 40 nm and geometric standard
deviation of 1.8. Emissions from biofuel and fossil fuel are added to the lowest model layer. Emissions from wild fires are emitted between the surface and 6 km altitude. To limit the computational cost of the global model, we simulated the BC, OC, sulfate and sea salt aerosol as an internally mixed distribution with the properties of acidic sulfate.
20
The most important effect of this simplification is to artificially increase the particle scavenging efficiency of BC and OC particles in clouds (through drop formation on the more hygroscopic acidic particles). We estimate the importance of this on model CN number. Complete removal of in-cloud scavenging in the model increased CN globally by only 10%.
25
BC and OC emissions increase grand average median aerosol number by about 40% (from 250 cm−3 to 350 cm−3) and grand average 95th percentile number by 75% (from 1370 cm−3 to 2390 cm−3) even with the 120 h filter. These emissions result in a better
ACPD
6, 8871–8915, 2006 Comparison of global aerosol model against observed statistics D. V. Spracklen Title Page Abstract Introduction Conclusions References Tables Figures J I J I Back CloseFull Screen / Esc
Printer-friendly Version
Interactive Discussion comparison with the observed 95th percentile concentration of 2380 cm−3. However,
the success of the model in capturing regional variations in Aitken and accumulation mode properties is limited (Figs.3 and 4). In the N. Atlantic (ACE-2) the inclusion of BC/OC emissions has a negligible effect on the significant underprediction of Aitken mode concentration, with the ratio modelled/observed changing from 0.06 to 0.09.
5
Aitken mode concentrations were already overpredicted by a factor 7 in the NE Pa-cific even without anthropogenic primary emissions, and inclusion of BC/OC increases that overprediction to a factor 9. There is a slight improvement for the ACE-1 region in the Southern Ocean where anthropogenic BC and OC improve the underprediction of Aitken mode number from 55% to 40%.
10
The effect of anthropogenic BC and OC on accumulation mode number is also mixed. There is a slight improvement for ACE-1 but mode number is now overpredicted by about a factor 2 for ACE-2 and ACE-Asia, where good agreement was obtained in the baseline simulation. The mode diameter of the accumulation mode is hardly affected or even made worse by the primary emissions.
15
5.4.3 Discussion of the effect of anthropogenic primary emissions
This comparison has identified a number of significant discrepancies between mod-elled and observed particle size distributions in the MBL. We have shown that it is difficult to filter out anthropogenic (or continental) influences on aerosol simply based on the time that air has spent away from continental sources. This means that
model-20
observation discrepancies may be due in large part to uncertainties in continental emis-sions rather than marine aerosol emisemis-sions and processes. Thus, it is difficult, based on these datasets, to evaluate our understanding of clean remote regions. Rather, our model-observation comparison becomes a test also of our understanding of continental aerosol processes.
25
Our model, including natural and anthropogenic emissions, underpredicts Aitken mode concentrations by more than factor 9 in the N. Atlantic (ACE-2) but overpredicts
ACPD
6, 8871–8915, 2006 Comparison of global aerosol model against observed statistics D. V. Spracklen Title Page Abstract Introduction Conclusions References Tables Figures J I J I Back CloseFull Screen / Esc
Printer-friendly Version
Interactive Discussion by a similar amount over the NW Pacific (ACE-Asia). Super-fine sea spray emission is
a possible explanation for the underprediction over the Atlantic, but the study ofPierce
and Adams (2006) suggests only a 20% effect at these latitudes. Another possible explanation for the underprediction is the lack of aerosol nucleation in the lower layers of the model atmosphere. We have shown that Atlantic CN concentrations could be
5
enhanced by up to a factor 10 by this mechanism (Spracklen et al., 2006), although the predictions for marine regions remain to be tested. An ultrafine mode with diam-eter 19 nm and median concentration of 248 cm−3 (1866 cm−3 for the 95th percentile) is apparent in the observations during ACE-2 but is much less obvious during other campaigns. The complete lack of this mode in the model suggests we are missing a
10
significant source of ultrafine particles in the lower atmosphere over the NE Atlantic. In-cluding primary anthropogenic emissions does produce an ultrafine mode in the model but with low number concentrations (median number of 30–40 cm−3 for ACE-2). The ultrafine mode may be attributable to local particle formation in the lower atmosphere which could contribute to total particle concentrations. ACE-2 observations are from a
15
coastal station in Portugal and therefore could be also influenced by coastal nucleation
(O’Dowd et al.,1999). A further explanation for the underprediction in the N. Atlantic
could be that emissions inventories for anthropogenic primary particles (BC and OC) are too low in terms of particle number at Aitken mode sizes.
6 Free tropospheric number-size distribution
20
We have shown that the model consistently underpredicts the size of the Aitken mode in the MBL. This could be a result of the model underpredicting the FT particle size. FT aerosol is entrained into the MBL and is the main source of the Aitken mode. Here we compare modelled FT number-size distributions against observations to evaluate to what extent this is the case.
25
Clarke and Kapustin (2002) averaged observations from six aircraft flights of the
dur-ACPD
6, 8871–8915, 2006 Comparison of global aerosol model against observed statistics D. V. Spracklen Title Page Abstract Introduction Conclusions References Tables Figures J I J I Back CloseFull Screen / Esc
Printer-friendly Version
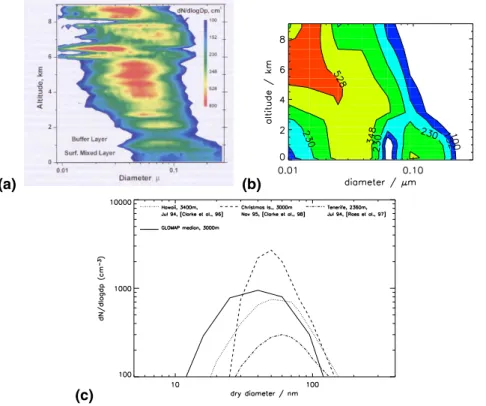
Interactive Discussion ing March and April 1999. Figure7a and b show a comparison of observed and
mod-elled aerosol vertical profiles. Both model and observations clearly show a monomodal distribution in the FT (in contrast to the multi-modal distribution observed and modelled in the MBL due to cloud processing). As air descends from about 5 km altitude to-wards the MBL, the particles grow (through coagulation and condensation of vapours)
5
and particle number falls (due to coagulation). While modelled particle number and size shows the same trends with altitude as observed, it is clear from Fig. 7a and b that modelled growth of particles during descent is less than observed. This can also be seen in Fig.7c, which compares modelled and observed number-size distributions in the lower FT. Observations are from a variety of different measurement campaigns
10
and all show a monomodal distribution with number peak dry diameter at between 50 and 80 nm, somewhat larger than the modelled peak at around 40 nm. These com-parisons suggest that insufficient particle growth in the FT produces FT particles that are too small when they are entrained into the MBL.Heald et al.(2005) suggests that a large fraction of FT aerosol mass is secondary organic from the oxidation of long
15
lived volatile organic compounds. In these model runs sulfur is the only condensible species. Our results therefore suggest that long-range transport of continental organic compounds could impact the remote MBL aerosol. Further work is needed to confirm this hypothesis.
7 Variability of MBL aerosol
20
The variability of MBL aerosol was investigated byHeintzenberg et al.(2004) in order to understand the physical processes that control the aerosol properties. There are two aspects to the variability of MBL aerosol: the spread of particle concentrations about the median and the temporal variability.
ACPD
6, 8871–8915, 2006 Comparison of global aerosol model against observed statistics D. V. Spracklen Title Page Abstract Introduction Conclusions References Tables Figures J I J I Back CloseFull Screen / Esc
Printer-friendly Version
Interactive Discussion 7.1 Particle concentration variability
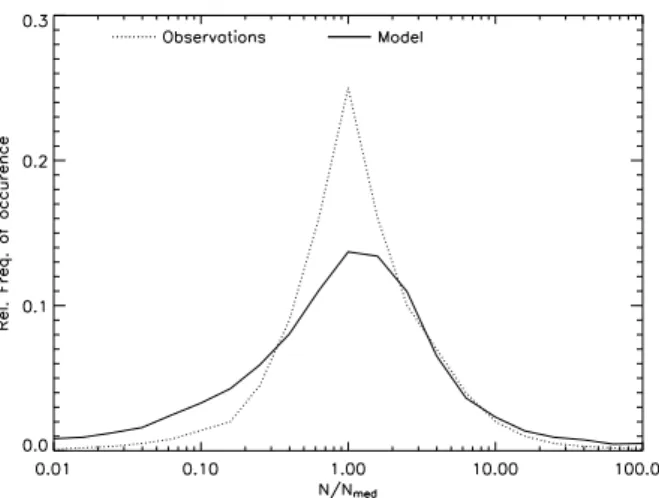
Figure8compares the variability of observed and modelled aerosol about the median for the four experiments combined. It shows the frequency of occurrence of different particle concentrations relative to the median after applying the 120 h filter. The re-sults show that the model correctly captures the frequency of occurrence of particle
5
concentrations greater than the median but tends to overpredict the occurrence of con-centrations much less than the median. The same result is apparent in Fig. 2: for particle diameters greater than about 40 nm the model 5th percentile is lower than the observed 5th percentile. Part of this discrepancy at very low N/Nmed may be due to bad counting statistics at low number concentrations as described in Sect.3. The
ex-10
cessive occurrence of relatively low particle concentrations suggests that the model’s removal processes are too effective. It needs to be borne in mind that this analysis of the grand average variability may obscure regional differences.
7.2 Temporal variability
Heintzenberg et al.(2004) discussed the persistence of MBL aerosol in the Southern
15
Ocean and how it contrasts with that of a continental site. The observations at the continental site show an obvious diurnal cycle but no diurnal cycle is present at the marine site. Figure 9 compares the persistence of GLOMAP and the observations at the remote marine site in the Southern Ocean. The model and observations have several features in common: e.g., the smallest particles have the least persistence;
20
and a lack of a diurnal cycle for any size class in the MBL. The short persistence of small particles is not surprising. It indicates that there is no steady source of small particles and that, when small particles do exist, their persistence is limited by rapid coagulation. The presence of a diurnal cycle at the continental site suggests that the smallest continental particles have a local photochemical source either in or just above
25
the BL. The lack of such a cycle at the marine site suggests that such nucleation is uncommon in the Southern Ocean MBL. Particle formation in the UT will certainly have
ACPD
6, 8871–8915, 2006 Comparison of global aerosol model against observed statistics D. V. Spracklen Title Page Abstract Introduction Conclusions References Tables Figures J I J I Back CloseFull Screen / Esc
Printer-friendly Version
Interactive Discussion a diurnal cycle driven by photochemistry, but the long transport time from the UT to
the BL will tend to smooth this out. In GLOMAP, we include only binary H2SO4−H2O particle nucleation, which does not produce particles in the BL (due to the strong tem-perature dependence of this mechanism) and explains the lack of a diurnal cycle in the model. The good comparison between modelled and observed persistence at this
5
site suggests that the model is correctly calculating the source of secondary particles to the MBL (i.e., from the FT) and would appear to rule out a local particle formation source. Further work needs to determine whether there are regional differences in the importance of particle formation.
8 Sensitivity to in-cloud aerosol activation schemes
10
In the baseline model run aerosol particles are permitted to grow through in-cloud oxi-dation of SO2if they have a dry diameter of ≥50 nm. The use of a globally constant acti-vation diameter is restrictive as the size at which a particle can activate is sensitive to a range of quantities, including the in-cloud updraft velocity, the number of CCN present, and the particle composition. The aerosol activation parameterisation of Nenes and
15
Seinfeld (2003) (hereafter referred to as NS03) has been implemented in GLOMAP to provide a physically more realistic calculation of aerosol activation. NS03 is a physi-cally based aerosol activation scheme which has minimal reliance on empirical data. NS03 has been shown to predict average cloud droplet number concentrations to within ≈20% of observed values in stratiform and cumuliform clouds (Meskhidze et al.,2005).
20
Figure 10 shows a comparison of size-dependent percentiles of number concen-tration simulated using the fixed activation diameter scheme and the NS03 scheme. For NS03, we show results for two fixed updraught speeds and a run with a random updraught speed between two limits.
To minimise the computational expense of multiple model runs for an entire year, we
25
limit model output for the sensitivity tests to a 10 day period in January and a 10 day period in July. Comparisons of this shortened model output (Fig.10a) with that for an
ACPD
6, 8871–8915, 2006 Comparison of global aerosol model against observed statistics D. V. Spracklen Title Page Abstract Introduction Conclusions References Tables Figures J I J I Back CloseFull Screen / Esc
Printer-friendly Version
Interactive Discussion entire model year (Fig.2) shows that we produce number concentrations in any model
bin to typically within ±30%.
The use of a variable activation scheme with a constant updraft speed reduces the depth of the minimum between the Aitken and accumulation modes. This reduction occurs because the NS03 scheme permits the different aerosol distributions to activate
5
with different efficiencies, leading to the prediction of a range of activation diameters. This range smoothes out the minimum between the Aitken and accumulation modes and results in better agreement with the observations. The use of a random distribution of updraft velocities further reduces the minimum between the Aitken and accumulation modes. However, we note that using the NS03 scheme reduces the modelled
accumu-10
lation mode number concentration giving a worse comparison with observations. In the observational data, the mean diameter of the accumulation mode and the di-ameter of the minimum between the Aitken and accumulation modes increases from the 5th to the 50th to the 95th percentile. With the fixed diameter of activation, GLOMAP is unable to capture this shift; the accumulation mode occurs in the same
15
position for all three percentiles. When the NS03 scheme is used, the mean diameter of the accumulation mode is shifted to larger sizes as the percentile increases. This occurs because the NS03 scheme is able to capture the feedback between particle number and the activation diameter: when particle number is small, there are few sites onto which water vapour can condense, thus the maximum supersaturation attained
20
is large, and the corresponding activation diameter is small. Likewise, the maximum supersaturation is suppressed and the activation diameter is large when particle con-centrations are high. This finding highlights the coupling between the particle size distribution and cloud processes.
The NS03 scheme worsens the comparison of model 5th percentile with
observa-25
tions, especially the Aitken mode which is reduced both in size and number. Particle wet removal in our model appears to be too effective resulting in too many occurrences of low particle concentrations in the model (Fig.8). With the standard fixed activation scheme low particle concentration has no impact on the size of particles activated.
ACPD
6, 8871–8915, 2006 Comparison of global aerosol model against observed statistics D. V. Spracklen Title Page Abstract Introduction Conclusions References Tables Figures J I J I Back CloseFull Screen / Esc
Printer-friendly Version
Interactive Discussion With the NS03 scheme low particle concentrations result in particle activation down to
very small diameters which impacts Aitken mode size and number.
9 Conclusions
Recent compilations of marine boundary layer aerosol observations (Heintzenberg
et al.,2000,2004) have allowed a detailed evaluation of a global 3-D sectional aerosol
5
microphysics model against MBL aerosol statistics. We extend previous comparisons of observed and model particle number concentrations (Spracklen et al.,2005a) to in-clude particle number size distributions, probability distributions, and temporal persis-tence of different size particles. The observation datasets allow us to compare global and regional marine aerosol properties.Heintzenberg et al.(2000) bins aerosol
obser-10
vations by 15◦ latitude bands. Heintzenberg et al.(2004) compiles observations from 5 different field experiments (ACE-1, ACE-2, INDOEX/Aerosols99, ACE-Asia) in four different oceans. To minimise contamination from continental sources this database excludes data with less than 120 h travel time from last contact with land.
Our initial model simulations assume that MBL aerosol comprises solely of sulfate
15
and sea salt and activation of aerosol particles into cloud droplets occurs at a fixed size. We then explore the impact of primary continental particle emissions and a more detailed treatment of aerosol activation on modelled MBL aerosol.
The model (with sulfate and sea salt aerosol and fixed activation diameter) simulates realistic global mean Aitken and accumulation mode number. Key aspects of global
20
mean remote MBL aerosol distributions – a bimodal distribution with “closed” size dis-tribution at small particle diameters – are accurately captured by the model. “Closed” size distributions suggest that particle nucleation in the BL is a rare occurrence. In ad-dition we compared model and observed particle persistence in the Southern Ocean MBL, both of which showed no diurnal cycle. In the model this is due to the binary
25
homogeneous H2SO4−H2O nucleation scheme predicting particle formation solely in the cold UT. Transport time from the UT to BL smoothes out the diurnal cycle in the
ACPD
6, 8871–8915, 2006 Comparison of global aerosol model against observed statistics D. V. Spracklen Title Page Abstract Introduction Conclusions References Tables Figures J I J I Back CloseFull Screen / Esc
Printer-friendly Version
Interactive Discussion UT before entrainment into the BL. Accurate average MBL aerosol number, ‘closed’
size distributions and a good comparison between model and observed persistence suggests that a binary homogeneous nucleation scheme correctly calculates the sec-ondary source of particles to the MBL, at least as a global mean.
Our model is less capable of capturing observed regional variations in aerosol
num-5
ber and size distributions. Observed Aitken mode number is up to a factor of 3 higher than in the model between 75◦S and 30◦S, a factor of 10 higher than in the model in the N Atlantic and a factor of 7 lower than the model in the NW Pacific. The work ofPierce
and Adams (2006) suggests that ultrafine sea spray may only contribute to part of the underprediction of Aitken mode number in our model. An alternative explanation may
10
be underprediction of particle nucleation in the lower atmosphere over certain areas of the ocean. Further work is required to establish whether different nucleation mech-anisms result in more realistic regional representation of Aitken mode number without impacting aerosol properties (closed size distributions and temporal persistence) which are well modelled with the current nucleation scheme.
15
Our model underpredicts “grand average” Aitken mode geometric mean diameter by 28% and accumulation mode geometric mean diameter by 15%. Comparison of model and observed FT size distributions suggests that some of the underprediction of Aitken mode size is due to particles not growing sufficiently in the FT before they are entrained into the MBL. This may be due to lack condensable gases, other than
20
sulfuric acid, in our model. The emission of primary carbonaceous aerosol does little to improve modelled Aitken mode or accumulation mode size. Further work is required to investigate the role of secondary organic aerosol which has recently been suggested to contribute greatly to FT aerosol mass (Heald et al.,2005).
Model Aitken mode size is also controlled by the activation diameter of aerosol
par-25
ticles into cloud droplets. Baseline model runs assume a fixed activation diameter of 50 nm. Including a more sophisticated aerosol activation scheme (Nenes and Seinfeld,
2003) improves some aspects of modelled aerosol size distributions. Variable activa-tion diameter results in a more realistic minimum between Aitken and accumulaactiva-tion
ACPD
6, 8871–8915, 2006 Comparison of global aerosol model against observed statistics D. V. Spracklen Title Page Abstract Introduction Conclusions References Tables Figures J I J I Back CloseFull Screen / Esc
Printer-friendly Version
Interactive Discussion mode and allows the model to capture feedbacks between aerosol number and
acti-vation size. In comparison with observed 5th, 50th and 95th percentiles this allows the model to capture the observed increase in accumulation mode size with increasing aerosol number.
The underprediction of accumulation mode size in the MBL is important for
calcula-5
tions of cloud drop number. The importance of this underestimation can be illustrated by considering its effect on the predicted cloud drop number. The Nenes and Seinfeld
(2003) parameterisation predicts the median observed distribution to have an average cloud droplet number concentration (CDN) at cloud base of 207 cm−3, but the average CDN concentration calculated from the model baseline sulfate/sea spray run is just
10
130 cm−3 (using an updraft velocity from 0.5–5.0 ms−1). Some models avoid this un-derestimation by specifying a minimum aerosol concentration in remote regions in the calculation of CDN, but the forcing calculated is then sensitive to the minimum chosen. Emissions of primary particles from anthropogenic sources contribute greatly to model MBL aerosol. When we do not filter out air masses with continental character
15
primary emissions can cause a large increase to both Aitken and accumulation mode number. We explore the impact of anthropogenic sulfate on MBL aerosol. In the North Atlantic between 60 and 90% of sulfate mass across the size range is anthropogenic in origin. This work suggests that even if a back trajectory analysis is used to filter out continental contamination, the North Atlantic is not a good location to study natural
20
aerosol processes many of which will still be dominated by anthropogenic emissions.
Acknowledgements. Grant support from the NERC UK-SOLAS programme and the NERC
Uni-versities Global Atmospheric Modelling Programme (UGAMP) is acknowledged.
References
Adams, P. and Seinfeld, J.: Predicting global aerosol size distributions in general circulation
25
models, J. Geophys. Res.-Atmos., 107, 4370, doi:10.1029/2001JD001010, 2002. 8875, 8886
ACPD
6, 8871–8915, 2006 Comparison of global aerosol model against observed statistics D. V. Spracklen Title Page Abstract Introduction Conclusions References Tables Figures J I J I Back CloseFull Screen / Esc
Printer-friendly Version
Interactive Discussion
Adams, P. and Seinfeld, J.: Disproportionate impact of particulate emissions on global cloud condensation nuclei concentrations, Geophys. Res. Lett., 30, 43–46, 2003. 8886
Andres, R. and Kasgnoc, A.: A time-averaged inventory of subaerial volcanic sulfur emissions, J. Geophys. Res.-Atmos., 103, 25 251–25 261, 1998. 8877
Bates, T., Huebert, B., Gras, J., Griffiths, F., and Durkee, P.: International Global Atmospheric
5
Chemistry (IGAC) project’s first Aerosol Characterization Experiment (ACE 1): Overview, J. Geophys. Res.-Atmos., 103, 16 297–16 318, 1998a. 8906
Bates, T., Kapustin, V., Quinn, P., Covert, D., Coffman, D., Mari, C., Durkee, P., De Bruyn, W., and Saltzman, E.: Processes controlling the distribution of aerosol particles in the lower marine boundary layer during the First Aerosol Characterization Experiement (ACE 1), J.
10
Geophys. Res.-Atmos., 103, 16 369–16 383, 1998b. 8874
Bates, T., Quinn, P., Coffman, D. J., Johnson, J., Miller, T., Covert, D., Wiedensohler, A., Leinert, S., Nowark, A., and Neususs, C.: Regional physical and chemical properties of the marine boundary layer aerosol across the Atlantic during Aerosols99: An overview, J. Geophys. Res.-Atmos., 106, 20 767–20 782, 2001. 8906
15
Bates, T. S., Coffman, D., Covert, D. S., and Quinn, P.: Regional marine boundary layer aerosol size distributions in the Indian, Atlantic, and Pacific Oceans: A comparison of INDOEX mea-surements with ACE-1, ACE-2, and Aerosols99, J. Geophys. Res.-Atmos., 2002. 8905 Benkovitz, C., Scholtz, M., Pacyna, J., Tarras ´on, L., Dignon, J., Voldner, E., Spiro, P., Logan,
J., and Graedel, T.: Global gridded inventories of anthropogenic emissions of sulfur and
20
nitrogen, J. Geophys. Res.-Atmos., 101, 29 239–29 253, 1996. 8877
Bigg, E., Gras, J., and Mossop, D.: Wind-produced submicron particles in the marine atmo-sphere, Atmos. Res., 36, 55–68, 1995. 8873
Bigg, E., Leck, C., and Tranvik, L.: Particulates of the surface microlayer of open water in the central Arctic Ocean in summer, Mar. Chem., 91, 131–141, 2004. 8873
25
Bond, T., Streets, D., Yarber, K., Nelson, S., Woo, J.-H., and Klimont, Z.: A technology-based global inventory of black and organic carbon emissions from combustion, J. Geophys. Res.-Atmos., 109, D14203, doi:10.1029/2003JD00369, 2004. 8887
Capaldo, K., Kasibhatla, P., and Pandis, S.: Is aerosol production within the marine boundary layer sufficient to maintain observed concentrations?, J. Geophys. Res.-Atmos., 104, 3483–
30
3500, 1999. 8873,8874
Chipperfield, M., Cariolle, D., Simon, P., Ramaroson, R., and Lary, D.: A three-dimensional modeling study of trace species in the Arctic lower stratosphere during winter 1989–90, J.
ACPD
6, 8871–8915, 2006 Comparison of global aerosol model against observed statistics D. V. Spracklen Title Page Abstract Introduction Conclusions References Tables Figures J I J I Back CloseFull Screen / Esc
Printer-friendly Version
Interactive Discussion
Geophys. Res.-Atmos., 98, 7199–7218, 1993. 8876
Clarke, A. and Kapustin, V.: A Pacific Aerosol Survey. Part I: A Decade of Data on Particle Production, Transport, Evolution, and Mixing in the Troposphere, J. Atmos. Sci., 59, 363– 382, 2002. 8889,8912
Clarke, A., Davis, D., Kapustin, V., Eisele, F., Chen, G., Paluch, I., Lenschow, D., Bandy, A.,
5
Thornton, D., Moore, K., Mauldin, L., Tanner, D., Litchy, M., Carroll, M., Collins, J., and Albercook, G.: Particle Nucleation in the Tropical Boundary Layer and Its Coupling to Marine Sulfur Sources, Science, 282, 89–92, 1998. 8874
Clarke, A., Owens, S., and Zhou, J.: An ultrafine sea-salt flux from breaking waves: Implications for cloud condensation nuclei in the remote marine atmosphere, J. Geophys. Res.-Atmos.,
10
111, doi:10.1019/2005JD006565, 2006. 8873,8877
Covert, D., Kapustin, V., Quinn, P., and Bates, T.: New Particle Formation in the Marine Bound-ary Layer, J. Geophys. Res.-Atmos., 97, 20 581–20 589, 1992. 8874
Covert, D., Kapustin, V., Bates, T., and Quinn, P.: Physical properties of marine boundary layer aerosol particles of the mid-Pacific in relation to sources and meteorological transport, J.
15
Geophys. Res.-Atmos., 101, 6919–6930, 1996. 8873,8874
Covert, D., Gras, J., Wiedensohler, A., and Stratmann, F.: Comparison of directly measured CCN with CCN modeled from the number-size distribution in the marine boundary layer during ACE 1 at Cape Grim, Tasmania, J. Geophys. Res.-Atmos., 103, 16 597–16 608, 1998. 8905
20
Easter, R., Ghan, S., Zhang, Y., Saylor, R., Chapman, E., Laulainen, N., Abdul-Razzak, H., Leung, L., Bian, X., and Zaveri, R.: MIRAGE: Model description and evaluation of aerosols and trace gases, J. Geophys. Res.-Atmos., 109, D20210, doi:10.1029/2004JD004571, 2004. 8882
Fitzgerald, J.: Marine aerosols: A review, Atmos. Environ., 25, 533–545, 1991. 8873
25
Geever, M., O’Dowd, C., van Ekeren, S., Flanagan, R., Nilsson, E., de Leeuw, G, and Rannik, U.: Submicron sea spray fluxes, Geophys. Res. Lett., L15810, doi:10.1029/2005GL023081, 2005. 8873
Ghan, S., Easter, R., Hudson, J., and Breon, F.-M.: Evaluation of aerosol indirect radiative forcing in MIRAGE, J. Geophys. Res.-Atmos., 106, 5317–5334, 2001. 8875
30
Gong, S., Barrie, L., and Lazare, M.: Canadian Aerosol Module (CAM): A size-segregated simulation of atmospheric aerosol processes for climate and air quality models, 2. Global sea-salt and its budgets, J. Geophys. Res.- Atmos., 107, 4479, doi:10.1029/2001JD002004,