HAL Id: hal-03000463
https://hal.archives-ouvertes.fr/hal-03000463
Submitted on 11 Nov 2020
HAL is a multi-disciplinary open access
archive for the deposit and dissemination of sci-entific research documents, whether they are pub-lished or not. The documents may come from teaching and research institutions in France or abroad, or from public or private research centers.
L’archive ouverte pluridisciplinaire HAL, est destinée au dépôt et à la diffusion de documents scientifiques de niveau recherche, publiés ou non, émanant des établissements d’enseignement et de recherche français ou étrangers, des laboratoires publics ou privés.
Integration
Antonin Leblanc, Nicolas Mercier, Magali Allain, Jens Dittmer, Thierry
Pauporté, Vincent Fernandez, Florent Boucher, Mikael Kepenekian, Claudine
Katan
To cite this version:
Antonin Leblanc, Nicolas Mercier, Magali Allain, Jens Dittmer, Thierry Pauporté, et al.. Enhanced Stability and Band Gap Tuning of α-[HC(NH2)2]PbI3 Hybrid Perovskite by Large Cation Integra-tion. ACS Applied Materials & Interfaces, Washington, D.C. : American Chemical Society, 2019, 11, pp.20743 - 20751. �10.1021/acsami.9b00210�. �hal-03000463�
Hybrid Perovskite by Large Cation Integration.
Antonin Leblanc, Nicolas Mercier, Magali Allain, Jens Dittmer, Thierry Pauporte, Vincent Fernandez, Florent Boucher, Mikaël Kepenekian, and Claudine Katan
ACS Appl. Mater. Interfaces, Just Accepted Manuscript • DOI: 10.1021/acsami.9b00210 • Publication Date (Web): 13 May 2019
Downloaded from http://pubs.acs.org on May 22, 2019
Just Accepted
“Just Accepted” manuscripts have been peer-reviewed and accepted for publication. They are posted online prior to technical editing, formatting for publication and author proofing. The American Chemical Society provides “Just Accepted” as a service to the research community to expedite the dissemination of scientific material as soon as possible after acceptance. “Just Accepted” manuscripts appear in full in PDF format accompanied by an HTML abstract. “Just Accepted” manuscripts have been fully peer reviewed, but should not be considered the official version of record. They are citable by the Digital Object Identifier (DOI®). “Just Accepted” is an optional service offered to authors. Therefore, the “Just Accepted” Web site may not include all articles that will be published in the journal. After a manuscript is technically edited and formatted, it will be removed from the “Just Accepted” Web site and published as an ASAP article. Note that technical editing may introduce minor changes to the manuscript text and/or graphics which could affect content, and all legal disclaimers and ethical guidelines that apply to the journal pertain. ACS cannot be held responsible for errors or consequences arising from the use of information contained in these “Just Accepted” manuscripts.
Enhanced stability and bangap tuning of α-[HC(NH
2)
2]PbI
3Hybrid Perovskite by Large Cation Integration.
Antonin Leblanc,a Nicolas Mercier,*a Magali Allain,a Jens Dittmer,b Thierry Pauporté,c
Vincent Fernandez,d Florent Boucher,d Mikael Kepenekian,e Claudine Katan*e
a MOLTECH-ANJOU, UMR-CNRS 6200, Université d’Angers, 2 Bd Lavoisier, 49045 Angers, France.
b Institut des Molécules et Matériaux du Mans, CNRS UMR 6283, Le Mans Université, Avenue Olivier
Messiaen, 72085 Le Mans cedex 9, France
c Chimie ParisTech, PSL Research University, CNRS, Institut de Recherche de Chimie Paris (IRCP), 11 rue
P. et M. Curie, F-75005 Paris, France.
d Institut des Matériaux Jean Rouxel, UMR-CNRS 6502, Université de Nantes, 2 rue de la Houssinière, BP
32229, 44322 Nantes Cedex 3, France
eUniv Rennes, ENSCR, INSA Rennes, CNRS, ISCR (Institut des Sciences Chimiques de Rennes) - UMR
6226, F-35000 Rennes, France
Keywords: halogenated perovskite, Goldschmidt factor, iodoplumbate, formamidinium, alpha-FAPI, lead deficient perovskite, 3D hybrid perovskite
ABSTRACT
We report room temperature synthesis of lead and iodide deficient α-[HC(NH2)2]PbI3
perovskites (abbreviated d-α-FAPI, FA+ = formamidinium),
owning the general formula
(A’,FA)1+x[Pb1-xI3-x] (with A’ = hydroxyethylammonium (HEA+) or thioethylammonium 3 4 5 6 7 8 9 10 11 12 13 14 15 16 17 18 19 20 21 22 23 24 25 26 27 28 29 30 31 32 33 34 35 36 37 38 39 40 41 42 43 44 45 46 47 48 49 50 51 52 53 54 55
(TEA+) cations, 0.04 ≤ x ≤ 0.15). These materials retain a 3D character of their perovskite
network despite incorporation of large HEA+ or TEA+ cations, demonstrating that the
Goldschmidt tolerance factor can be bypassed. We found that thin films of (TEA,FA)1+x[Pb1-xI3-x] (x= 0.04 and 0.13) show exceptional α-phase stability under
ambient conditions, one order of magnitude higher compared to α-FAPI and α-(Cs,FA)PbI3
thin films. d-α-FAPI phases are shown to maintain a direct bandgap, which increases monotonously for x ranging from 0 up to 0.20, with characteristics of a p-type semiconductor for low concentrations of vacancies (x ≤ 0.13) and n-type for larger ones. They offer an alternative to reach methylammonium- and bromine-free stable α-FAPI type phase, and open new avenues in the field of perovskite solar cells, up to bandgap tuning desirable for tandem solar cells.
INTRODUCTION
Since 2012, perovskite based solar cells (PSCs) have shown an impressive potential, combining advantages of low-temperature thin film processing (cost process less than half of the price of c-Si solar cell technology),1,2 a high power conversion efficiency (PCE)
certified up to 23.7%,3,4 and the possibility of recycling the solar cells.5,6 However, the
well-known (CH3NH3)PbI3 hybrid perovskite (abbreviated MAPI, with MA+ =
methylammonium) firstly used in PSC has shown a fast degradation under air exposure that hinders market development.7 Consequently, a chemical approach has been applied
consisting in substituting the MA+ cation with a less hydrophilic one, presenting a
Goldschmidt tolerance factor in the 0.8-1.0 range suitable for the perovskite phase.8
Formamidinium (FA+) has been considered as a good candidate since the Goldschmidt
factor of FAPbI3 (called FAPI), is close to 1.0.8 Unfortunately, the perovskite α-FAPI 3 4 5 6 7 8 9 10 11 12 13 14 15 16 17 18 19 20 21 22 23 24 25 26 27 28 29 30 31 32 33 34 35 36 37 38 39 40 41 42 43 44 45 46 47 48 49 50 51 52 53 54
phase, which possesses a better thermal stability and a more suitable bandgap than MAPI,9
is only synthesized and is thermodynamically stable beyond 150°C. When cooling down to room temperature under ambient atmosphere, α-FAPI rapidly transforms into δ-FAPI, an undesirable polymorph phase that does not present a perovskite architecture nor photoactivity.10 In order to slow down this α-to-δ phase transformation, a double cation
strategy was first developed. This chemical approach consists of the α-phase stabilisation by mixing two materials possessing a large and a small Goldschmidt tolerance factors, leading to an alloy which owns a balanced factor comprised between the suitable range [0.8 - 1.0]. The resulting two archetype compounds are Cs0.15FA0.85PbI3 and
MA0.20FA0.80PbI3.11,12 This strategy was successful as the α-to- phase transformation was
observed after a longer time (air condition) than with α-FAPI, and improved efficiencies for solar cells were also achieved.Subsequently, other combinations of multiple cations and mixed halide were employed, leading to the most stable and efficient alloys α-(Rb/Cs/MA)0.20-0.25FA0.75-0.80Pb(I0.85Br0.15)3, regularly exceeding 20% solar cells.13-20
However, despite the beneficial effects of the presence of MA+ and Br- ions on the α-phase
purity, crystallinity, stability and on solar cell efficiencies, both volatile MA+ cation and
Br- halide induce thermal degradation and an unsuitable blue-shift of the bandgap.21
Moreover, from a chemical point of view, this multi-cations alloying strategy is still sorely limited by the choice of the cations that possess a suitable size to keep a 3D perovskite architecture.
Recently, we have reported unprecedented lead and iodide deficient hybrid perovskite materials (d-HP family), owning a general formulation (A’)3.48x(A)1-2.48x[Pb1-xI3-x], where
A= MA+ and A’= HEA+ (hydroxyethylammonium HO-(CH
2)2-NH3+).22 The resulting 3 4 5 6 7 8 9 10 11 12 13 14 15 16 17 18 19 20 21 22 23 24 25 26 27 28 29 30 31 32 33 34 35 36 37 38 39 40 41 42 43 44 45 46 47 48 49 50 51 52 53 54 55
phases, named d-MAPI, present a 3D perovskite corner-shared Pb1-xI3-x (x = 0 to 0.20)
network, which can be described as a lead and iodide deficient PbI3 MAPI network. A
slightly improved air stability has been demonstrated for this d-MAPI phases as compared to MAPI.22 More recently, Diau et al. have prepared the tin analogue (d-(MA)SnI
3) which
also shows good air stability.23 This superior air stability was also observed for the hollow
hybrid perovskites named (A’,A)MI3 (A’=en2+ = ethylenediammonium, A = MA+/FA+, M
= Pb2+/Sn2+) reported by the Kanatzidis'group.24 When A= FA+, a series of hollow
perovskites are obtained: (FA)1-x(en)xPb0.7xI3-0.4x. However, they are synthesized at
temperatures over 100 °C, as the α-FAPI phase, and no thin film preparation (and so no thin film stability test) of these hollow-α-FAPI phases has been reported. 24
In this study, we report the room temperature synthesis of a family of lead and iodide deficient α-FAPI (d-α-FAPI) hybrid perovskites. These 3D perovskites incorporate the formamidinium cation and a larger size cation, either the hydroxyethylammonium (HEA+, d-α-FAPI-Hx compounds) or the thioethylammonium (TEA+, d-α-FAPI-Tx compounds)
monocation. The general formula of these materials is (FA,A’)1+x[Pb1-xI3-x] with A’= HEA+
or TEA+. Crystals of d-α-FAPI have been grown, allowing the selection and structure
determination of one composition, (HEA)0.406(FA)0.698[Pb0.896I2.896] (x = 0.104, written
d-α-FAPI-H0.104), which revealed the 3D nature of the perovskite network. Several materials
have been also prepared as pure crystallized powder phases, two d-α-FAPI-Hx (with x =
0.13 and x = 0.15, here abbreviated H0.13, and H0.15), and one d-α-FAPI-Tx (x = 0.04,
abbreviated T0.04), as well as thin films (H0.13, H0.15, T0.04 and also T0.13 (x = 0.13)).
Powders and thin films have been fully characterized by X-ray diffraction, NMR (liquid and solid state), energy dispersive X-ray spectroscopy (EDX), elemental analysis,
UV-3 4 5 6 7 8 9 10 11 12 13 14 15 16 17 18 19 20 21 22 23 24 25 26 27 28 29 30 31 32 33 34 35 36 37 38 39 40 41 42 43 44 45 46 47 48 49 50 51 52 53 54
visible absorption and X-ray photoelectron spectroscopy (XPS) measurements. Moreover, the analysis has been completed by computational DFT investigations. Besides the fact that these α-FAPI type phases can be synthesized at room temperature, we show that the stability of the α phase at room temperature and under ambient condition (thin films, case of d-α-FAPI-Tx materials) is exceptionally improved compared to both FAPI and
α-Cs0.15FA0.85PbI3 reference materials.
RESULTS AND DISCUSSION
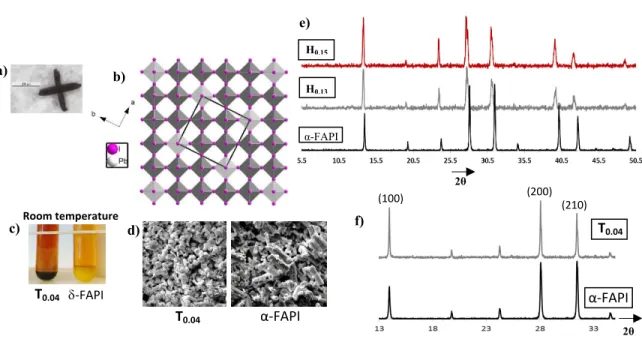
Crystals of d-α-FAPI have been obtained at room temperature by slow liquid-gas diffusion process using aqueous hydroiodic acid and ethanol as solvent and anti-solvent, respectively (more details in Supporting Information -I.a-). These crystals have a cross shape (Figure 1a), and depending on experimental conditions they can be black or dark red. It is also worth noting that no yellow crystals of δ-FAPI were co-crystallized. For all x values , single-crystal X-ray diffraction analysis of d-α-FAPI-Hx has revealed room temperature
tetragonal unit cells (a = b = 14.471 Å, c = 6.448 Å, α = β = γ = 90°, V = 1350.2 Å3),
slightly larger than the previously reported d-MAPI unit cell (also obtained at room temperature: a = b = 14.312 Å, c = 6.366 Å, α = β = γ = 90°, V = 1303.9 Å3).22 This can be
correlated to the effective radius of FA+ (253 pm) which is larger than the one of MA+ (217
pm).25 The structure of the d-α-FAPI-H
x was studied from one single crystal selected
among many other. The d-α-FAPI-Hx phase crystallises at room temperature into the P4/m
space group (see S.I. IV, Table S7). Despite several attempts at different temperatures (100-293K range), the X-ray study has only allowed the determination of the inorganic network. This can be partly explained at room temperature by a dynamical disorder of both HEA+ 3 4 5 6 7 8 9 10 11 12 13 14 15 16 17 18 19 20 21 22 23 24 25 26 27 28 29 30 31 32 33 34 35 36 37 38 39 40 41 42 43 44 45 46 47 48 49 50 51 52 53 54 55
and FA+ organic cations, as revealed by solid state NMR experiments (see below). At lower
temperature, this may be explained by a statistical disorder. Structural refinements finally led to a Pb4.48I14.48 formula per unit cell for the inorganic part. The structure can be
described from a main 3D Pb4I14 perovskite network of corner-sharing PbI6 octahedra with
a 3D arrangement which generates channels along the c axis (Figure 1b). These channels are half filled with extra Pb2+ and I- ions, located in (0, 0, 0) and (0, 0, 0.5), respectively.
To highlight the lead and iodide deficiency of this 3D perovskite network, the Pb4.48I14.48
formula should be written as Pb0.896I2.896 or Pb1-xI3-x with x = 0.104 (d-α-FAPI-H0.104). The
general formulation of the d-α-FAPI-Hx phases is (HEA)3.9x(FA)1-2.9x[Pb1-xI3-x] or
(HEA,FA)1+x[Pb1-xI3-x] according to different chemical analyses of crystals and powders
(see below and S.I.) and therefore the formula of this studied crystal is (HEA)0.406(FA)0.698[Pb0.896I2.896]. Thus, the lead and iodide deficient d-α-FAPI phase can
be described from the α-FAPI phase through a substitution of x (PbI)+ units by x organic
cations, HEA+ or FA+. In the case of x = 0.2 (Pb
0.8I2.8 or Pb4I14 network), all Pb2+ and I- ions
along the c direction have been substituted by organic cations leading to empty channels. When 0 ≤ x ≤ 0.2 (case of the studied crystal d-α-FAPI-H0.104), the X-ray analysis shows
that channels contain Pb2+ and I- anions as well as organic cations. Consequently, one
hypothesis is a partial filling of channels by Pb2+ and I-. Another hypothesis is that
intermediate values of x may correspond to a limited number of empty channels in the structure (see below the model structures used for calculations). Finally, it must be noted that the poor quality of crystals of d-α-FAPI-Tx precluded their X-ray single crystal
analysis. 3 4 5 6 7 8 9 10 11 12 13 14 15 16 17 18 19 20 21 22 23 24 25 26 27 28 29 30 31 32 33 34 35 36 37 38 39 40 41 42 43 44 45 46 47 48 49 50 51 52 53 54
From the crystal structure analysis of the anhydrous iodide salts of hydroxyethylammonium (HEAI) and thioethylammonium (TEAI) which have revealed that HEA+ and TEA+ cations adopt a curving shape (S.I. Tables S8 and S9), we estimated
the effective radius of HEA+ (3.44 Å) and TEA+ (4.14 Å) according to the model proposed
by Kieslich et al.25 Thus, the Goldschmidt factors of the hypothetical (HEA)PbI 3 and
(TEA)PbI3 perovskites were calculated as 1.24 and 1.39, respectively. These values are far
from the expected 0.8-1.0 range usually necessary to stabilize the 3D ABX3 perovskite.8
However, the 3D perovskite structures of α-FAPI type prepared in this work (d-α-FAPI phases) have been stabilized despite the incorporation of these HEA+ / TEA+ cations (see
below). This is explained by the presence of (PbI)+ vacancies in the 3D network. This
family of compounds (d-HP) shows that it is possible to circumvent the geometrical Goldschmidt factor and to obtain 3D hybrid perovskites even using larger R-NH3+ organic
cations. Moreover, the integration of HEA+/TEA+ cation allows the synthesis at room
temperature of the α-FAPI type network (d-α-FAPI) while α-FAPI reference is prepared only at temperature over 150 °C.
3 4 5 6 7 8 9 10 11 12 13 14 15 16 17 18 19 20 21 22 23 24 25 26 27 28 29 30 31 32 33 34 35 36 37 38 39 40 41 42 43 44 45 46 47 48 49 50 51 52 53 54 55
2θ H0.15 H0.13 α-FAPI e) 2θ (100) (200) (210) T0.04 α-FAPI f) T0.04 α-FAPI d) a) b) Room temperature -FAPI T0.04 c)
Figure 1. a) Cross-shaped crystals of d-α-FAPI. b) View along the c axis of the tetragonal unit cell (black square) of the structure of (HEA,FA)1.104[Pb0.896 I2.896] showing the lead
and iodide deficient perovskite network (dark grey octahedra : full Pb2+ and I- sites
occupancy, light grey octahedra: half Pb2+ and I- sites occupancy). c) Photography of T 0.04
and δ-FAPI powders synthesized at room temperature; d) SEM images of crystallized powders of T0.04 and α-FAPI; e) XRD patterns of H0.13, H0.15 and α-FAPI powders showing
the shift of lines towards low angles for H0.13 and H0.15; f) XRD patterns of T0.04 and
α-FAPI powders highlighting the (100), (200) and (210) diffraction lines.
Powders of d-α-FAPI-Hx and d-α-FAPI-Tx were prepared by a fast precipitation method at
room temperature. Increasing amounts of hydroxyethylamine/FAI/PbI2 or
thioethylamine/FAI/PbI2 were dissolved at room temperature into aqueous hydroiodic acid
under ultrasonication until the saturation was reached. Then, the saturated solution was
3 4 5 6 7 8 9 10 11 12 13 14 15 16 17 18 19 20 21 22 23 24 25 26 27 28 29 30 31 32 33 34 35 36 37 38 39 40 41 42 43 44 45 46 47 48 49 50 51 52 53 54
poured into ethyl acetate, immediately leading to the precipitation of a powder (more details in S.I. I.b). Pure d-α-FAPI-Hx phases with x = 0.13 (H0.13) and x = 0.15 (H0.15), as
well as one pure phase of d-α-FAPI-Tx with x = 0.04 (T0.04), were obtained and fully
characterized. We also prepared the δ-FAPI by starting from PbI2 and FAI as reagents, and
also synthesized α-FAPI compound by heating the δ-FAPI powder at 155°C during 30 min. A color change then occurs from yellow to black characterizing the δ-FAPI to α-FAPI phase transition. Despite our best efforts to precipitate pure phases with compositions in the x = 0-0.20 range, only one composition could be obtained for d-α-FAPI-Tx (T0.04) while
two distinct compositions (H0.13 and H0.15) where obtained with HEA+. In all other
experiments, the yellow δ-FAPI was crystallized as impurity. Figure 1c (zoomed Figure S7) shows a photography of δ-FAPI and T0.04 precipitated powders. δ-FAPI powder has a
typical yellow color while the T0.04 powder is black, showing that another phase is obtained
when a small amount of TEA+ is incorporated in the system, which will be proved to be a
FAPI type phase (d-FAPI). Furthermore, it is worth noting that the morphology of α-FAPI and T0.04 micrometer-size crystals (obtained by the precipitation method) are very
different, as shown by scanning electron microscopy images (Figure 1d, zoomed Figure S8). Indeed, the elongated shape of α-FAPI crystals is the consequence of the preferential growth along the PbI3- chain direction of the initial δ-FAPI compound,10 while a cube shape
is observed for T0.04 crystals proving that the cubic α-FAPI type network was directly
obtained. H0.13, H0.15 and T0.04 samples have been fully characterized, first by energy
dispersive X-ray spectroscopy (EDX) allowing the determination of the I/Pb atomic ratios. Considering the inorganic network [Pb1-xI3-x] as found in the d-MAPI phases
(HEA,MA)1+x[Pb1-xI3-x],22 and in this studied crystal H0.104 (Pb0.896I2.896 network, x= 0.104), 3 4 5 6 7 8 9 10 11 12 13 14 15 16 17 18 19 20 21 22 23 24 25 26 27 28 29 30 31 32 33 34 35 36 37 38 39 40 41 42 43 44 45 46 47 48 49 50 51 52 53 54 55
the measured I/Pb atomic ratios gave x = 0.13 for H0.13, x = 0.15 for H0.15, and x = 0.04 for
T0.04 (Figures S1, S8, and Tables S3, S6). Moreover, 1H nuclear magnetic resonance
spectroscopy (NMR) in solution led to determine the following HEA+/FA+ and TEA+/FA+
molecular ratios: HEA+/FA+ =0.81 for H
0.13 and 1.13 for H0.15, and TEA+/FA+ = 0.13 for
T0.04 (Figures S2-S6, S9-11). The following formulations were thus deduced:
(HEA)0.51(FA)0.62[Pb0.87I2.87] (H0.13) and (HEA)0.60(FA)0.55[Pb0.85I2.85] (H0.15), consistent
with the general formulation of (HEA)3.9x(FA)1-2.9x[Pb1-xI3-x], with x = 0.13 and x = 0.15;
and (TEA)0.12(FA)0.92[Pb0.96I2.96] (T0.04, x = 0.04). All these compositions were finally
confirmed by elemental analysis (Tables S1, S2, S4, and S5). The purity of all these crystallized powders was also verified by powder X-ray diffraction (XRD) analysis. The XRD patterns of the yellow δ-FAPI and the black α-FAPI powders (Figures S12 and S13) perfectly fit with their theoretical XRD patterns, calculated from both known δ-FAPI and α-FAPI structures (δ-FAPI: hexagonal P63mc, a = b = 8.7 Å, c = 7.9 Å; α-FAPI: cubic
Pm-3m, a = 6.362 Å for).10,26
As regards H0.13 and H0.15 powders, their XRD patterns are in good agreement with the
calculated XRD pattern from the single crystal data of (HEA,FA)1.104[Pb0.896I2.896] (Figure
S14). In Figure 1e, diffractograms of H0.13, H0.15 and α-FAPI powders are provided.
Compared to α-FAPI, a slight shift of most peaks of H0.13 and H0.15 towards lower angles
is observed (see also zoom in Figure S15). This phenomenon, revealing a slight increase of unit cell parameters through the substitution process of (PbI)+ units by organic cations,
has been already observed in the case of d-MAPI phases (HEA,MA)1+x[Pb1-xI3-x].22 Three
peaks of low intensity which were expected at low 2θ angles (6.2°, 8.7°, 12.3°) are absent in the XRD patterns of H0.13 and H0.15 (Figure 1e and Figure S14 -theoretical XRD
pattern-3 4 5 6 7 8 9 10 11 12 13 14 15 16 17 18 19 20 21 22 23 24 25 26 27 28 29 30 31 32 33 34 35 36 37 38 39 40 41 42 43 44 45 46 47 48 49 50 51 52 53 54
). These lines are assigned to (1 0 0), (1 1 0) and (2 0 0) planes of the tetragonal unit cell (a = 14.312 Å, c = 6.366 Å) typical of the d-HP phase22 (see Figure 1b). The fact that these
lines are not observed could be explained by a preferential orientation phenomenon of (0 0 l) type, but most probably the smaller unit cell observed is resulting of a non-ordered distribution of defaults (lead and iodide vacancies) as observed in hollow structures based on ethylenediammonium cations.24 Unlike the d-α-FAPI-H
x phases, the XRD pattern of
T0.04 does not present significant shifts compared to the α-FAPI XRD one (Figures 1f, S16).
This may be explained by the low incorporation of TEA+ cations into this T
0.04 phase (x=
0.04, TEA/FA= 0.13). Nevertheless, we can notice differences for several diffraction peak intensities. Thus, the intensities I(100)/I(200) ratio ((100) line at 13.9° and (200) line at 28.0°) appears higher in T0.04 than in α-FAPI, and this cannot be explained by a preferential
orientation phenomenon. We also notice that I(210) ((210) line at 31.4°) is lowered in T0.04
compared to α-FAPI. This feature is probably the consequence of a slight structural modification involved by the incorporation of TEA+ in T
0.04. Moreover, this phenomenon
is also observed when materials (T0.04, T0.13, and α-FAPI) are prepared as thin films (see
below). 3 4 5 6 7 8 9 10 11 12 13 14 15 16 17 18 19 20 21 22 23 24 25 26 27 28 29 30 31 32 33 34 35 36 37 38 39 40 41 42 43 44 45 46 47 48 49 50 51 52 53 54 55
c) b)
a)
Figure 2. a) Direct excitation solid state NMR spectra of α-FAPI, H0.13, H0.15, and T0.04,
scaled according to the number of scans. b) The upfield region of the direct excitation spectra (red) of H0.13 and T0.04 compared to the corresponding cross polarization spectra
(blue). Arbitrary scale. c) View along the c axis of the tetragonal unit cell (black square) of a hypothetical structure of d-α-FAPI with x = 0.20 (resulting formula of (HEA or TEA, FA)1.2[Pb0.8 I2.8]). The organic cations are located on the three different crystallographic
site n°1, n°2 and n°3 (blue, yellow and green circles, respectively).
13C solid state NMR was used to characterize the organic cations, invisible to XRD, verify
their incorporation into the perovskite framework and gain information on their dynamics. While the direct excitation 13C spectrum of α-FAPI shows the expected single signal of the
FA+ carbon (at 155.5 ppm), the materials H
0.13 and H0.15 show two additional signals
around 61 and 45 ppm, corresponding to –CH2–OH and of –CH2–NH3+ of the HEA+ cation,
respectively (Figure 2a). Concerning the FA+ signal, it shifts upon the insertion of the other
cations, similar to MA+ in d-MAPI phases,22 but also splits into three signals, at identical 3 4 5 6 7 8 9 10 11 12 13 14 15 16 17 18 19 20 21 22 23 24 25 26 27 28 29 30 31 32 33 34 35 36 37 38 39 40 41 42 43 44 45 46 47 48 49 50 51 52 53 54
positions for H0.13 and H0.15. These observations are consistent with the possible occupation
of different sites in this lead and iodide deficient perovskite network: three sites for the FA+ ions, and probably only the sites n°2 and n°3 for HEA+ ions (see below Figure 2c).
The least shifted (0.2 compared to 0.9 and 2.2 ppm) signal is here most likely from FA+ on
the site corresponding to the unmodified FAPI structure (site n°1). There is also dispersion in the HEA+ signals: both signals in both samples consist of a dominant peak on the
downfield side, interpreted as stemming from HEA+ on the more abundant site n°2 , and a
broader foot upfield, attributed to HEA+ on site n°3. The chemical shift range of the latter
contains the shift of HEAI, because the local environment of the carbons on site n°3 is closer to those in HEAI (Figure S22). The HEA+ signals show substructures, in particular
the foot of –CH2–NH3+ on site n°3, indicating that these cations are not all incorporated in
the same way or that there are preferential orientations. In fact, 13C cross-polarization (CP)
spectra of H0.13 and H0.15 exhibit intense signals compared to -FAPI showing that the free
rotation of the cations is restrained by the structure (Figure S22). This counts in particular for the bigger HEA+ cations. It is thus imaginable that there are preferred orientations that
have lifetimes being long enough that the NMR signals are not fully averaged.
For T0.04, the CH2 13C signals of TEA+ are hardly detectable by a direct excitation
experiment. Their shifts are 45.9 and 30.3 ppm, respectively, different from those of TEAI (Figure S22). The 13C CP experiment reveals a broad distribution of additional signals in
the CH2 region (Figure 2b). Note that this experiment is not quantitative and enhances
signals stemming from less mobile molecules or molecule groups. In the direct excitation experiment their intensity is so low that they are largely covered by the noise. Nevertheless, as they are spread over a broader range, they probably constitute the major part of TEA+. 3 4 5 6 7 8 9 10 11 12 13 14 15 16 17 18 19 20 21 22 23 24 25 26 27 28 29 30 31 32 33 34 35 36 37 38 39 40 41 42 43 44 45 46 47 48 49 50 51 52 53 54 55
(This finding is in contrast to H0.13 and H0.15, where the shapes of the signals acquired with
CP and direct excitation are essentially identical, indicating that the dynamics of all HEA+
is similar (Figure 2b, H0.13).) Incorporated TEA+ thus presents in the majority much less
rotational mobility compared to the other organic cations(FA+, HEA+in H
0.13 and H0.15). 3 4 5 6 7 8 9 10 11 12 13 14 15 16 17 18 19 20 21 22 23 24 25 26 27 28 29 30 31 32 33 34 35 36 37 38 39 40 41 42 43 44 45 46 47 48 49 50 51 52 53 54
c) a) Annealing: 155°C 125°C 125°C 125°C 125°C 125°C α-FAPI δ-FAPI H0.13 H0.15 T0.04 T0.13 b) Wavelength (nm) α-FAPI T0.04 T0.13 H0.13 H0.15 Absorban ce (u .a)
Figure 3. a) Photography of α-FAPI, δ-FAPI, H0.13, H0.15, T0.04 and T0.13 thin films and
their associated temperatures of annealing. b) UV-visible absorbance spectra of α-FAPI (black), H0.13 (red), H0.15 (green), T0.04 (grey), and T0.13 (blue) thin films. c) XPS spectra of
H0.13 (red), H0.15 (green), T0.04 (grey) and T0.13 (blue)thin films, representing the valence
band (VB) energies relative to the Fermi energy (EF-EVB). Inset: respective both energies
(eV) of EF-EVB (pos.) and FWHM. 3 4 5 6 7 8 9 10 11 12 13 14 15 16 17 18 19 20 21 22 23 24 25 26 27 28 29 30 31 32 33 34 35 36 37 38 39 40 41 42 43 44 45 46 47 48 49 50 51 52 53 54 55
Thin films of d-α-FAPI-Hx and d-α-FAPI-Tx phases as well as α-FAPI were prepared by
spin coating at room conditions (see S.I. -I.e- for details). The precursors were added into a solution of dimethylformamide (DMF), and depending on stoichiometries of the reagents, we prepared α-FAPI (PbI2/FAI: 1/1), H0.13 (PbI2/FAI/HEAI: 3/3/1), H0.15 (PbI2/FAI/HEAI:
3/3/2), T0.04 (PbI2/FAI/TEAI: 3/3/0.5), and contrary to the precipitated powders, we were
able to prepare another successfully pure composition T0.13 (x = 0.13; PbI2/FAI/TEAI:
3/3/1.0). The spinning step was followed by an annealing treatment of thin films, at 155°C for α-FAPI and at 125°C for H0.13, H0.15, T0.04, and T0.13. We must notice that the annealing
of the FAPI thin film at 125 °C results in the formation of -FAPI as a pure phase (yellow thin film). After the annealing step, thin films of α-FAPI, H0.13, T0.04, and T0.13 are black,
and red for H0.15 (see Figure 3a).
As for powders, the I/Pb ratio of this films were determined from EDX analysis, leading to
x = 0.13 (H0.13), x = 0.15 (H0.15)(Figure S1, Table S3), x = 0.04 (T0.04),and x = 0.13 (T0.13)
(Figure S8, Table S6). XRD measurements revealed that H0.13 and H0.15 thin films were
obtained as pure phases without the presence of δ-FAPI, α-FAPI or PbI2. The XRD patterns
of H0.13 and H0.15 exhibit a shift of most of peaks towards lower angles compared to the
lines of α-FAPI, as observed for powders. We also notice that the three very weak peaks at low 2θ angle (6.2°, 8.7°, 12.3°), typical of the tetragonal super-cell of such d-HP (see single crystal study) are observed in the thin film pattern of H0.15 (Figure S17). As in the case of
d-α-FAPI-Hx phases, XRD patterns of T0.04 and T0.13 thin films show single phase layers
without the presence of PbI2 (Figure S20). This is in contrast with the XRD of α-FAPI thin
film (PbI2 is known to be easily generated during the annealing treatment at 155°C -room
conditions-) (Figures S18, S19).27,28 As observed in the XRD of T
0.04 powder and the XRD
3 4 5 6 7 8 9 10 11 12 13 14 15 16 17 18 19 20 21 22 23 24 25 26 27 28 29 30 31 32 33 34 35 36 37 38 39 40 41 42 43 44 45 46 47 48 49 50 51 52 53 54
of ethylene diammonium (en2+) based hollow perovskites (FA)
1-x(en)x(Pb)1-0.7x(I)3-0.4x,24
there is no significant shift of diffraction lines in the XRD patterns of T0.04 and T0.13 thin
films compared to the one of α-FAPI phase. However, the specific features observed in the XRD pattern of T0.04 powder compared to the one of α-FAPI, which have a higher
I(100)/I(200) ratio ((100) line at 13.9°, (200) line at 28.0°) and a lower I(210) intensity ((210) line at 31.4°), are also observed for T0.04 and T0.13 thin films (Figure S20).
The UV-visible absorption spectra of α-FAPI and H0.13, H0.15, T0.04, T0.13 thin films are
compared in Figure 3b, and the optical bandgaps were determined from Tauc plot graphs (S.I., Figure S21) leading to 1.50 eV for α-FAPI, 1.51 eV for T0.04, 1.53 eV for H0.13 and
T0.13, 1.90 eV for H0.15. For x ≤0.13, both the observed blue shift of the bandgap and the
decreasing absorption intensity in the 600-800 nm range are proportional to the x value of the perovskite frameworks [Pb1-xI3-x], consistently with earlier findings on d-MAPI and hollow perovskites.22,24 Interestingly, from x = 0.13 to x = 0.15, the blue shift of the optical
bandgap becomes huge. A similar distinctive behaviour is observed using XPS measurements (Figure 3c): the valence band (VB) energies relative to the Fermi energy (EF-EVB) is found almost unchanged for T0.04, T0.13 and H0.13, (0.59 eV, 0.63 eV and 0.64
eV, respectively), whereas it largely increases for H0.15 (1.50 eV). Meanwhile, by using
low-lying electronic levels of iodine (4d) or lead (4f) as a reference, it is shown that the position of the VB is independent of the composition (S.I., Table S10). Besides, the XPS revealed also two different types of N atom for our d-α-FAPI compounds: NH3+ group
belonging to HEA+/TEA+ and NH
2+ to FA+. Note that, as expected, only the N atom of
NH2+ was observed for α-FAPI (as for examples T0.13 and α-FAPI, Figure S23). Moreover,
as reported with d-MAPI,22 the incorporation of HEA+/TEA+ cations has the consequence 3 4 5 6 7 8 9 10 11 12 13 14 15 16 17 18 19 20 21 22 23 24 25 26 27 28 29 30 31 32 33 34 35 36 37 38 39 40 41 42 43 44 45 46 47 48 49 50 51 52 53 54 55
to eliminate the formation of Pb(0) under continuous X-ray irradiation compared to the reference α-FAPI (Figure S24).
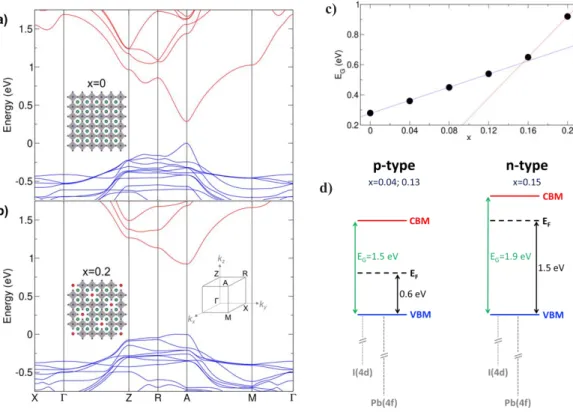
Furthermore insight into the electronic structure of d-α-FAPI compounds has been obtained by computational investigations based on density functional theory (DFT) including spin-orbit coupling. The starting point for the calculations is the X-ray resolved structure of d-α-FAPI-H0.104 crystal in the P4/m group with partial occupation of (0, 0, 0) and (0, 0, 0.5)
lead and iodide sites (see above). As a result of the dynamical motion of the organic cation evidenced by solid state NMR spectroscopy (see above), no structural information is available for those cations. Thus, in order to compensate the negative charge of the inorganic part, Cs+ cations have been placed at the center of the vacancies, where FA+ are
expected to be located (Figures 4a & 4b, and zoomed view Figure S25). As such, the distinctive nature between the three sites defined in Figure 2c relies solely on the inorganic framework. Such a substitution has proved very useful for 3D and layered perovskites,30,31
and holds whenever the molecular frontier orbitals are far above and far below the conduction (CB) and valence bands, respectively. The first structural model corresponds to an ideal 3D network with no deficiency of lead and iodide (x = 0.00). As expected, it shows a direct bandgap at A with a computed bandgap energy EG = 0.28 eV (Figure 4a). It
is well-known that Kohn-Sham DFT dramatically underestimates bandgaps in semiconductors, although it correctly describes trends. The second structural model considers the other extreme of the experimentally determined crystal structure where all the partially occupied sites are taken empty (x = 0.20). To retain charge neutrality, additional Cs+ cations are placed at the position of missing Pb atoms, where HEA+ or TEA+
cations are expected to be inserted. As a result, channels appear with deficiency of lead and
3 4 5 6 7 8 9 10 11 12 13 14 15 16 17 18 19 20 21 22 23 24 25 26 27 28 29 30 31 32 33 34 35 36 37 38 39 40 41 42 43 44 45 46 47 48 49 50 51 52 53 54
iodide. Despite the extent of the transformation, the resulting band structure (Figure 4b) shows remarkably similar features to the pristine system, including a direct bandgap at A. Meanwhile, the deficiency in lead and iodide atoms leads to two notable differences. Firstly, the bandgap EG undergoes a sizeable increase to 0.92 eV, which is in qualitative
good agreement with UV-visible spectra (Figure 3b). Concomitantly, the bandwidth of both the valence and conduction bands decreases, which is indicative of increased effective masses with variations of about +50% and +40% for holes and electrons, respectively. Naturally, the larger effective masses of charge carriers hinder the optoelectronic properties of x = 0.20 material by lowering the probability to extract charges in the case of solar cells.
3 4 5 6 7 8 9 10 11 12 13 14 15 16 17 18 19 20 21 22 23 24 25 26 27 28 29 30 31 32 33 34 35 36 37 38 39 40 41 42 43 44 45 46 47 48 49 50 51 52 53 54 55
d) c)
Figure 4. a) Electronic band structure for the structure deprived of lead vacancy. b) Same for a
concentration of vacancies x = 0.2. Insets present the structure used for calculations with Pb and I atoms in grey and violet, respectively. Green and red balls show the positions of Cs+ cations. Red
balls mark the position of PbI vacancies. c) Computed bandgap EG (eV) with respect to the vacancy
concentration x. Lines in blue and red correspond to linear fits plotted as guide for the eye. d) Schematic evolution of band edges and Fermi level position derived from XPS and DFT results.
3 4 5 6 7 8 9 10 11 12 13 14 15 16 17 18 19 20 21 22 23 24 25 26 27 28 29 30 31 32 33 34 35 36 37 38 39 40 41 42 43 44 45 46 47 48 49 50 51 52 53 54
To further investigate the impact of composition, we designed a supercell (see S.I., Figure S25). This supercell allows to consider structural defective compositions with x = 0.00, 0.04, 0.08, 0.12, 0.16 and 0.20 and monitor the evolution of EG with respect to x (Figure
4c). As expected, a monotonous increase of EG is obtained between the two end
compositions but, two regions can be identified marked by a steep opening of the bandgap for x > 0.12 much greater than the one observed for x ≤ 0.12. (blue and red lines on Figure 4c). Indeed, the linear opening of the bandgap seen for x >0.12 is three times steeper than the one observed for x ≤0.12. This computationally acceleration of bandgap opening for x >0.12 are qualitatively in line with the large variation of EG and EF-EVB experimentally
observed by UV-visible spectrometry and XPS, respectively, when increasing x from 0.13 to 0.15 (Figure 3b and 3c). In addition, considering the Pb 5d orbitals of as a reference, DFT calculations also confirm that the valence band energy is hardly affected in this range of composition, as the systematic downshift with increasing x value remains below 100meV.
Thus, despite the limitations of the here-presented computational model, in which the x value is monitored by considering an increasing number of infinite channels of defects starting from the experimental structure recorded on the single crystal (HEA)0.406(FA)0.698[Pb0.896I2.896] (H0.104), DFT results recover qualitatively both
experimental trends obtained on thin films. These experimental and computed results suggest different band diagrams for x ≤0.13 and x >0.13 that are schematically sketched in Figure 4d. It shows that the Fermi level is closer to the VB for the less-deficient (x ≤ 0.13) compositions, which is characteristic of a p-type semiconductor with positive charges as the majority charge carriers. On the contrary, for x = 0.15, the Fermi level is found closer
3 4 5 6 7 8 9 10 11 12 13 14 15 16 17 18 19 20 21 22 23 24 25 26 27 28 29 30 31 32 33 34 35 36 37 38 39 40 41 42 43 44 45 46 47 48 49 50 51 52 53 54 55
to the conduction band edge, indicative of a n-type semiconductor. Recently, G. Paul et al. inferred a correlation between electronic conductivity from p-type to n-type with PbI2
-deficient and PbI2 rich precursors both for MAPI and FAPI.32 Unfortunately, for the
d-FAPI investigated in our work, any attempt to correlate composition to stoichiometry of precursors failed and the overall trend is found in the opposite direction as the films with x = 0.15 have been made using a stoichiometric ratio more PbI2-deficient than the one used
for x ≤ 0.13 (Table S10). This suggests that other factors can influence the semiconductor doping type and level. Amongst others, it has been shown that thermal annealing can convert an initially p-type halide perovskite to n-type.33
3 4 5 6 7 8 9 10 11 12 13 14 15 16 17 18 19 20 21 22 23 24 25 26 27 28 29 30 31 32 33 34 35 36 37 38 39 40 41 42 43 44 45 46 47 48 49 50 51 52 53 54
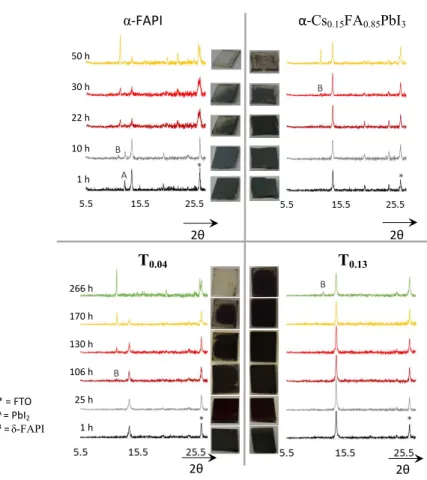
* = FTO A = PbI2 B =δ-FAPI 266 h 170 h 130 h 106 h 25 h 1 h T0.04 T0.13 2θ 2θ 2θ 2θ 50 h 30 h 22 h 10 h 1 h B A α-FAPI α-Cs0.15FA0.85PbI3 B B B * * * *
Figure 5. Stability test (ambient conditions: 25 °C, 75-90% humidity) of FAPI,
α-Cs0.15FA0.85PbI3, T0.04, T0.13 thin films. The XRD patterns and the pictures were realized in
the 1-50 hours range and 1-266 hours range for α-FAPI, α-Cs0.15FA0.85PbI3 and T0.04, T0.13,
respectively.
The α-phase air stability of H0.13, H0.15, T0.04 and T0.13 thin films has been compared to both
α-FAPI and α-Cs0.15FA0.85PbI3 samples. This mixed cation α-FAPI type perovskite has
been selected as a reference material due to its higher α-phase stability and performances in solar cells.11,34,35 The corresponding thin films were prepared by spin-coating with a final
annealing step at 125 °C for α-Cs0.15FA0.85PbI3, H0.13, H0.15, T0.04, T0.13, and at 155°C for
α-FAPI (more details in S.I. -X-). All these films were aged under ambient conditions (25
3 4 5 6 7 8 9 10 11 12 13 14 15 16 17 18 19 20 21 22 23 24 25 26 27 28 29 30 31 32 33 34 35 36 37 38 39 40 41 42 43 44 45 46 47 48 49 50 51 52 53 54 55
°C, air with 75-90% humidity, ambient sunlight), without encapsulation and their aspect and structural changes upon aging were followed (Figure 5 and Figures S26, S27). After 1 hour, only the XRD pattern of α-FAPI thin film presented the typical peak of PbI2 (12.8°
2θ), a compound which is in fact generated during the annealing step at 155°C. After 10 hours, the typical line of δ-FAPI at 11.7° 2θ appeared in the XRD pattern of α-FAPI, then the to-δ phase transformation was completed after around 50 hours of aging. α-Cs0.15FA0.85PbI3thinfilm owns a higher phase stability under ambient conditions than
α-FAPI since the α-to-δ transformation starts after 30 hours and is completed between 50 and 106 hours of aging (S.I. Figure S27). The H0.13 and H0.15 thin films exhibited a similar
stability to the α-FAPI one (total transformation into δ-FAPI between 22 and 50 hours of aging, Figure S26). Importantly, the T0.04 and T0.13 thin films were significantly more
stable. Indeed, the first sign of δ-phase formation occurred after 106 hours and 266 hours for T0.04 and T0.13, respectively. This means that under ambient conditions, T0.13 thin films
are approximately twenty times more stable than FAPI and ten times more stable than α-Cs0.15FA0.85PbI3. This exceptional α-phase stability is presumably the consequence of the
presence of the TEA+ cation inside the 3D perovskite network. Interestingly, taking into
account that HEA+ and TEA+ cations own the same alkyl chain, and that their size and
amounts of incorporation are similar, such a higher stability of T0.13 compared to H0.13,is
due to added benefit thanks to the thiol function as compared to the alcohol one. The thiol function is less hydrophilic and may make stronger interactions with the inorganic network, thus allowing a better stabilisation of the α-phase in air condition. This hypothesis of stronger interactions with the inorganic network is reinforced by the solid NMR data,
3 4 5 6 7 8 9 10 11 12 13 14 15 16 17 18 19 20 21 22 23 24 25 26 27 28 29 30 31 32 33 34 35 36 37 38 39 40 41 42 43 44 45 46 47 48 49 50 51 52 53 54
which evidenced that TEA+ presents much less rotational mobility as compared to the two
other organic cations considered in this work (FA+, HEA+).
CONCLUSION
In summary, we have shown that both HEA+ and TEA+ large cations (effective radius of
3.44 Å and 4.14 Å, respectively) can be incorporated into a 3D [Pb1-xI3-x] α-FAPI type
perovskite network, showing that it is possible to circumvent the geometrical Goldschmidt factor. The resulting phases d-α-FAPI-Hx and d-α-FAPI-Tx can be obtained by an easy
precipitation method at room temperature, while the well-known α-FAPI parent phase can only be obtained above 150 °C. Incorporation of such larger size cations, particulary the thiol-cation TEA+, leads to thin films demonstrating exceptional α-phase stability under
ambient conditions, surpassing the one of α-FAPI and α-Cs0.15FA0.85PbI3 by more than an
order of magnitude.The higher α-phase stability of d-α-FAPI-Tx materials compared to
d-α-FAPI-Hx ones, points out the positive impact of the thiol function compared to alcohol
function. This certainly originates from the less hydrophilic nature of –SH compared to – OH, and it may also indicate greater abilities of the thiol function to make quite strong interactions with the inorganic perovskite network, which leads to a slower motion of the TEA+ cations as evidenced by solid-state NMR. Besides, computational investigations
correlated with experimental observations reveal the progressive opening of the direct band gap and increase of the effective masses when x increase from 0 to 0.13. For greater values of x, those trends remain but the evolution dramatically accelerates. Moreover, UV-visible, XPS and computational results suggest that d-α-FAPI compounds turn from p-type to n-type semiconductors for x values above 0.15. These observations prove that it is possible
3 4 5 6 7 8 9 10 11 12 13 14 15 16 17 18 19 20 21 22 23 24 25 26 27 28 29 30 31 32 33 34 35 36 37 38 39 40 41 42 43 44 45 46 47 48 49 50 51 52 53 54 55
to accurately tune the electronic properties of this d-α-FAPI phases lead and iodide deficient hybrid perovskite family (d-HP) by controlling x. Thus, d-α-FAPI materials appears as serious MA+ and Br--free candidates as an alternative to the widespread alloys
(Cs,MA,FA)Pb(I,Br)3 for single junction but also tandem PSCs, which recently achieved
certifief power conversion efficiencies of 28.0%.3 We believed that these results pave a
path to the discovery of new perovskite materials for energy applications thanks to the greater versatility of defective sites.
ASSOCIATED CONTENT Supporting Information
The Supporting Information is available free of charge on the ACS Publications website
AUTHOR INFORMATIONS Corresponding Authors
nicolas.mercier@univ-angers.fr ; claudine.katan@univ-rennes1.fr
ACKNOWLEDGEMENTS
We thank Romain Mallet and the SCIAM service for the EDX-MEB measurements, Valérie Bonin and Cécile Mézière for the elemental analyses of CHNS and O, and the company Crealins for the accurate microanalysis of lead. M.K. and C.K. acknowledge support from Agence Nationale pour la Recherche (TRANSHYPERO project). Computational investigations were conducted thanks to HPC resources provided by [TGCC/CINES/IDRIS] under the allocation 2018-A0010907682 made by GENCI.
3 4 5 6 7 8 9 10 11 12 13 14 15 16 17 18 19 20 21 22 23 24 25 26 27 28 29 30 31 32 33 34 35 36 37 38 39 40 41 42 43 44 45 46 47 48 49 50 51 52 53 54
REFERENCES
(1) Brenner, T. M.; Egger, D. A.; Kronik, L.; Hodes, G.; Cahen, D. Hybrid Organic-Inorganic Perovskites: Low-Cost Semiconductors with Intriguing Charge-Transport Properties. Nature Reviews Materials. 2016, 1, 15007.
(2) Song, Z.; McElvany, C. L.; Phillips, A. B.; Celik, I.; Krantz, P. W.; Watthage, S. C.; Liyanage, G. K.; Apul, D.; Heben, M. J. A Technoeconomic Analysis of Perovskite Solar Module Manufacturing with Low-Cost Materials and Techniques. Energy Environ. Sci. 2017, 10, 1297-1305.
(3) National Renewable Energy Laboratory, N.R.E.L. Accessed 17 December 2018. https://www.nrel.gov/pv/assets/pdfs/pv-efficiency-chart.20181214.pdf.
(4) Lee, M. M.; Teuscher, J.; Miyasaka, T.; Murakami, T. N.; Snaith, H. J. Efficient Hybrid Solar Cells Based on Meso-Superstructured Organometal Halide Perovskites. Science. 2012, 338, 643-647.
(5) Kadro, J. M.; Pellet, N.; Giordano, F.; Ulianov, A.; Müntener, O.; Maier, J.; Grätzel, M.; Hagfeldt, A. Proof-of-Concept for Facile Perovskite Solar Cell Recycling. Energy
Environ. Sci. 2016, 9, 3172-3179.
(6) Kim, B. J.; Kim, D. H.; Kwon, S. L.; Park, S. Y.; Li, Z.; Zhu, K.; Jung, H. S. Selective Dissolution of Halide Perovskites as a Step Towards Recycling Solar Cells. Nature
Communications. 2016, 7, 11735.
(7) Aristidou, N.; Eames, C.; Islam, M. S. ; Haque, S. A. Insights into the Increased Degradation Rate of CH3NH3PbI3 Solar Cells in Combined Water and O2 Environments. J.Mater.Chem.A. 2017, 5, 25469-25475. 3 4 5 6 7 8 9 10 11 12 13 14 15 16 17 18 19 20 21 22 23 24 25 26 27 28 29 30 31 32 33 34 35 36 37 38 39 40 41 42 43 44 45 46 47 48 49 50 51 52 53 54 55
(8) Correa-Baena, J.-P.; Saliba, M.; Buonassisi, T.; Grätzel, M. ; Abate, A.; Tress, W.; Hagfeldt, A. Promises and Challenges of Perovskite Solar Cells. Science. 2017, 358, 739-744.
(9) Yang, W. S.; Noh, J. H.; Jeon, N. J.; Kim, Y. C.; Ryu, S.; Seo, J.; Seok, S. I. High-Performance Photovoltaic Perovskite Layers Fabricated through Intramolecular Exchange.
Science. 2015, 348 (6240), 1234-1237.
(10) Prathapani, S.; Choudhary, D.; Mallick, S.; Bhargava, P.; Yella, A. Experimental Evaluation of Room Temperature Crystallization and Phase Evolution of Hybrid Perovskite Materials. CrystEngComm. 2017, 19, 3834-3843.
(11) Li, Z.; Yang, M.; Park, J.-S.; Wei, S.-H.; Berry, J. J.; Zhu, K. Stabilizing Perovskite Structures by Tuning Tolerance Factor: Formation of Formamidinium and Cesium Lead Iodide Solid-State Alloys. Chem. Mater. 2016, 28, 284-292.
(12) Pellet, N.; Gao, P.; Gregori, G.; Yang, T.-Y. ; Nazeeruddin, M. K.; Maier, J.; Gratzel, M. Mixed-Organic-Cation Perovskite Photovoltaics for Enhanced Solar-Light Harvesting.
Angew. Chem. Int. Ed. 2014, 53, 3151-3157.
(13) Abdi-Jalebi, M.; Andaji-Garmaroudi, Z.; Cacovich, S.; Stavrakas, C.; Philippe, B.; Richter, J. M.; Alsari, M.; Booker, E. P.; Hutter, E. M.; Pearson, A. J.; Lilliu, S.; Savenije, T. J.; Rensmo, H.; Divitini, G.; Ducati, C.; Friend, R. H.; Stranks, S. D. Maximizing and Stabilizing Luminescence From Halide Perovskites with Potassium Passivation. Nature. 2018, 555, 497-501.
(14) Cao, J.; Wu, B.; Chen, R.; Wu, Y.; Hui, Y.; Mao, B.-W. ; Zheng, N. Efficient, Hysteresis-Free, and Stable Perovskite Solar Cells with ZnO as Electron-Transport Layer: Effect of Surface Passivation. Adv. Mater. 2018, 30, 1705596.
3 4 5 6 7 8 9 10 11 12 13 14 15 16 17 18 19 20 21 22 23 24 25 26 27 28 29 30 31 32 33 34 35 36 37 38 39 40 41 42 43 44 45 46 47 48 49 50 51 52 53 54
(15) Cho, K. T.; Grancini, G.; Lee, Y.; Oveisi, E.; Ryu, J.; Almora, O.; Tschumi, M.; Schouwink, P. A.; Seo, G.; Heo, S.; Park, J.; Jang, J.; Paek, S.; Garcia-Belmonte, G.; Nazeeruddin, M. K. Selective Growth of Layered Perovskites for Stable and Efficient Photovoltaics. Energy Environ. Sci. 2018, 11, 952-959.
(16) Zhao, Y.; Tan, H.; Yuan, H.; Yang, Z.; Fan, J. Z.; Kim, J.; Voznyy, O.; Gong, X.; Quan, L. N.; Tan, C. S.; Hofkens, J.; Yu, D.; Zhao, Q.; Sargent, E. H. Perovskite Seeding Growth of Formamidinium-Lead-Iodide-based Perovskites for Efficient and Stable Solar Cells. Nature Communication. 2018, 9, 1607.
(17) Gratzel, M. The Rise of Highly Efficient and Stable Perovskite Solar Cells. Acc. Chem.
Res. 2017, 50, 487-491.
(18) Saliba, M.; Matsui, T.; Domanski, K. ; Seo, J.-Y. ; Ummadisingu, A. ; Zakeeruddin, S. M.; Correa-Baena, J.-P.; Tress, W. R.; Abate, A.; Hagfeldt, A.; Grätzel, M. Incorporation of Rubidium Cations into Perovskite Solar Cells Improves Photovoltaic Performance.
Science. 2016, 354 (6309), 206-209.
(19) Saliba, M.; Matsui, T.; Seo, J.-Y. ; Domanski, K. ; Correa-Baena, J.-P.; Nazeeruddin, M. K.; Zakeeruddin, S. M.; Tress, W.; Abate, A.; Hagfeldt, A.; Gratzel, M. Cesium-ContainingTriple Cation Perovskite Solar Cells: Improved Stability, Reproducibility and High Efficiency. Energy Environ. Sci. 2016, 9, 1989-1997.
(20) Wang, P.; Ulfa, M.; Pauporté, T. Effects of Perovskite Monovalent Cation Composition on the High and Low Frequency Impedance Response of Efficient Solar Cells. J. Phys. Chem. C. 2018, 122, 1973-1981.
3 4 5 6 7 8 9 10 11 12 13 14 15 16 17 18 19 20 21 22 23 24 25 26 27 28 29 30 31 32 33 34 35 36 37 38 39 40 41 42 43 44 45 46 47 48 49 50 51 52 53 54 55
(21) Turren-Cruz, S.-H.; Hagfeldt, A.; Saliba, M. Methylammonium-Free, High-Performance and Stable Perovskite Solar Cells on a Planar Architecture. Science. 2018,
362 (6413), 449-453.
(22) (a) Leblanc, A.; Mercier, N. ; Allain, M. ; Dittmer, J. ; Fernandez, V. ; Pauporté, T. Lead- and Iodide-Deficient (CH3NH3)PbI3 (d-MAPI): The Bridge between 2D and 3D
Hybrid Perovskites. Angew. Chem. 2017, 129, 16283-16288. (b) Patent CRO BFF 17P0180, Project (1), 14th March 2017, Depositor SATT OUEST VALORISATION –
Client reference: DV3293.
(23) Tsai, C.-M.; Lin, Y.-P. ; Pola, M. K. ; Narra, S. ; Jokar, E. ; Yang, Y.-W. ; Diau, E. W.-G. Control of Crystal Structures and Optical Properties with Hybrid Formamidinium and 2‑Hydroxyethylammonium Cations for Mesoscopic Carbon-Electrode Tin-Based Perovskite Solar Cells. ACS Energy Lett. 2018, 3, 2077-2085.
(24) Spanopoulos, I.; Ke, W.; Stoumpos, C. C.; Schueller, E. C. ; Kontsevoi, O. Y. ; Seshadri, R. ; Kanatzidis, M. G. Unraveling the Chemical Nature of the 3D “Hollow” Hybrid Halide Perovskites. J. Am. Chem. Soc. 2018, 140, 17, 5728-5742.
(25) Kieslich, G.; Sun, S.; Cheetham, A. K. Solid-State Principles Applied to Organic-Inorganic Perovskites: New Tricks for an Old Dog. Chem. Sci. 2014, 5, 4712-4715.
(26) Weller, M. T.; Weber, O. J.; Frost, J. M.; Walsh, A. Cubic Perovskite Structure of Black Formamidinium Lead Iodide, α‑[HC(NH2)2]PbI3, at 298 K. J. Phys. Chem. Lett.
2015, 6, 3209-3212.
(27) Taylor, V. C. A.; Tiwari, D.; Duchi, M.; Donaldson, P. M.; Clark, I. P.; Fermin, D. J.; Oliver, T. A. A. Investigating the Role of the Organic Cation in Formamidinium Lead Iodide Perovskite Using Ultrafast Spectroscopy. J. Phys. Chem. Lett. 2018, 9, 895-901.
3 4 5 6 7 8 9 10 11 12 13 14 15 16 17 18 19 20 21 22 23 24 25 26 27 28 29 30 31 32 33 34 35 36 37 38 39 40 41 42 43 44 45 46 47 48 49 50 51 52 53 54
(28) Eperon, G. E.; Stranks, S. D.; Menelaou, C.; Johnston, M. B.; Herz, L. M.; Snaith, H. J. Formamidinium Lead Trihalide: a Broadly Tunable Perovskite for Efficient Planar Heterojunction Solar Cells. Energy Environ. Sci. 2014, 7, 982-988.
(29) Kohrt, C.; Spannenberg, A.; Werner, T. 2-Hydroxyethylammonium Iodide. Acta
Cryst. 2014, E70, o628. DOI : 10.1107/S1600536814009581.
(30) Even, J.; Pedesseau, L.; Katan, C. Proc. SPIE, 2014, 9140, 91400Y.
(31) Even, J.; Pedesseau, L.; Jancu, J.-M.; Katan, C. Importance of Spin-Orbit Coupling in Hybrid Organic/Inorganic Perovskites for Photovoltaic Applications. J. Phys. Chem. Lett. 2013, 4, 2999-3005.
(32) Paul, G.; Chatterjee, S.; Bhunia, H.; Pal, A. J. Self-Doping in Hybrid Halide Perovskites via Precursor Stoichiometry: To Probe the Type of Conductivity through Scanning Tunneling Spectroscopy. J. Phys. Chem. C. 2018, 122, 35, 20194-20199.
(33) Wang, Q.; Shao, Y.; Xie, H.; Lyu, L.; Liu, X.; Gao, Y.; Huang, J. Qualifying Composition Dependent p and n Self-Doping in CH3NH3PbI3. Applied Physics Letters.
2014, 105, 163508.
(34) Song, Z.; Wang, C.; Phillips, A. B.; Grice, C. R.; Zhao, D.; Yu, Y.; Chen, C.; Li, C.; Yin, X.; Ellingson, R. J.; Heben, M. J.; Yan, Y. Probing the Origins of Photodegradation in Organic–Inorganic Metal Halide Perovskites with Time-Resolved Mass Spectrometry.
Sustainable Energy Fuels. 2018, 2, 2460-2467.
(35) Lee, J.-W.; Kim, D.-H.; Kim, H.-S.; Seo, S.-W.; Cho, S. M.; Park, N.-G. Formamidinium and Cesium Hybridization for Photo- and Moisture-Stable Perovskite Solar Cell. Adv. Energy Mater. 2015, 5, 1501310.
3 4 5 6 7 8 9 10 11 12 13 14 15 16 17 18 19 20 21 22 23 24 25 26 27 28 29 30 31 32 33 34 35 36 37 38 39 40 41 42 43 44 45 46 47 48 49 50 51 52 53 54 55
(36) Mercier, N.; Poiroux, S.; Riou, A.; Batail, P. Unique Hydrogen Bonding Correlating with a Reduced Band Gap and Phase Transition in the Hybrid Perovskites (HO(CH2)2NH3)2PbX4 (X = I, Br). Inorganic Chemistry. 2004, 43, 26, 8361-8366.
(37) Soler, J. M.; Artacho, E.; Gale, J. D.; García, A.; Junquera, J.; Ordejón, P.; Sánchez-Portal, D. The SIESTA Method for ab initio Order-N Materials Simulation. J. Phys.:
Condens. Matter. 2002, 14, 2745-2779.
(38) Artacho, E.; Anglada, E.; Diéguez, O.; Gale, J. D.; García, A.; Junquera, J.; Martin, R. M.; Ordejón, P.; Pruneda, J. M.; Sánchez-Portal, D. ; Soler, J. M. The SIESTA Method; Developments and Applicability. J. Phys.: Condens. Matter. 2008, 20, 064208.
(39) Zhang, Y.; Yang, W. Generalized Gradient Approximation Made Simple. Phys. Rev.
Lett. 1998, 80, 890.
(40) Troullier, N.; Martins, J. L. Efficient Pseudopotentials for Plane-Wave Calculations.
Phys. Rev. B. 1991, 43, 1993-2006.
(41) Artacho, E.; Sánchez-Portal, D.; Ordejón, P.; García, A.; Soler, J. M. Linear-Scaling ab-initio Calculations for Large and Complex Systems. Phys. Stat. Sol. (b) 1999, 215, 809-817.
(42) Fernández-Seivane, L.; Oliveira, M. A.; Sanvito, S.; Ferrer, J. On-Site Approximation for Spin-Orbit Coupling in Linear Combination of Atomic Orbitals Density Functional Methods. J. Phys.: Condens. Matter. 2006, 18, 7999-8013.
3 4 5 6 7 8 9 10 11 12 13 14 15 16 17 18 19 20 21 22 23 24 25 26 27 28 29 30 31 32 33 34 35 36 37 38 39 40 41 42 43 44 45 46 47 48 49 50 51 52 53 54
Table of contents 3 4 5 6 7 8 9 10 11 12 13 14 15 16 17 18 19 20 21 22 23 24 25 26 27 28 29 30 31 32 33 34 35 36 37 38 39 40 41 42 43 44 45 46 47 48 49 50 51 52 53 54 55