Universite de Sherbrooke
^^
"\ ^31156008108881
LA RELATION ENTRE L'ALLOCATION AUX COMPOSES SECONDAIRES ET LE
TAUX DE CROISSANCE RELATIF CHEZ LES ASTERACEAE
Pl.Uj,^ \^^'l
/••'i.n / i'/ • ^.
par
Jarcilene Silva de Almeida-Cortez
these presentee au Departement de Biologie en vue de 1'obtention du grade de docteur es sciences (Ph.D.)
FACULTE DES SCIENCES
UNIVERSITE DE SHERBROOKE
1*1
National Library of Canada Acquisitions and Bibliographic Services 395 Wellington Street Ottawa ON K1AON4 Canada Bibliotheque nationale du Canada Acquisitions et services bibliographiques 395, rue Wellington Ottawa ON K1AON4 CanadaYour file Volre reference Our file Notre rel6rence
The author has granted a
non-exclusive licence allowing the
National Library of Canada to
reproduce, loan, distribute or sell
copies of this thesis m microform,
paper or electronic formats.
The author retains ownership of the
copyright ia this thesis. Neither the
thesis nor substantial extracts from it
may be printed or otherwise
reproduced without the author's
permission.
L'auteur a accorde une licence non
exclusive permettaat a la
Bibliotheque nationale du Canada de
reproduire, prefer, distribuer ou
vendre des copies de cette these sous
la forme de microfiche/fihn, de
reproduction sur papier ou sur fonnat
electronique.
L'auteur conserve la propriete du
droit d'auteur qui protege cette these.
Ni la these ni des extraits substantiels
de celle-ci ne doivent etre imprimes
ou autrement reproduits sans son
autonsation.
Le //^ ^<^?>^OL^a—1997, Ie j
jury suivant a accepte cette these dans sa version finale.President-rapporteur: M. Jean-Marie Bergeron
Departement de biologie
Membre: Membre: Membre externe:M. Bill Shipley
Departement de biologie
M. Thor Arnason Universite d'Ottawa M. Yves MauffetteUQAM
I \A ^nT Ttri^LS^—
RESUME
L'influence de la disponibilite en elements nutritifs et de 1'intensite lumineuse sur 1'investissement relatif de la feuille en composes secondaires a ete mis en evidence chez certaines esp^ces. Cependant, les etudes interspecifiques pertinentes sont rares et donnent des resultats contradictoires. La presente etude met 1'accent sur Ie compromis existant entre la croissance et la production de composes secondaires, pour des plantes cultiv6es dans
differentes conditions de disponibilite de ressources. Plusieurs hypotheses ont ete testees: 1)
il existe, chez les Asteracees cultivees dans des conditions optimales de luminosite et de nutrition minerale, une correlation negative entre Ie taux de croissance relatif des especes et leur production de composes secondaires; 2) chez des plantes cultivees dans des conditions suboptimales, il existe une correlation negative entre les composes secondaires mobiles (test de toxicite des larves d'Artemia) et les composes secondaires immobiles (composes
phenoliques); 3) les plantes cultivees en conditions optimales de nutntion mais sous faible
intensite lumineuse produisent moins de composes secondaires carboniques que dans des
conditions de stress nutntif et de luminosite optimale; et 4) les plantes cultivees dans des
conditions optimales ont un taux de croissance eleve mais produisent moins de composes secondaires que dans des conditions de stress lumineux et nutntif. Pour tester la premiere hypothese, 31 especes d'Asteracees ont ete cultivees dans un environnement controle, dans
des conditions optimales de lumiere et de nutrition (solution hydroponique). Vingt especes
d'Asteracees, cultivees en conditions de stress nutntif mais sous une intensite lumineuse elevee, ont ete utilisees pour tester la seconde hypofhese, i.e. 1'existence d'une correlation entre Ie taux de croissance relatif des especes et leur production en composes secondaires,
ainsi qu'entre les deux types de defense chimique (mobile et immobile). Afin de tester les
hypotheses trois et quatre, une experience a ete realisee avec six especes d'Asteracees cultivees selon 11 differentes combinaisons de disponibilite en lumiere et en mineraux nutritifs. De plus, deux de ces six especes (Chrysanthemum leucanthemum et Rudbeckia hirta) ont ete utilisees afin de tester 1'existence de differences dans la quantity de composes
secondaires specifiques produite (mesuree par HPLC) entre deux niveaux de disponibilite des
ressources sous haute intensite lumineuse. Cette these a mis en evidence Ie fait que la disponibilite des ressources affecte la croissance et la production de composes secondaires de differentes manieres chez quelques especes d'Asteracees. Cependant, les donnees de cette these ne montrent aucun compromis entre la croissance et les defenses chimiques quand on compare les differentes especes a 1'interieur d'une meme experience. La croissance relative et la surface specifique des feuilles voient leur valeur moyenne diminuer dans des conditions de stress nutritif. Au contraire, Ie rapport racine:feuille est augmente dans ces memes conditions. Comme on pouvait 1'esperer, Ie pourcentage d'azote foliaire est reduit dans des conditions de stress nutntif. Les choses se compliquent en ce qui conceme les parametres utilises pour caracteriser la defense chimique quand Ie contenu total en composes phenoliques augmente, la valeur moyenne de la toxicite diminue. Par ailleurs, aucun polyacetylene ni sesquiterpene lactone n'a ete mis en evidence par HPLC dans les feuilles des deux especes etudiees. Enfin,
la quantite de pentaynene produite dans les fleurs de Rudbeckia hirta diminue
significativement avec 1'age mais augmente significativement quand la plante est soumise a
ABSTRACT
Differences in resource availability have been shown to generate variation in defense chemistry in some species, but proper interspecific studies are rare and give conflicting results. This study focused on the trade-off between growth and production of chemical compounds of plants grown under different resource availabilities. I tested the hypothesis that: 1) contrasting plant species grown under controlled and enriched environmental conditions will show a negative correlation between their relative growth rates and their secondary compounds; 2) there is a negative correlation between mobile defenses (measured
by the toxicity bioassay) and immobile defenses (measured by total phenol concentration) of
plants grown under suboptimal environmental conditions; 3) plants grown under
light-stressed conditions but optimal nutrient conditions will produce less carbon-based secondary
compounds than plants grown under nutrient-stressed conditions but optimal light conditions;
and 4) plants grown under optimal environmental conditions will have a high RGR but will
produce less secondary compounds than plants grown under stressful environmental conditions. Hypothesis 1 was tested experimentally using 31 species ofAsteraceae grown
with high levels of mineral and light resource availability under controlled conditions.
Hypothesis 2 was tested in 20 species ofAsteraceae by examining if there is any correlation
between relative growth rate and secondary metabolism, and if there is any correlation
between the type of chemical defense (mobile and immobile) in plants grown under
controlled conditions of high light intensity but suboptimal levels of mineral nutrients. To
test hypotheses 3 and 4, I conducted an experiment using six species of Asteraceae grown
under 11 different combinations of light and mineral resources availabilities. Also, I
investigated if there was any difference concerning the amount of specific secondary
compounds, measured with HPLC produced by high light intensity and two levels of mineral
resources availabilities in two of the six species (Chrysanthemum leucanthemum and
Rudbeckia hirta). This thesis provided evidence that the resources availabilities affect the
growth and the chemical parameters in different ways, but the data of this thesis shows no
trade-off between growth and chemical defense when comparing species within a given experiment. The relative growth rate and the specific leaf area are affected by reducing the mean values under nutrient stress. In contrast, the rootshoot ratio increased under such conditions. As expected, leaf nitrogen content was reduced under nitrogen stress. The complication occurs in the parameters related to chemical defense; while total phenolics content increased, toxicity decreased. Finally, I did not detect the presence of any polyacetylenes or sesquiterpene lactones by HPLC in the leaves of the two species tested. The amount of pentaynene produced in the flowers of Rudbeckia hirta decreased
significantly with age but increased significantly when the plant was subjected to a reduced
nutrient availability.
ACKNOWLEDGMENTS
I am deeply indebted to many people for helping to make this thesis possible. First
and foremost, I am grateful to my supervisor, Professor Bill Shipley for providing inspiration
and guidance through all stages of the project, and trying to teach me how to think like a
lawyer. Dr. Shipley took a chance by accepting me as a student and for that I will always be grateful. I would also like to thank the other members of my supervisory committee, Dr. Colette Ansseau and Dr. Jean-Mane Bergeron for their continual support and encouragement. I am grateful to Dr. Yves Mauffette for accepting on being the external member of the doctoral thesis defense. I am equally indebted to Dr. Thor Amason who even not being officially my co-supendsor, participated actively of all stages of the project. Dr. Amason
provided me with the opportunity to work at his lab of phytochemistry at the University of
Ottawa.
There is no question that this project would not have been possible without the
growth chambers of Phytotron of the McGill University. I am deeply indebted to the
administration for allowing me to make use of their facilities. In addition, I would like to
thank the Phytotron personnel for their friendship and support. In particular I would like to
thank Mark Romer and Claire Cooney.
I am equally indebted to the graduate students and technicians who enriched the time
I spent at Universite de Sherbrooke. Most noteworthy are Sana Chakir and Remi Duhamel. Several summer students assisted in the processing and analysis of samples. I would
like to thank Patrice Lavoie and Nancy Faucher for their patient helping the analyses of leaf
area, especially in the particular species, Bidens frondosa. I am grateful to Daniel Ouellete
without his help the chapter III would not have been possible. Nafhalie Pitre, I really
appreciate her help with the chemical analyses. In addition, I would like to thank Darlene
Wong for her help during the time of harvesting the plants.
I appreciate being welcomed into the weekly lab meeting of Dr. Martin Lechowicz,
which provided me with intellectual support, useful discussion, and feedback throughout my
years in Montreal. In addition, I would like to thank his graduate students and post-doc for
their friendship and scientific support during the time I spent at McGill University. In
particular I would like to thank Fabiola Reygadas and Zhang Ming Wang.
I am equally indebted to Dr. Amason's graduate students and post-docs at the
University of Ottawa. In particular I would like to thank Gabriel Guillet, Sam Omar, and
Patrick Yat for their help with HPLC.
I would like to thank the almost nine thousand plants whose lives had to be sacrificed
in order to make this project possible.
Personal thanks and appreciation are sent to my parents and sisters whose love and support have always been appreciated.
Last, but certainly not least, I wish to especially thank my husband Pedro, who stuck
with me through all the ups and downs and for his continual support.
Financial support for this project came from Natiral Sciences and Engineering
TABLE OF CONTENTS
Page
RESUME...ii ABSTRACT...ii ACKNOWLEDGMENTS...vi TABLE OF CONTENTS...viii LIST OF TABLES...xiii LIST OF FIGURES...xv LIST OF APPENDICES...xxiCONTRIBUTION TO ORIGINAL KNOWLEDGE...xxiii
GENERAL INTRODUCTION...! OB JECTWES...3
HYPOTHESES...^ CHAPTER I LITERATURE REVIEW...5
1.1 Plant metabolism...5
1.1.a Primary metabolism...6
1.1.b Secondary metabolism...6
l.l.c Types of plant secondary compounds ...7
1.2 Taxonomic effects and secondary compounds... ...12
1.3 Asteraceae Family...12
1.S.aTaxonomic aspects...12
1.3.b Chemical aspects... 13
1.4 What is RGR and how is it measured? ...18
1.5 The Dilemma of Plants: Growth and Defense... ...20
1.6 Plant-herbivore defense theories... ...26
1.6.1 Apparency Theory...26
1.6.2 Optimal Defense Hypothesis (OD)...29
1.6.4 The Carbon/Nutdent Balance Hypothesis (CNB)...32
1.6.5 Growth-differentiation balance (GDB)...34
1.7 Different theories in relation to my experiment...36
1.8 Relation between evidence and theories...37
CHAPTER II Interspecific comparations of plant toxicity and production ofphenolics
in relation to plant growth rate under optimal conditions of light and
mineral nutrients...412.1 Introduction...^! 2.2 Materials and Methods...43
2.2.1 The species...43
2.2.2 Seed collection and storage...43
2.2.3 Germination conditions...43
2.2.4 Growth of the seedlings...45
2.2.5 Hydroponic system...46
2.2.6 Plant harvests...48
2.2.7 Measurements of plants...48
2.2.8 Chemical analyses...49
2.2.8.1 Extraction and Bioassay of Plant Chemical Toxicity...49
2.2.8.2 Tissue preparation for nitrogen and phenolic measures...51
2.2.8.3. Total phenolics analyses... ...52
2.2.8.4. Nitrogen analyses...53
2.2.9 Growth analyses...54
2.2.10 Statistical analyses...55
2.3 Results...57
2.3.1. General observations...57
2.3.1.1. Seedling establisbnent and plant growth...57
2.3.1.2. Growth conditions...58
2.3.2. Means and variances of measured variables: growth and chemical parameters...58
2.3.3. Variation of total phenolics and toxicity in relation to taxonomic
or ecological classifications and tissue type...59
2.3.4. Relationships between total phenolics, toxicity and growth...60
2.4 Discussion...69
CHAPTER III Interspecific comparisons of plant toxicity and production ofphenolics
in relation to plant growth rate under conditions of nutrient stress...813.1 Introduction...81
3.2 Materials and Methods...83
3.2.1 Seed collection and storage...83
3.2.2 Germination conditions...83
3.2.3 Growth of the seedlings...84
3.2.4 Nutrient delivery system...85
3.2.5 Nutrient solution...85
3.2.6 Plant harvests...86
3.3 Results...87
3.3.1 Growth conditions...87
3.3.2 Means and variances of measured variables and comparisons with non-limiting nutrients...87
3.3.3 Relationship between total phenolics, toxicity, tissue nitrogen and growth...92
3.4 Discussion...100
3.4.1 Growth responses to nutrient availability...101
3.4.2 Chemical parameters and nutrient availability... 103
3.4.3 Is there a trade-off between relative growth rate and chemical defense?...107
CHAPTER IV Differential responses of growth and chemical defenses of six species
ofAsteraceae in relation to resource availability...115
4.1 Introduction...115
4.2 Materials and Methods...117
4.2.1 The species...117
4.2.2 Experimental design... ...117
4.2.3 StastiStic-al analy.s&s...119
4.3 Results ^.^ ....„....„....„„..„...„...„...„...120
4.3.1 General observations...120
4.3.2 Variation in the growth parameters...120
4.3.3 Effects of experimental manipulations on growth parameters and chemical parameters...124
4.3.4 Comparisons between measured variables...130
4.3.4.1 Correlations without controlling for the different environments...133
4.3.4.2 Correlations after controlling for the different environments...135
4.4 Discussion...146
4.4.1 Is there any trade-off between measured variables?...148
CHAPTER V Effects of nutrient availability on the production of secondary
compounds related to defense in Rudbeckia hirta and Chrysanthemum leucanthemum, as revealed by HPLC. ...1645.1 Introduction...164
5.2 Materials and Methods...166
5.2.1 Experimental design... 166
5.2.2 Phytochemical analysis...166
5.2.3 Statistical analysis...167
5.4 Discussion...171
CHAPTER VI GENERAL DISCUSSION...175
6.1 What would be an ideal experiment to test these hypotheses?...175
6.2 Plant-herbivore defense theories in relation to the findings of this thesis...178
6.2.1 Optimal Defense Hypothesis (OD)...178
6.2.2 Resource Availability Theory...179
6.2.3 The Carbon/Nutrient Balance Hypothesis (CNB)...180
6.2.4 Growfh-Differentiation Balance (GDB)...181
CHAPTER VII SUMMARY AND GENERAL CONCLUSIONS ...186
APPENDICES...190
LIST OF TABLES
Table 1 Mean costs of construction of leaves and of various secondary compounds
(after Gulmon & Moony, 1986).Copy from Baas 1989...21
Table 2 Average substrate and cofactor costs for terpenoids and various other classes of plant primary and secondary metabolites (Gershenzon, 1994)...22
Table 3 Growth habitats, type of growth and defense-type ofunapparent and of
apparent plants (based on Gershenzon 1984)...28
Table 4 Characteristics of inherently fast-growing and slow-growing plant species
(Coley^a/, 1985)...30
Table 5 List of species used in this study and their taxonomic affiliations...44 Table 6 Composition and concentration of modified Hoagland solution...47
Table 7 Relative growth rate (RGR), means of measurable toxicity (LC5o; (^g/ml)
in the brine sb-imp test and means of total soluble phenolics (% phenols GAE
(g/g)) by harvest day (14, 21, 28 and 35 post-germination) of 31 species of
Asteraceae grown under controlled conditions of temperature (25 °C), RH
(80%), light intensity (500 Hmol/m2/s PAR) and photoperiod (16 h/day) in a
full-strengfh Hoagland hydroponic solution...61
Table 8 Composition and concentration of modified Hoagland solution...85
Table 9 Relative growth rate (RGR- g/g/day), measurable toxicity (l/I^o; Hg/ml) m
brine shrimp test and total soluble phenolics (% phenols GAE (g/g)) of 20
species ofAsteraceae under controlled conditions of temperature (25 °C),
in hydroponic solution (1/8 dilute)...89
Table 10 The means of relative growth rate (RGR), the means of specific leaf area (SLA),
the means of root: shoot ratio, the means of leaf nitrogen content, the means of
measurable toxicity (LC5o; ^ig/ml) in the brine shrimp test and means of total
soluble phenolics (% phenols GAE (g/g)) of 19 species ofAsteraceae. Plants
grown under non-limiting nutrient conditions and a light intensity of 500
j^imoVm /s PAR versus plants grown under nutrient stress conditions (1/8
dilution) and a light intensity of 450 ^imol/m /s PAR. Both experiments run
under controlled conditions of temperature (25 °C), RH (80%), and
photoperiod (16 h/day). ...93
Table 11 Means of growth, dry matter partitioning, and chemical characteristics in six
species ofAsteraceae grown under 500, 250 and 125 pmoVm /s PAR with
three different nutrient supply (fall-strength, 1/5 and 1/10 dilution of
full-strengfh Hoagland solution). Means by species (a); by light treatment (b);
by nutrient treatment (c). Means followed by the same letters are not
significantly different (HSD, 0.05 level)...136
Table 12 Means of growth, dry matter partitioning, and chemical characteristics in six
species ofAsteraceae grown under 250 and 125 ^mol/m2/s PAR with four
different nutrient supply (full-strength, 1/5, 1/10 and 1/50 dilution of full-strength
Hoagland solution). Means by species (a); by light treatment (b); by nutrient
treatment (c). Means followed by the same letters are not significantly
LIST OF FIGURES
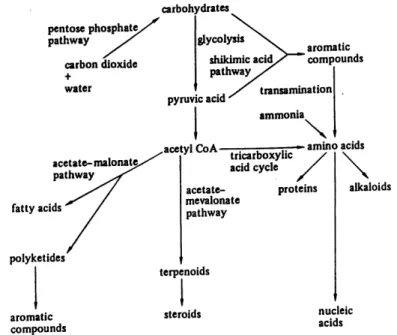
Figure 1 Biosynfhetic pathways in plants (copy from Vickery and Vickery, 1981). ...5
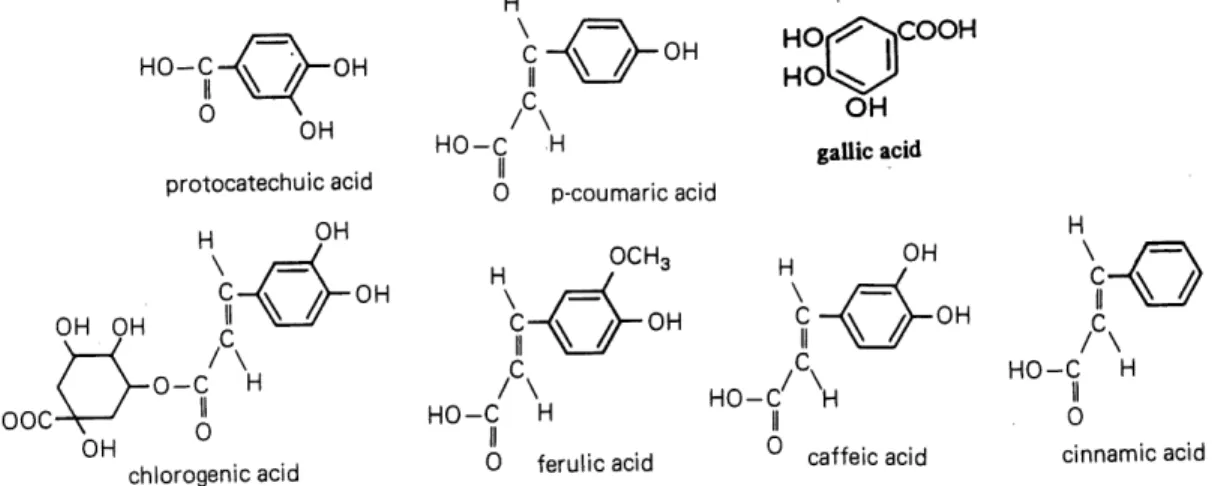
Figure 2 Structures ofphenolic acids often found in plants...8
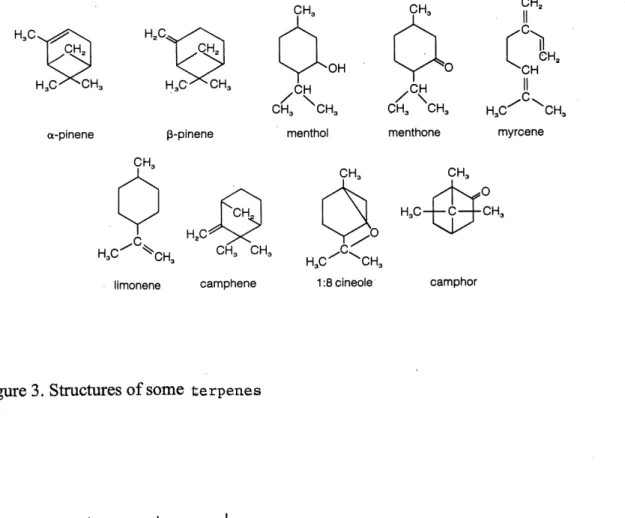
FigureS Structures of some fcerpenes... ...10
Figure 4 Structure offamesyl pyrophosphate. ...10
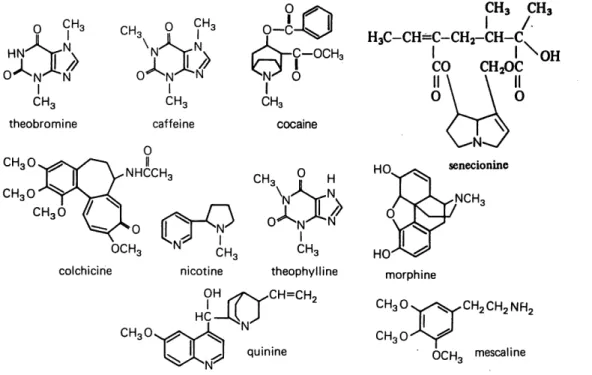
Figure 5 Stmctures of some representative alkaloids...11
Figure 6 A few of the many sesquiterpene lactones known to exhibit various types of
biological activities (copy from Mabry and Gill, 1979)...12Figure 7 Structures of some polyacetylene compounds...17
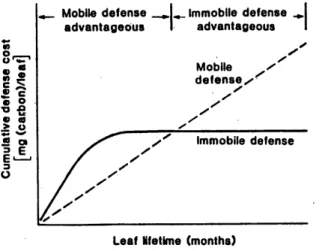
Figure 8 The cost of defending a leaf according to the mobile or immobile defenses
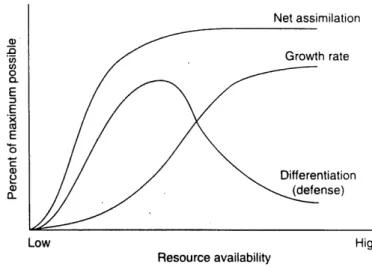
(Coley era/., 1985)...31Figure 9 The relationships among resource availability, assimilation, growth and differentiation (copy from Herms and Mattson, 1992)...35
Figure 10 Relationship between means ofRGR (g/g/day) and means of total soluble
phenolics (% phenols GAE (g/g)) for 31 species ofAsteraceae grown under
controlled conditions oftemperatore (25 °C), RH (80%), light intensity (500
^mol/m/s PAR) and photoperiod (16 h/day) in a full-strengfh Hoagland
hydroponic solution ...66Figure 11 Relationship between means ofRGR (g/g/day) and means of leaf soluble
phenolics (% phenols GAE (g/g)) for 31 species ofAsteraceae grown under
controlled conditions of temperature (25 °C), RH (80%), light intensity (500
Umol/m /s PAR) and photoperiod (16 h/day) in full-strength Hoagland
hydroponic solution...67Figure 12 Relationship between means ofRGR (g/g/day) and means of leaf Nitrogen
content (%) for 31 species ofAsteraceae grown under controlled conditions
of temperature (25 °C), RH (80%), light intensity (500 (Amol/m2/s PAR) and
photoperiod (16 h/day) in fall-strength Hoagland hydroponic solution... ....68
Figure 13 Relationship between means ofRGR (g/g/day) of 19 species ofAsteraceae.
Plants grown under optimal nutrient condition (light intensity (500 {^mol/m /s
PAR) in fall-strength Hoagland hydroponic solution) versus plants grown
under nutrient stress conditions (light intensity (450 (^mol/m /s PAR) in
Hoagland hydroponic solution (1/8 dilute)). Both experiments ran under
controlled conditions of temperature (25 °C), RH (80%), and photoperiod
(16 h/day)...94
Figure 14 Relationship between means of SLA (cm2g-l) of 19 species ofAsteraceae.
Plants grown under optimal nutrient condition (light intensity (500
Hmol/m /s PAR) in full-strength Hoagland hydroponic solution) versus
plants grown under nutrient stress conditions (light intensity (450
^imol/m2/s PAR) in Hoagland hydroponic solution (1/8 dilute)).
Both experiments ran under controlled conditions of temperature (25 °C),
RH (80%), and photoperiod (16 h/day)...95
Figure 15 Relationship between means of root: shoot ratios (g/g) of 19 species of
Asteraceae. Plants grown under optimal nutrient condition (light intensity
(500 Hmol/m2/s PAR) in full-strengfh Hoagland hydroponic solution) versus
plants grown under nutrient stress conditions (light intensity (450 ^imol/m2/s
PAR) in Hoagland hydroponic solution (1/8 dilute)). Both experiments ran
under controlled conditions of temperature (25 °C), RH (80%), and
photoperiod (16 h/day). ...96
Figure 16 Relationship between means of leaf nitrogen content (%) of 19 species
ofAsteraceae. Plants grown under optimal nutrient condition (light
intensity (500 |nmol/m /s PAR) in full-strength Hoagland hydroponic
solution) versus plants grown under nutrient stress conditions[(light
intensity (450 ^imol/m /s PAR) in Hoagland hydroponic solution (1/8
dilute)]. Both experiments ran under controlled conditions of temperature
(25 °C),RH (80%), and photoperiod (16 h/day)...97
Figure 17 Relationship between means of total soluble phenolics (GAE - g/g) of 19
species ofAsteraceae. Plants grown under optimal nutrient condition (light
intensity (500 ^mol/m/s PAR) in full-strength Hoagland hydroponic
solution) versus plants grown under nutrient stress conditions [(light intensity
(450 (Amol/m /s PAR) in Hoagland hydroponic solution (1/8 dilute)].
Both experiments ran under controlled conditions of temperature (25 °C),
RH (80%), and photoperiod (16 h/day)...98
Figure 18 Relationship between means of measurable toxicity (l/LC5o; j-ig/ml) in brine
shrimp test for 19 species ofAsteraceae. Plants grown under optimal nutrient
condition (light intensity (500 j^mol/m /s PAR) in full-strength Hoagland
hydroponic solution) versus plants grown under nutrient stress conditions
(1/8 dilute)]. Both experiments ran under controlled conditions of
temperature (25 °C),RH (80%), and photoperiod (16 h/day)...99
Figure 19 Relationship between means ofRGR (g/g/day) and means of dry weight
(g) for 6 species ofAsteraceae, grown under controlled conditions of
temperature (25 °C), RH (80%), and photoperiod (16 h/day). a- Plants
grown under high (500 ^moVm /s PAR), moderate (250 ^moVm2/s PAR)
and low light (125 pmol/m2/s PAR) with three different nutrient supply
(full-strength Hoagland solution; 1/5 dilute and 1/10 dilute), b- Plants
grown under moderate (250 (imoVm2/s PAR) and low light (125 ^imoVm /s
PAR) with four different nutrient supply (full-strength Hoagland solution;
1/5 dilute; 1/10 dilute and 1/50 dilute). The negative correlation shown in
this figure is less obvious because all species and treatments are plotted
together...140
Figure 20 Relationship between means ofRGR (g/g/day) and means of SLA
(cm g) for 6 species ofAsteraceae, grown under controlled conditions
of temperature (25 °C), RH (80%), and photoperiod (16 h/day). a- Plants
grown under high (500 pnol/m2/s PAR), moderate (250 p-mol/m /s PAR)
and low light (125 pmol/m2/s PAR) with three different nutrient supply
(full-strengfh Hoagland solution; 1/5 dilute and 1/10 dilute), b- Plants
grown under moderate (250 ^mol/m^s PAR) and low light (125 (imoVm /s
PAR) with four different nutrient supply (full-strength Hoagland solution;
Figure 21 Relationship between means of RGR (g/g/day) and means of root: shoot
ratios (g/g) for 6 species ofAsteraceae, grown under controlled conditions
of temperature (25 °C), RH (80%), and photopenod (16 h/day). a- Plants
grown under high (500 ^mol/m2/s PAR), moderate (250 ^mol/m2/s PAR)
and low light (125 ^imol/m /s PAR) with three different nutrient supply
(full-strength Hoagland solution; 1/5 dilute and 1/10 dilute), b- Plants
grown under moderate (250 ^mol/m2/s PAR) and low light (125 nmol/m /s
PAR) with four different nutrient supply (full-strength Hoagland solution;
1/5 dilute; 1/10 dilute and 1/50 dilute)...142
Figure 22 Relationship between means of SLA (cm g) and root: shoot ratios (g/g) for
6 species ofAsteraceae, grown under controlled conditions of temperature
(25 °C), RH (80%), and photoperiod (16 h/day). a- Plants grown under high
(500 Hmol/m2/s PAR), moderate (250 Hmol/m2/s PAR) and low light (125
^mol/m2/s PAR) with tb-ee different nutrient supply (full-strengfh Hoagland
solution; 1/5 dilute and 1/10 dilute), b- Plants grown under moderate (250
(Amol/m2/s PAR) and low light (125 nmol/m2/s PAR) with four different
nutrient supply (fall-strength Hoagland solution; 1/5 dilute; 1/10 dilute
and 1/50 dilute)...143
Figure 23 Relationship between means of RGR (g/g/day) and means of Ln (total
soluble phenolics -GAE; g/g) for 6 species ofAsteraceae, grown under
controlled conditions of temperature (25 °C), RH (80%), and photoperiod
(16 h/day). a- Plants grown under high (500 ^imol/m /s PAR), moderate
(250 (Amol/m2/s PAR) and low light (125 ^mol/m2/s PAR) with three
different nutrient supply (full-strength Hoagland solution; 1/5 dilute and
1/10 dilute), b- Plants grown under moderate (250 (^mol/m /s PAR) and
low light (125 ^mol/m2/s PAR) with four different nutrient supply
(full-strength Hoagland solution; 1/5 dilute; 1/10 dilute and 1/50 dilute). ... 144
Figure 24 Relationship between means of SLA (cm g) and means ofLn (total
soluble phenolics -GAE; g/g) for 6 species ofAsteraceae, grown under
controlled conditions of temperature (25 °C), RH (80%), and photoperiod
(16 h/day). a- Plants grown under high (500 ^mol/m /s PAR), moderate
(250 ^mol/m2/s PAR) and low light (125 ^mol/m2/s PAR) with three
different nutrient supply (fall-strength Hoagland solution; 1/5 dilute
and 1/10 dilute), b- Plants grown under moderate (250 (Amol/m /s PAR)
and low light (125 ^mol/m2/s PAR) with four different nutrient supply
(full-strengfh Hoagland solution; 1/5 dilute; 1/10 dilute and 1/50 dilute). ...145
Figure 25 Chromatograms otRudbeckia hirta flowers after extraction with ETOH.
Peak identified as pentaynene (polyacetylene) ...169
Figure 26 Polyacetylene derivative (pentaynene) occurring in Rudbeckia hirta
(Asteraceae). ...170
Figure 27 Effect of nutrient availabity (fall-strenght and 1/5 dilution of Hoagland
solution) and flower age on pentaynene concentration... 170
Figure 28 The distribution of acetylenes within the whole family of the Asteraceae
LIST OF APPENDICES
Appendix 1 List of species gennination rates used in chapter II...190
Appendix 2 Nitrogen standard curve... 191
Appendix 3 Daily measurements ofpH and nitrate during the growth period from
February-March (chapter II). Full-strengfh solution. ... 192
Appendix 4 Primary data set of 31 species used in chapter II... ..208
Appendix 5 Data set of 31 species used in chapter II...251
Appendix 6 List of species germination rates used in chapter III...255
Appendix 7 Daily measurements ofpH and nitrate during the growth period from
July-August (chapter III)...256
Appendix 8a Primary data set of 20 species used in chapter III...257 Appendix 8b Primary data set of 20 species used in chapter III...266
Appendix 9 Daily measurements ofpH and nitrate during fhe growth period from
July-August (chapter IV). Light intensity: 500 |Limol/m /s...268
Appendix 10 Daily measurements ofpH and nitrate during the growth period from
July-August (chapter IV) Light intensity: 250 ^mol/m^s ...274
Appendix 11 Daily measurements ofpH and nitrate during the growth period from
July-August (chapter IV) Light intensity: 125 ^mol/m2/s ...276
Appendix 12 Data set of 6 species used in chapter IV. Light treatment: 500 (1),
250 (2), 125 (3) ^moVm2/s. Nutrient treatment: full-strength (1),
Arctium minus (2), Chrysanthemum leucanthemum (3), Cichorium
intybus (4), Matricaria matricarioides (5) and Rudbeckia hirta (6)... ..278
Appendix 13. Data set of 6 species used in chapter IV» Light treatment: 250 (2),
125 (3) (imol/m2/s. Nutrient treatment: fall-strength (1), 1/5 dilute
(2), 1/10 dilute (3) and 1/50 dilute (4). Species: Achillea millefolium
(l),Arctium minus (2), Chrysanthemum leucanthemum (3), Cichorium
CONTRIBUTION TO ORIGINAL KNOWLEDGE
1. The main contribution of this study is that it is the first to explore a wide set of species and
resources availabilities, in systematic and standardized conditions, from an ecological view point, investigating if there are tradeoffs between growth parameters and chemical defenses,
focusing on just the plants. This thesis contributes to a better understanding of the
controversial aspects involving tradeoffs between growth and defense in different resource environments.
2. This study is the first high resource-based study to examine chemical defenses (total
phenolics and toxicity) under controlled conditions in a large number of species of a single
family, versus the relative growth rate (chapter II).
3. Nutrient stress conditions can change the patterns of chemical defense. This is the first study that has focused on the maintenance of patterns under an environment in which nutrient levels have been reduced, for a large number of species (chapter III).
4. Using a subset of six species from the first chapter, under controlled conditions, I
investigated the possible correlations between RGR and secondary metabolism under
different combinations of light intensity and nutrient levels for 6 species of Asteraceae
(chapter IV). This is the largest number of species investigated under a full range of light and
nutrient conditions.
5. Differences in the amount of secondary metabolism produced by differing resource
availabilities have been little examined. This is the first investigation with Chysanthemum
leucanthemum and Rudbeckia hirta grown under controlled conditions with different
combinations of resource availability, analyzing by HPLC sesquiterpene lactones and
polyacetylenes (chapter V).
6. An original study of polyacetylenes from Rudbeckia hirta flowers (young and old)
harvested from plants grown under controlled conditions with high light and two different
nutrient availabilities was undertaken (chapter V).
GENERAL INTRODUCTION
Animal life on Earth depends on plants; without their capacity for converting carbon dioxide
and water to sugars, and nitrogen to amino acids, animals, including man, could not survive. Thus, it could be argued that green plants are the most important constituents of this planet.
Herbivory is one of the most powerful ecological interactions. Plants have been subjected to intense and recurrent natural selection to reduce herbivore impact upon them and to compensate for attacks when defenses have been breached. A major determinant of survival in plants is to avoid, or reduce, herbivory. Plant properties that have led to reduction of herbivore impact include a vast array ofchemicals that act as feeding deterrents or, less often, highly toxic poisons. Yet, such defensive adaptations require the same basic resources (carbon, mineral nutrients, and water) for their construction as required for growth.
Plants have evolved an enormous variety of physical and chemical properties, which are effective deterrents against herbivores. Every plant species has a suite of secondary
metabolites whose primary function is defense (Coley, 1987). Therefore, if defensive options
are both diverse and ubiquitous, why are some species better defended than are others? This
question has generated several theories that try to explain the biology of plant defense in
different ways (Feeny, 1976; Rhoades and Gates, 1976; Bryant et al., 1983; Coley et al.,
1985; Herms and Mattson, 1992).
According to Herms and Mattson (1992) the allocation of resources by plants to chemical and
structural defenses decreases growth by diverting resources from the production of leaf area and other vegetative structures. This trade-off has ecological consequences that affect the success or failure of particular resource partitioning and allocation patterns in particular
environments. Hence the dilemma of plants: They must grow fast enough to compete and
ultimately reproduce, and yet maintain the physiological adaptations (defenses) necessary for
survival in the presence ofherbivores and pathogens.
Some researchers (Mooney and Chu, 1974; Chung and Bames, 1980 a, b; Waring and
Pitman, 1985; Bazzaz et al., 1987; Chapin et al., 1990) observed that when environmental conditions are favorable, vegetative growth generally receives resource priority over secondary metabolism and storage. What is the relationship between growth and defense when environmental conditions are optimal or suboptimal to various degrees? This is the
basic question that motivates this thesis. Before describing the conflicting theories that have
been developed to predict such partitioning it is necessary to first clarify the difference
between primary and secondary metabolism, the effects of phylogeny on secondary metabolism, and how "growth" is measured.
OBJECTIVES
The spirit of this thesis was guided by a comparative approach to the study of plant chemical
defense. It tries to explore a wide set of species and resources availabilities, in systematic and
standardized conditions. I will try to provide enough data to understand the great diversity of
patterns that I believe exist.
This thesis explores four main questions:
First, is there any correlation between relative growth rate (fast and slow growing plants) and
chemical defense (total phenolics and toxicity) in 31 species ofAsteraceae under controlled
and enriched environmental conditions?
Second, if there is any correlation, is it maintained in an environment in which nutrient levels have been reduced?
Third, I will investigate if there is any correlation between RGR and secondary metabolism
under different combinations of light intensity conditions and different level of nutrient
conditions for 6 species ofAsteraceae.
The last objective is to investigate if there is any difference concerning the amount of
secondary metabolism produced by resource availability in Chrysanthemum leucanthemum and Rudbeckia hirta.
Are plants grown under suboptimal conditions as well defended as plants grown under
optimal conditions? And if so, is there any difference in the type of chemical defense
(phenolics vs. toxicity) in these environments? For example, do plants produce less
carbon-based defenses under suboptimal light conditions rather than under nutrient-limited
conditions?
HYPOTHESES
- There is a negative correlation between RGR of slow and fast-growing plants and their secondary compounds under controlled and enriched environmental conditions.
- There is a negative correlation between mobile defense (toxicity) and immobile defense (phenolics) (sensu Coley et al., 1985) under suboptimal environmental conditions.
- Plants grown under light-stressed conditions but optimal nutrient conditions produce less carbon-based secondary compounds than plants grown under nutrient-stressed conditions but
optimal light conditions.
- Plants under optimal environmental conditions have a high RGR but produce less secondary compounds than plants grown under stressful environmental conditions.
CHAPTER I
LITERATURE REVIEW
1.1 Plant metabolism
Historically, the processes of generating plant compounds have been separated into primary
and secondary metabolism. However, in the light of present-day knowledge, this distinction is arbitrary, as there is no sharp division between primary and secondary metabolites (Figure 1). Secondary metabolites are now known to be very necessary to plant life, many of them providing a defense mechanism against bacterial, viral, fungal and herbivore attack analogous to the immune system of animals. The detection of a compound depends on the sensitivity of the analytical procedure, and many compounds that now seem to be confined to a particular
plant will no doubt be found to be widespread as analytical techniques advance (Vickery and
Vickeiy, 1981).
pentose phosphatc, pathway carbon dioxide + water acctatc-malonat^. pathway fatty acids polykctides aromatic compounds carbohydrates glycolysis shikimic acid, pathway transamination] ammonia aromatic compoundsacetyl CoA tricarboxylic acid cycle amino acids acctatc-mevalonatc pathway proteins tcrpenoids alkaloids steroids nuclcic acids
1.1.a Primary metabolism
Primary metabolism can be defined as all processes that are responsible for plant growth, like
photosynfhesis and respiration. Growth consists of cell division followed by cell
enlargement, and leads to an irreversible change in plant size.
l.l.b Secondary metabolism
Vascular plants contain an enormous variety of chemical compounds, distinct from the intermediates and products of primary metabolism, which vary according to family and species. The restricted distribution of many such compounds enables them to be used as taxonomic markers, and the so-called "secondary metabolites" make a major contribution to the specific odors, tastes and colors of plants. According to Bennett and Wallsgrove (1994) in the past such secondary metabolites have been viewed as waste products resulting from " mistakes" of primary metabolism, and therefore of little importance to plant metabolism and growth. It is now known that such a view is misguided, and that many secondary products are key components of active and potent defense mechanisms - part of the age-long "chemical warfare" fought between plants and their pests and pathogens.
Secondary metabolites have a great variety of roles, in addition to pest and pathogen defense
(Seigler and Price, 1976; Seigler, 1977). For instance these compounds may be involved in
carbon and/or nutrient storage (Selmar et aL, 1988; Harbome, 1990), protection from UV
radiation (Rhoades, 1977; Lee and Lowry, 1980), drought resistance (Rhoades, 1977;
Meinzer et al., 1990), protection of roots from acidic and reducing environments (Kimura
interactions with other plants (Inderjit, 1996), and probably many others. Any given
compound may well have several such roles (Bennett and Wallsgrove, 1994).
In addition, a single metabolite or class ofmetabolites present in a plant will not comprise the
only defense system. A wide variety of defense-related compounds may be present - in particular taimins, polyphenols, proteases and chitinases are very widely distributed even in species, which contains other major secondary metabolites such as cyanogenic glucosides, glucosinates, alkaloids, etc. There are also physical defense mechanisms such as secondary thickening of leaves, thorns and barbs, cuticular waxes, leaf hairs, and other structural factors
known to protect plants (Royle, 1976; Kollatakudy and Koller, 1983). Secondary metabolites
very often have a role (or roles) in plant/environment interactions, sometimes a major or dominant role, but they are not the only factors involved (Bennett and Wallsgrove, 1994).
The distribution of a secondary metabolite within a plant, both between tissues and during
growth and development, is rarely uniform. According to the review of Bennett and Wallsgrove (1994) many compounds are synthesized by, and accumulate in, young developing tissues, particularly leaves, or in reproductive tissues such as flowers and seeds. There appear to be many examples of secondary metabolites providing protection for young tissues, becoming less abundant and important as the tissue ages (Dement and Mooney, 1974;
Gates and Rhoades, 1977; Mauffette and Oechel, 1989; Fujimori et al., 1991).
1.1.c Types of plant secondary compounds
Secondary compounds emerge from a tremendous diversity of biochemical backgrounds
(Swain, 1974). They exhibit great diversity in their physical and chemical properties, in the
relations of the pathways that produce them to fundamental metabolic pathways, and in the
ways in which they exert toxic effects on biological systems (Swain, 1977). Given the
diversity in chemical properties alone, it would be very surprising if there did not exist some
sort of partitioning of the function of defense between the various classes of secondary
compounds (McKey, 1979). Contrarily to the majority opinions, Gottlieb (1990) demonstrate
that the secondary metabolites are equally essential to plant life, because they also adapt an
organism (plant) to herbivore pressure, but their protective functions are accidental, rather
than original or predestined. In this section, I will describe briefly some secondary
compounds, that are studied, in general, in research looking for tradeoffs between plant growth and secondary compounds production.
Phenglic Compounds:
The term "phenolic" is used to define substances that possess one or more hydroxyl (OH)
substituents bonded onto an aromatic ring (Figure 2). The natural plant phenolics arise
biogenetically from two main pathways: the shikimate pathways, which directly provide
phenylpropanoides such as the hydroxycinnamic acids and coumarins; and the polyketide
(acetate) pathway, which can produce simple phenols and also many quinones.
OH protocatechuicacid -OH
OH OH Jl
A,
-0-C H HOOC-\-^ A OH chlorogenic acid 0 p-coumaric acid OCH3 HO HO iCOOH OH gallic acid H0 ferulic acid cinnamic acid
Phenolics can play a role in virtually any interaction a plant can have with its environment,
biotic or abiotic. In terms of the biotic environment, these interactions may be as allelopathic
or feeding deterrents against herbivores (Appel, 1993; Waterman and Mole, 1994). In fact,
phenolics were believed to be the most important chemical defense against herbivores
(Whittaker and Feeny, 1971; Rhoades, 1979). This point of view was based in several studies
showing the effect oftannins on the herbivores (Feeny, 1968, 1970; Rhoades, 1977; McKey
et al., 1978). So far as the ecology of plant phenolics is concerned, plant-herbivore interactions are the most widely studied interactions, which these chemicals mediate. A key
factor in the development of this topic has been the considerable headway made with two
very general groups of proximate assay techniques, those for "total phenolics" and "tannins"
CWaterman and Mole, 1994).
Terpenoids:
Terpenoids are the most ubiquitous and structurally diverse class of natural products. Common plant terpene constituents include the monoterpenes, iridoids, abscisic acid, gibberellins, steroids, cardiac glycosides, saponins and carotenoids (Figure 3). The biosynthetic basis for the terpene nomenclature is determined by the number of five-carbon isoprene units incorporated into the carbon skeleton (Gershenzon and Croteau, 1991). Three
such isoprene units linked covalently yield a sesquiterpene. The biosynfhetically simplest
sesquiterpene is famesyl pyrophosphate (Figure 4), an unsaturated linear molecule which feeds into several alternative pathways, generating the major subclasses of sesquiterpenes
(Seaman, 1982).
The terpenoids are distinguished from other classes of secondary metabolites by their
common origin from mevalonate and isopentenyl pyrophosphate and by their broadly
lipophilic nature (Gershenzon and Croteau, 1990). Characteristic features of the lower
terpenoids are their volatility and intensely pungent odors; mono and sesquiterpenoids are the
most common components of flower scents and fragrances. Chemically, terpenoids are usually cyclic, unsaturated hydrocarbons, with varying degrees of oxygenation in the substituents groups (alcohols, aldehyde, lactone, etc.) attached to the basic skeleton
(Harbone, 1990).
H.C H.C, a-pinene p-pinene CH. H,C limonene camphene CH,'\
CH, SCH .C.H -/"\- ^c, CH3 'CH3 H,C-^WNSCH,menthol menthone myrcene
CH3 CH3
H,C-^c\.
HgC^ ^CHg
1:8cineole camphor
Figure 3. Structures of some fcerpenes
'0 |PP|
famesyl pyrophosphate
Alkaloids:
The alkaloids are a diverse collection of compounds whose only molecular similarity is the
presence of nitrogen (Figure 5). Those compounds occurring in plants can be divided into the
true alkaloids, the protoalkaloids and the pseudoalkaloids, according to their molecular
structure and biosynthetic pathways (Vickery and Vickery, 1981).
CH, T13 -N CH3 ° w,I N.
Q
Q-C-n"6d> ~"Yx> 6:r^cHa
O^N^N' O^N-^N ^N^ 6 CH3 theobromine CH30 SN' I CHs caffeine CHa CHs H3C-CH=C-CH2-CH-C,L '^\C^OH
CO CHaOCI
CHs cocaine CHaO 0I
NHCCHc CHaOLo Cr9
OCH, <SN^ ^ cotchicine CHaO CH^ y H"\1'ATN/>
O^N-^NT
CH3 theophylline .CH=CH2 HO. quinine CHzCHzNH; OCHo mescalineFigure 5. Structures of some representative alkaloids.
Several suggestions have been made concerning the function of alkaloids in plants, and it seems probable that these are useful to the plant in several ways. As with other toxic
secondary metabolites, the main function of alkaloids is probably to protect the plant against
All alkaloids have some physiological action, generally on the central nervous system
(Robinson, 1979). Alkaloid-containing plants probably cause more stock loss throughout the
world than any other type of poisonous plants. Plants responsible for most stock poisoning on a worldwide scale are Senecio and Crotalaria species, yew and green potatoes (Mattocks,
1972).
1.2 Taxonomy and secondary compounds
The types of secondary compounds found in a species are strongly determined by its
evolutionary history. Unlike the products of primary metabolism that are common to all
plants, the secondary metabolic profile of different plant species varies considerably,
reflecting evolutionary history through taxonomic relationships (Gottlieb, 1989, 1990;
Harbome, 1990). It is important, when comparing different species to do the comparison between species having broadly similar chemical defenses. I choose the family Asteraceae, because (a) it is a monophyletic group and therefore all of these plants share a common ancestry, (b) the dominant class of secondary compounds in this family are sesquiterpene lactones, other terpenes and polyacetylenes, and finally, there are a large number of species
within the Asteraceae. The following paragraphs describe this family and its characteristics.
1.3 Asteraceae Family
1.3.a Taxonomic aspects
The Asteraceae make up one of the largest and most successful flowering plant families, consisting of 12-17 tribes, approximately 1,100 genera, and 20,000 species (Cronquist,
1981). It is generally accepted that the Asteraceae are a "natural" family with well established
limits and a basic uniformity of floral structure imposed on all members (Heywood et al.,
1977). A combination of specialized floral characters (capitula, reduced and modified floral
parts, inferior ovaries, basal and erect ovules, and syngenesious anthers) supports the
monophyly of the family (Palmer et al., 1988). Recent classifications (Dahlgren, 1980;
Cronquist, 1981) have emphasized the distinctness of the family by placing it in a monotypic
order at the most advanced position in the Dicotyledonae. Although there is some controversy concerning the age of the family (Turner, 1977), fossil evidence (Cronquist,
1977; Muller, 1981) and biogeographical considerations (Raven and Axelrod, 1974) suggest
that the Asteraceae originated in the middle to upper Oligocene (30 million years ago) and
subsequently underwent rapid and extensive diversification.
1.3.b Chemical aspects
Several classes of plant compounds are characteristic of this family, notable the terpenoid-based sesquiterpene lactones, the fatty acid derived polyacetylenes and the polysaccharide fructans. The Asteraceae, in fact, are exceptionally rich, both in the range of secondary compounds present and also in the numbers of complex structures known of any one class
(Heywood et al., 1977). Furthermore the family is very distinctive in its chemical attributes.
Although no single class of constituent is unique to the family, the Asteraceae are unlike any other family in the array of characteristic constituents.
Many of the substances elaborated by the family are toxic or show other significant
physiological activity. The rich accumulation of essential oils and other terpenoids in certain
composites is responsible for the use of various members such as tansy (Tanacetum vulgare)
for flavoring foods or liqueurs (Heywood et a/., 1977). Terpenoids and certain phenolic
medicine. When considering the economic value of plants of the Asteraceae, it must be pointed out that the useful plants are to a considerable extent counter-balanced by the large number of weeds in the family. Indeed, there are few families with such an abundance of weedy members, many of which are extremely successful and have spread throughout the temperate areas of the world. The success of these weeds stems mainly from the development of biological features, which ensure both survivals under adverse environmental conditions and also a high reproductive rate. Chemical factors are, nevertheless, important in Asteraceae weeds in providing protection from over-grazing.
The family is chemically very distinct (Mabry and Bohlmaim, 1977). Inulin-type finctans,
seed oils sometimes containing characteristic fatty acids, bitter sesquiterpene lactones, pentacyclic triterpene alcohols, accumulation of large amounts of derivatives of caffeic acid,
of flavones and of methylated flavonols and a total lack of true tannins and of iridoid
glycosides were especially mentioned. Acetylenic compounds, not reported from the tribes Senecioneae and Cichorieae, and essential oils, not accumulated by latex-bearing Cichorieae, were likewise considered to belong to the chemical make-up of the family Asteraceae
(Hegnauer, 1977). The following paragraphs will describe the major groups of secondary
compounds studied in the Asteraceae at the present time.
Sesquiterpene lacfones
Sesquiterpene lactones are colorless, often bitter-tasting, lipophilic constituents, which are the most characteristic single group of chemicals known in the Asteraceae. They are present
mainly in leaf tissues and can constitute up to 5% of the dry weight (Heywood and Harbome,
1977). They have been detected in all the tribes except the Tageteae. A number are toxic to livestock and their major role in the ecology of the family seems to be as a deterrent to mammalian herbivores (Rodriguez, 1983; Harbome, 1988). The presence of sesquiterpene
lactones in the Asteraceae is often associated with a bitter taste, and it is likely that this
repellent taste response acts as a signal to protect the plants from being heavily grazed. They also have insecticidal activity (Marles et al., 1994). Furfhermore, the lactones are not only feeding toxins in the case of mammals but they also cause allergic contact dermatitis
(Rodriguez et al., 1976).
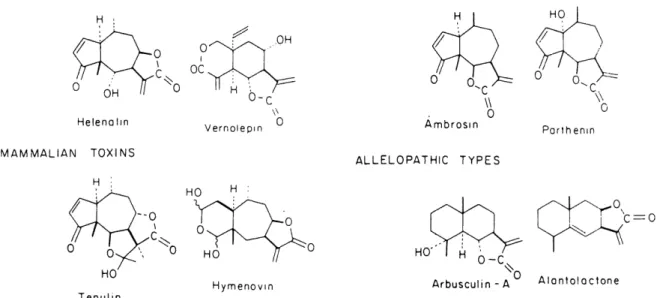
Picman (1986) in her review demonstrated that sesquiterpene lactones display a variety of
activities against numerous types of organisms (Figure 6). This suggests that the individual
lactones from this group of secondary plant metabolites may play a role in defense of plants against pathogens, herbivorous insects and mammals, and in competition with other plants. Sesquiterpene lactones form one of the largest group ofcytotoxic and anti-tumor compoimds of plant origin. Anti-bacterial, anti-fungal activity, anti-protozoan activity, activity against
human and animal parasites (including intermediate hosts) are other tribes of biological
activity.
CYTOTOXIC AND ANTITUMOR TYPES ALLERGIC CONTACT DERMATITIS TYPES
.OH
Ambrosm
ALLELOPATHIC TYPES
Parthenin
Arbuscutin - A Alantoloctone
Figure 6. A few of the many sesquiterpene lactones known to exhibit various types of
biological activities (copy from Mabry and Gill, 1979).
Triterpenes
Asteraceae are triterpene accumulators. Monols and diols of the oleanol, ursanol, and lupeol type are most characteristic of the family. They occur free or, more frequently, esterified with acetic acid or fatty acids in the lipid fractions of roots, stems, flowers and fruits and, in Cichorieae, in lattices (Hegnauer, 1977). The co-occurrence of the monols and diols represent a metabolic trend of the family as a whole. The synthesis of triterpene acids, saponins and rare triterpenoids, such as shionone, may become taxonomically useful in futm-e at the
generic and tribal levels.
Acetylenic compounds
These reactive substances have been found in roots, flowers and/or leaves of the great
majority of the composites that have been surveyed. According to Amason et al. (1992) there
are 700 known polyacetylene compounds (Figure 7), which are characteristic of the
Asteraceae, but are also found in several other families, but so far phototoxic polyacetylenes have not been recorded from the other families. Acetylenic compounds are much more labile than most other plant substances and they can only be isolated successfully from fresh plant material. Just as with other classes of secondary metabolites, a hierarchy can be discerned in
acetylene production. Synthesis of acetylenes is a characteristic of the family as whole and
distinct patterns may be attributes of tribes and lower systematic categories. These general trends, however, are often considerably upset by certain deviating taxa (Cichorieae and Senecioneae). The causes of this variation and versatility in secondary metabolism are generally unknown, but are most probably the consequences of selection. An ecological
function of many polyacetylenes is suggested by the nematicidal action and the antibiotic
properties of carlina oxide and the alexin-like behavior of the safflower (Carthamus
Ichthyothere terminalis (Spreng.) Malme (Chin et al., 1965) and Clibadium silvestre (Aubl.)
Baill. (Gorinsky et al., 1973) may be toxic for many organisms other than fishes.
H2C==C—C=C—C=C—C=0—C=C—CSC—CH, ^c—cssc—(^ ^ — CSC—g=g—9=CH, Thiophcnc* {I \^—c KC-CBC-CBC-CHi H,c—c=c—^ \>—c=c—fi==rc—c==;:«C-CBC-C«C-CH3 n,c—c=c—^ ^—c=c—^==^—c==,c^ s—s PhcnyUtcpatrlync Thiarobrine*
Figure 7. Structures of some polyacetylene compounds.
Alkaloids and alkaloid-like compounds
According to Hegnauer (1977), the Asteraceae is considered as a group in which alkaloids are
not rare. At the same time he affirms that evidence suggests alkaloid patterns are characteristic of species, genera or tribes rather than of the family as a whole. Probably the
most well known alkaloid present in this family is pyrrolizidme of Senecioneae and
Eupatorieae. Pyrrolizidine alkaloids are so effective as mammalian toxins that about 50% of
all cattle deaths due to plant poisoning (Heywood and Harbome, 1977), and occasionally of
humans (Mattocks, 1972), are the result ofingestion of these particular alkaloids. Hegnauer
1.4 What is RGR and how is it measured?
Growth analysis is often used as a tool to obtain insight into the functioning of a plant.
Growth could be defined as any type of change that occurs in an essential feature of life, like
the capacity to change in size, mass, form and/or number (Chiariello et al., 1991). Ecological studies examine growth in two different, but complementary, ways. The first emphasizes productivity and views growth as the change in mass of live biomass through time. The second emphasizes demographic processes and views growth as the difference between the production of new biomass units, or "modules" (such as leaves, stems, twigs, roots) and the
death or loss of old modules. Absolute growth during a time interval can be calculated by
simple subtraction: biomass or module number at the end of the interval minus at the beginning. This absolute growth rate is rarely used because it is so strongly influenced by plant size.
The fundamental parameter of traditional growth analysis is the relative growth rate (RGR),
also termed specific growth rate, which is the instantaneous rate of increase relative to the productive mass of the plant. It measures the mass of new biomass produced per unit of time by a given mass of pre-existing biomass, and is therefore analogous to a compound interest
rate. Introduced as the "efficiency index" by Blackman (1919), RGR provides one of the
most ecologically significant and useful indices of plant growth.
Specific leaf area (SLA) is the ratio of leaf area to leaf dry weight. It varies considerably
between environments and species and is plastic within individuals. In particular, SLA (like
the root: shoot ratio) decreases with increasing light intensities and changes in this attribute
One of the characteristics in which species of different habitats vary is their growth potential.
When grown under optimum conditions, plant species from fertile, productive habitats tend
to have inherently higher relative growth rates (RGR) than species from less favorable
environments even when plants are grown under optunum conditions and free of competition
(Christie and Moorby, 1975; Grime and Hunt, 1975; Poorter and Remkes, 1990; Lambers
and Poorter, 1992; McKenna, 1995). Under these conditions, fast-growing species produce relatively more leaf area and less root mass, which greatly contributes to their larger carbon
gain per unit plant weight. They have a higher rate ofphotosynthesis per unit leaf dry weight
and per unit leaf nitrogen, but not necessarily per unit leaf area, due to their higher leaf area per unit leaf weight. Fast-growing species also have higher respiration rates per unit organ weight, due to demands of a higher RGR and higher rate of nutrient uptake. However, expressed as a fraction of the total amount of carbon fixed per day, they use less in respiration (Lambers and Poorter, 1992).
Fast-growing species have a greater capacity to acquire nutrients, which is likely to be a consequence, rather than a cause, of their higher RGR. There is no evidence that
slow-growing species have a special ability to acquire nutrients from dilute solutions, but they may
have special mechanisms to release nutrients when these are sparingly soluble (Lambers and
Poorter, 1992).
Lambers and Poorter (1992) have analyzed variation in morphological, physiological,
chemical and allocation characteristics underlying variation in RGR, to arrive at an appraisal of its ecological significance. When grown under optimum nutrient conditions and
moderately low light intensity (300 ^mols/m2/s), fast growing species contain higher
concentrations of organic nitrogen and minerals. According to those researchers the lower
specific leaf area (SLA) of slow-growing species is at least partly due to the relatively high
protect against detrimental abiotic and biotic factors. As a consequence of a greater investment in protective compounds or structures, the rate ofphotosynthesis per unit leaf dry
weight is less, but leaf longevity is increased according to Lambers and Poorter (1992). There
is, however, little experimental evidence of this, and is one of the questions explored in this thesis.
1.5 The Dilemma of Plants: Growth and Defense.
The idea that a plant must accept tradeoffs because it must allocate limited resources among growth, reproduction, and defense has been central to ecological and evolutionary theories
(Feeny, 1976; Rhoades and Gates, 1976; Krischik and Denno, 1983; Coley et al., 1985;
Hemis and Mattson, 1992; Tuomi, 1992; Frank, 1993). If a plant allocates a greater proportion of resources to defense, then less should be available for growth and/or reproduction. The concept of costs and benefits of defense has been central to hypotheses fhat postulate variations in defense investment associated with successional status (Cates and
Orians, 1975), soil quality (Janzen, 1974), plant "apparency" (Feeny, 1976), leaf lifespan
(Janzen, 1974; Stanton, 1975), environmental variations facing a single species (Gates, 1975),
and intraplant distribution (Orians and Janzen, 1974; Rhoades and Gates, 1976).
Some of the literature published until now have considered the costs of defense on a whole-plant basis, i.e. direct carbon costs of construction of the molecules and the cost of maintenance of the cellular machinery needed to construct them, and indirect costs, which
involves the reduction in plant growth at some future time because of the allocation of carbon
to defense in the present. Givnish (1986) affirms that plants should be defended more heavily
in unproductive habitats or in slow-growing forms, in which a leaf is more costly to replace, in terms of nutrients or the photosynthetic period needed to repay its construction cost.
assimilates from growth, reducing the inherent growth rate of the plant. Table 1 shows that
the costs of the biosynthesis of a gram of defensive chemicals range from the same as, or up to twice as much as the mean cost of construction of a gram of leaves. A large investment in
costly reduced compounds may thus affect the plant's growth rate and vitality (Baas, 1989).
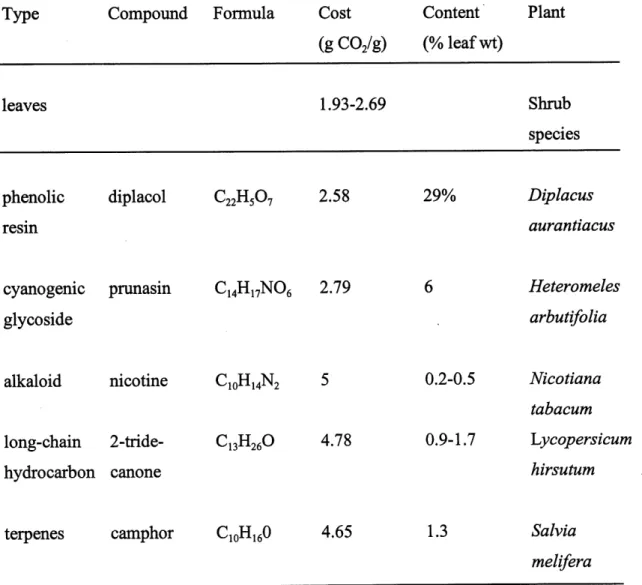
Table 1. Mean costs of construction of leaves and of various secondary compounds (after
Gulmon & Moony, 1986). Copy from Baas 1989.
Type Compound Formula Cost Content Plant
(g COs/g) (% leaf wt)
leaves 1.93-2.69Shrub
speciesphenolic diplacol €2211507 2.58
resm29%
Diplacus
auranttacuscyanogenic pnmasin C^H^NOe 2.79
glycoside
Heteromeles
arbutifolia
alkaloid nicotine CmHiJST, 5
long-chain 2-tride-hydrocarbon canone 10i-ti4-L'>12 C13H26° 4.78 0.2-0.5 Nicotiana tabacum 0.9-1.7 Lycopersicum hirsutum
terpenes camphor CioH^O 4.65 1.3
Salvia
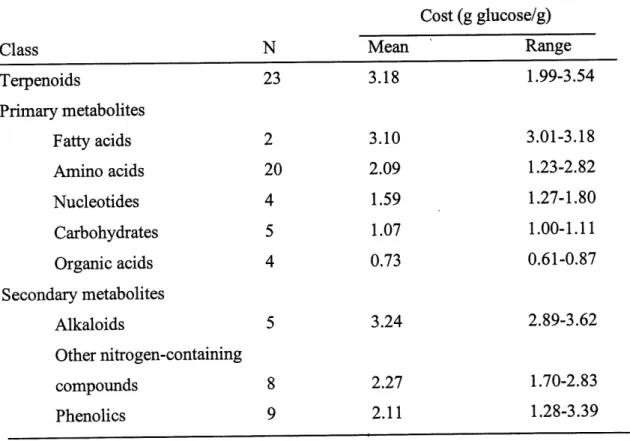
Gershenzon (1994) agrees that the costs to produce secondary compounds are more expensive than those to produce primary compounds and affirms that terpenoids are more expensive to manufacture per gram than most other primary metabolites (Table 2), but that the maintenance of this particular compound pool is probably inexpensive because there is no evidence that substantial quantities of terpenes are lost as a result of metabolic turnover, volatilization, or leaching. From studies on cosVbenefit relations, little direct correlation seems to exist between investment in defense compounds and benefits to the plant. Other factors could be influencing the production of the secondary compounds.
Table 2. Average substrate and cofactor costs for terpenoids and various other classes of plant primary and secondary metabolites (Gershenzon, 1994).
Class
TerpenoidsPrimary metabolites
Fatty acids
Amino acidsNucleotides
Carbohydrates
Organic acids
Secondary metabolitesAlkaloids
Other nitrogen-containing compoundsPhenolics
N
23
2
20
4
5
4
5
8
9
Mean 3.18 3.10 2.09 1.59 1.07 0.73 3.24 2.27 2.11Cost (g glucose/g)
Range 1.99-3.54 3.01-3.18 1.23-2.82 1.27-1.80 1.00-1.11 0.61-0.87 2.89-3.62 1.70-2.83 1.28-3.39The evolutionary response of plants to herbivores is also strongly influenced by other
selective pressures in the plant's environment, such as nutrient availability. Stidies of the resource availability hypotheses have tended to contrast the defense capacities of the plant species growing in two different resource states (McKey et ai, 1978; Bryant and Kuropat,
1980; Coley, 1983; Newberry and de Foresta, 1985; Baldwin and Schultz, 1988). However,
in most natural communities, individuals within a population of plants may often experience
a wide range of different levels of resource availability (Grime, 1979; Keddy, 1989).
Differences in resource availability have been shown to generate variation in defensive chemistry within a single species (Watennan et al., 1984; Larsson et al., 1986; Bryant et aL,
1987 b; Shure and Wilson, 1993). Such variation in defensive chemistry, even on a small
spatial scale, may influence host selection and subsequent success of insect herbivores (Zangerl and Berenbaum, 1993). Therefore, it is important to understand how a range of
resource availabilities influences phenotypic variation in plant allocation to defensive
chemistry.
In recent years, much attention has been focused on the mechanisms by which the environment may alter the plant's production of chemical defenses, and thereby alter the
susceptibility to herbivores (Mattson, 1980; Bryant et al., 1983; Mooney et al., 1983; Tuomi
et al., 1984). Carbon/nutdent balance is viewed as a key to understanding why plant
susceptibility changes under different growing conditions. We might expect that
carbon-based defensive chemicals (e.g. phenols, terpenes, acetylenes) should be scarce in plants subjected to reduced carbon uptake or very high respiration, where a low carbon/nutrient ratio would result. On the other hand, plants provided with adequate light, even when