for district planning in Maharashtra, India
The MIT Faculty has made this article openly available.
Please share
how this access benefits you. Your story matters.
Citation
Singh, Ranul, et al. "Analyzing rural drinking water services for
district planning in Maharashtra, India." Water Policy, 22, 1 (2020):
37-51. © 2020 The Authors.
As Published
http://dx.doi.org/10.2166/wp.2019.086
Publisher
IWA Publishing
Version
Final published version
Citable link
https://hdl.handle.net/1721.1/125623
Terms of Use
Creative Commons Attribution-NonCommercial-NoDerivs License
Analyzing rural drinking water services for district planning
in Maharashtra, India
Ranu Singh
a, Rahul Brahmankar
b, J. V. R. Murty
c, Piyush Verma
dand James L. Wescoat, Jr
d,*a
Leventhal Center for Advanced Urbanism, Massachusetts Institute of Technology, Cambridge, MA 02139, USA b
RSPMU, Water Supply and Sanitation Department, Government of Maharashtra, Navi Mumbai, India c
World Bank, India d
Department of Architecture, Massachusetts Institute of Technology, 77 Massachusetts Ave, Room 10-390, Cambridge, MA 02139, USA
*Corresponding author. E-mail: [email protected]
Abstract
India has made good progress toward meeting basic standards of access to safe drinking water, but improved planning methods are needed to prioritize different levels and types of water service needs for public investment. This paper presents a planning approach for collecting, analyzing, and mapping drinking water service data at the village, block, and district levels in Pune district, Maharashtra, India. The planning approach created a mobile application for data collection by gram sevaks at the village level. It employed ranking methods developed with district officers to prioritize villages with the greatest needs, cluster analysis to distinguish different types of needs, and geographic information system (GIS) mapping to visualize the spatial distribution of those needs. This analysis shows that there are high levels of spatial heterogeneity in water services within, as well as between, blocks but also that there are broad patterns of priorities for planning and policy purposes. These priorities include water service needs in the Western Ghats, a combination of water source and service needs in dissected plateau lands, source strengthening in the eastern plains, and local hot spots in peri-urban areas. Based on this Pune district case study, the Government of Maharashtra is testing the approach in five additional districts.
Keywords: Cluster analysis; Maharashtra; Pune; Rural drinking water; Water planning; Water services
This is an Open Access article distributed under the terms of the Creative Commons Attribution Licence (CC BY-NC-ND 4.0), which permits copying and redistribution for non-commercial purposes with no derivatives, provided the original work is properly cited (http://creativecommons.org/licenses/by-nc-nd/4.0/).
doi: 10.2166/wp.2019.086
Introduction
This paper shows how the analysis of village drinking water services can inform district planning in the state of Maharashtra, India, where a major program of water sector reforms known as Jalswarajya II (JS2) supported by the World Bank is underway. Despite widespread calls to shift from an emphasis on physical infrastructure to improving water services and to shift from centralized to local levels of water planning, detailed analysis of village drinking water services has been limited, and planning at decen-tralized levels remains underdeveloped (Sangameswaran, 2014; Schouten & Smits, 2015; Hutchings et al., 2017). District Annual Action Plans continue to emphasize infrastructure schemes over water ser-vice improvements, such as minimum rates of piped water supply in hours per day and days per week. Government offices provide rough estimates of water service in liters per capita per day, but those data are rarely measured, and additional data collection and analysis are needed to characterize water service conditions and prioritize village needs for planning and investment purposes.
Toward these ends, this paper presents an analytical approach for systematically collecting, ranking, and categorizing village drinking water service needs as a way to strengthen sector planning. It uses a case study of water services in four blocks of Pune district in the state of Maharashtra, India, which rep-resent a broad range of geographic and demographic conditions in that district (Figure 1). We begin by introducing the evolving situation in drinking water service planning in India and the JS2 project in Maharashtra in particular and then proceed to the methods of investigation employed in this research.
The evolving situation in India
After independence in 1947, India adopted a federal system of government with a strong central role in annual and five-year planning (Kapur et al., 2017). Although many high-level committees have rec-ommended the devolution of administrative authority and financial resources over the past century, it is primarily data collection and implementation responsibilities that have been devolved. Planning man-dates and methods remain centralized activities of the national and state governments. In India’s federal system, states have the paramount role in water matters within their jurisdictions, particularly for domestic water supply, and each state has developed its own approach. For example, Maharashtra has a reputation for water policy innovation, like the JS programs discussed in this paper, and for
emphasizing the district level of local policy implementation (Thakur & Singh, 1991;Hooja & Hooja, 2007).
Two policy cross-currents have shaped drinking water planning at different levels of government in recent decades. On the one hand, the historically strong national role in drinking water planning has been evident since the 1980s International Decade for Safe Drinking Water and Sanitation and again during the Millennium Development Goals period (2000–2015). On the other hand, neo-liberalization policies during the early 1990s have emphasized decentralization. In 1993, the Government of India passed the 73rd Amendment to the Constitution that gives a strong legal foundation for local governance ( panchayati raj) at the three levels of the gram panchayat (village), panchayat samiti (block), and zilla parishad (district) (Government of India, 1993). Even so, the central and state governments still control the methods and resources for local water planning. These cross-currents have led some scholars to speak of the post-neoliberal water policy (Bakker, 2013).
In 2009, the Government of India sought to combine both policy approaches in its National Rural Drinking Water Programme (NRDWP), which built upon earlier national drinking water programs in the 1980s and 1990s (Wescoat et al., 2016). On the one hand, it centralized NRDWP under a new Ministry of Drinking Water and Sanitation with a massive new Integrated Management Information System (IMIS) and a 10-year Strategic Plan for Rural Drinking Water 2011–2022. More recently in 2019, the Government of India created a Jal Shakti Ministry to encompass all water ministries and departments. At the same time, the NRDWP mandated implementation by states at the local gram panchayat level of government.
Government of India, Ministry of Drinking Water and Sanitation, National Rural Drinking Water Programme (NRDWP) (2013) set national standards of local water service. These standards began with a minimum water supply for rural villages of 40 liters per capita per day (lpcd) that recently increased to 55 lpcd, along with a 70 lpcd standard for peri-urban villages. A few states like Telangana and Gujarat adopted higher standards of 100 lpcd rather than follow the nationally set standards. These standards emphasize piped water supplies and household tap connections wherever possible (NRDWP, 2013, p. v;IMIS, 2019). To make progress toward these objectives, states and districts prepare Annual Action Plans that list proposed schemes in a common Excel spreadsheet format.
While impressive in many respects, the NRDWP approach to drinking water services faces a number of challenges. First, the water coverage metric is defined in lpcd, which is roughly estimated rather than measured, as few villages have bulk or individual water meters. Second, the IMIS database records water coverage in lpcd as a single value for the entire year, rather than as an average amount that varies over time, before, during, and after the monsoon. While more frequent estimates are made for drought-affected villages to provide a basis for state intervention, those figures are also estimated rather than measured. Other relevant data, e.g., water quality, are reported at the habitation rather than the village level which has limited their use in geographic information system (GIS) mapping (seeWescoat et al., 2019). Most importantly for this paper, basic parameters of community water ser-vice are not collected. These include hours of water serser-vice per day and the number of days of water delivered per week in water-scarce summer months and during the rest of the year.
At the state level, the Government of Maharashtra negotiated a major loan from the World Bank in 2014, called JS2, to improve rural drinking water services in selected water-stressed, water polluted, and peri-urban villages in 12 districts, and also to improve the capacity of water sector institutions to plan, implement, and monitor rural water supply and sanitation sector performance (World Bank, 2014). The JS2 project includes infrastructure schemes in pilot villages, and it treats them as one of several means
toward the broader aim of improving water service. Rural water services are defined as having house-hold tap connections that provide a sufficient, safe, and reliable supply of water on a daily and weekly basis throughout the year. In these respects, the Maharashtra JS2 program resonates with broader inter-national trends in the rural drinking water sector (e.g.,Schouten & Moriarty, 2003;Lockwood & Smits, 2011; Verma et al., 2014; Schouten & Smits, 2015; Hutchings et al., 2017).
Strengthening district drinking water planning in Maharashtra state
The JS2 program includes a component to strengthen rural drinking water sector planning by district governments, which began with a case study of Pune district (Figure 1). At present, district officers do not have professional training in planning theory or methods. Planning is a profession that addresses three main questions in the rural water sector: (1) What is the current situation in a district, i.e., the ser-vice levels in its 1,830 villages? (2) What are the water serser-vice needs and priorities? and (3) What are the alternative ways for achieving those goals? (Kulshrestha, 2012). As noted above, district Annual Action Plans are currently just spreadsheet lists of several hundred projects requested by villages and local poli-ticians and compiled by district engineers. The lists indicate rough levels of water coverage and annual lpcd service. Only a small fraction of the hundreds of projects listed can receive federal or state funding each year under the NRDWP and the state of Maharashtra’s Mukhyamantri Rural Drinking Water Pro-gram (MRDWP) due to budget constraints. To improve planning practice, this study selected Pune district as a case study. Within Pune district, the analysis focused on four case study blocks that span the range of demographic, hydroclimatic, and physiographic conditions in the district.
Pune district and case study blocks
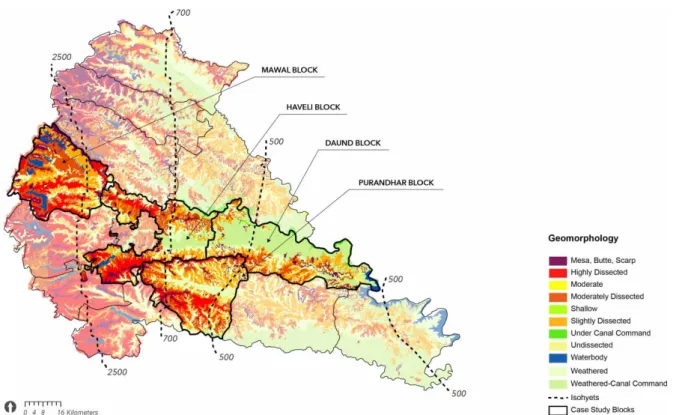
Pune district is relatively prosperous with strong administrative, industrial, and scientific organizations (e.g., the Indian Meteorology Department and Maharashtra Groundwater Surveys and Development Agency (GSDA)). Its capital, the Pune Municipal Corporation, is located approximately 150 km east of Mumbai. The district is roughly triangular in shape and extends from the high elevation Western Ghats eastward to the confluence of the Ghod–Bhima and Nira rivers. These two rivers delimit parts of the dis-trict’s northern and southern boundaries (Government of Maharashtra, 1885/2007). District governments in Maharashtra are called zilla parishads. Pune district comprises 14 blocks or talukas, which are governed by panchayat samitis. Local governments are called gram panchayats, which may contain one or more revenue villages, which may contain one or more small habitations. Pune district currently consists of one urban block (Pune city) and 13 rural blocks. These blocks have 1,401 gram panchayats, 1,877 revenue villages, and 9,207 habitations (Government of India, Ministry of Drinking Water and Sanitation, 2018). Pune district was selected for its strong gradient of demographic, environmental, and economic con-ditions from west to east (Figure 2). Monsoon rainfall declines from 3,000 mm/yr in the west to 500 mm/yr in the east. It is a part of a geological area known as the Deccan Volcanic Plateau, which is underlain by shallow basalt bedrock and hard rock aquifers that slope from northwest to southeast. Erosion has produced terrain that varies from steeply sloping highly dissected ridges and buttes in the west to moderately dissected plateau lands and river valleys in the middle and broad irrigated plains in the east (Wescoat, 2018). Villages in the hilly west are small in size and population, mixed in size in the middle of the district, and relatively large in size but low in population density in the
east. Villages in the hills have mixed resource-based economies, while villages in the middle are increas-ingly urbanized and those in the eastern plains are agrarian. These general patterns helped identify four subregions and case study blocks for detailed GIS and field analysis. The case study blocks follow the gradient from west to east and had high response rates to the mobile app survey described later in the paper (.70% of villages in each block).
1. Western Ghats–Mawal case study block: Western Ghats villages are relatively small in size and popu-lation. They receive very high amounts of monsoon rainfall from June to October (.2,500 mm/yr), but their steep slopes, rapid runoff, and limited aquifer storage lead to groundwater scarcity for much of the year (Foster et al., 2007; Government of India, Central Ground Water Board Report, 2013; World Bank, 2007). Steep ridges and butte landforms have famous fortresses, but the terrain makes it difficult to provide modern piped water supply and water service, except in places where tanks and reservoirs have been constructed. The case study block is named after its steep valleys (mawals), and its forest people were known as Mawalis during the Maratha period (c. 17th–18th centuries) (Raeside, 1978). 2. Plateau Transition–Purandhar case study block: While the entire Deccan region was initially a
pla-teau, erosion has left some broad upland ridges and mesas in the central part of the district. Their villages are mixed in size and population density, depending upon proximity to towns and reliable water supplies. Plateau villages experience moderate monsoon rainfall (∼700 mm/yr), shallow soils, and varied terrain that limit well yields, piped water supply, and water service delivery (Government
Fig. 2. Environmental base map and case study blocks (shown in full color) in Pune district. Source: authors, using GSDA geomor-phological data. Please refer to the online version of this paper to see this figure in color:http://dx.doi.org/10.2166/wp.2019.086.
of Maharashtra, GSDA report, 2018). The case study Purandhar block (a name associated with the deity Indra) lies south of the Pune metropolitan area, separated from it by a steep slope (ghat) and higher elevation, which made it an important defensive area during the Maratha period. However, its combination of upland mesas and low rainfall limit surface water supplies and storage today. 3. Peri-urban areas and corridors–Haveli case study block: Villages near urbanizing areas of the
dis-trict face water service challenges associated with increasing population and water demand. Like the plateaus, they have mesic rainfall conditions (∼700 mm/yr), but less dissected river valley terrain that facilitates infrastructure development and settlement. These patterns are most evident in the Pune and Pimpri–Chinchwad urban-industrial centers and secondarily along highways leading to major towns in surrounding blocks. In addition to water stress, these towns face water quality issues associated with inadequate urban and industrial wastewater treatment. The case study block named Haveli (which aptly refers to large, prosperous homes) surrounds Pune city.
4. Irrigated plains–Daund case study block: The eastern part of the district has a semi-arid climate (∼500 mm/yr), relatively flat terrain, and arable soils. Villages are relatively large in size but low in population density. Canal and tubewell withdrawals have supported extensive irrigation agricul-ture from the late-19th century to the present, with large areas of sugarcane and citrus in the kharif season. While irrigation has mitigated agricultural drought hazards, it has increased drinking water scarcity during the pre-monsoon summer months in the central Deccan Marathwada region. The case study Daund block exemplifies these conditions, which are amplified by the growth of the pharmaceutical industry.
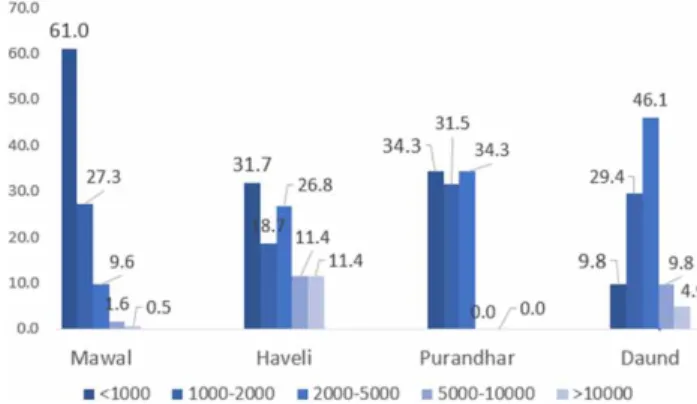
Demographic patterns in the four case study blocks are shown in Figure 3. The Mawal block in the Western Ghats area has a large fraction of very small villages (61% have,1,000 people) and a declin-ing frequency in each of the major census classifications. The peri-urban Haveli block has 11.4% of its villages and the majority of its total population in the largest category (.10,000 people). The plateau block, Purandhar, has a roughly equal frequency of small and mid-sized villages, and none that are large. The Daund block in the eastern plains has mainly mid-sized villages. These distinct characteristics of case blocks in environmental and demographic terms suggest that their water service conditions and planning implications would also vary, which is tested with statistical and GIS methods in the analytical sections that follow.
Methods
This study employs three main analytical methods relevant for rural drinking water planning: (1) water service data collection, analysis, and mapping of individual variables, (2) aggregate ranking to prioritize water service planning needs, and (3) cluster analysis to identify different types of water ser-vice needs. We briefly describe each of these methods and then proceed to the results.
Water service data collection, analysis, and mapping
As noted above, existing drinking water databases do not emphasize water services or factors impor-tant for providing and sustaining them. This study developed a mobile phone application for rapid data collection of water service data at the village level. The survey was developed with district drinking water officers, tested in the field with elected gram panchayat officials, and implemented by local gov-ernment gram sevak officers. This process yielded eight main water service variables for data collection and analysis:
1. Groundwater availability for drinking water in months per year (GWAL) – gram sevaks report groundwater availability in village wells in months, from all 12 months (score¼ 1) to 8 months or less (score¼ 5). This variable is an indicator of source reliability.
2. Percentage of household tap connections in the village (PHHT) – from 100% to less than 40%, which is an indicator of household water service and also equity, as poor households and those in distant habitations have difficulty getting household connections. In addition to identifying villages with the greatest need (score¼ 5), this variable identifies villages that have unequal levels of service (score¼ 3 or 4).
3. Days of piped water supply per week for summer months (DPWS)– from every day to once a week. This variable is an indicator of service in the peak stress period.
4. Days of piped water supply per week for non-summer months (DPWR)– from every day to once a week. This variable is an indicator of service in the lower stress months, and if it is infrequent, the system is poor.
5. Hours of piped water supply per day for summer months (HPWS)– from 3 h per zone to less than 30 min per zone. This variable is an indicator of service in the peak stress period.
6. Hours of piped water supply per day for non-summer months (HPWR)– from 3 h per zone to less than 30 min per zone. This variable is an indicator of service in the lower stress months, and if it is poor, either the infrastructure is not adequate and/or the operations and maintenance capacity is weak.
7. Tanker water provided in the last year (TANK)– from less than 30 days to more than 90 days. These data indicate drought conditions, which are a common phenomenon in villages of the Marathwada plains region.
8. Liters per capita per day (LPCD)– most villages in Pune district report the standard level of 40 lpcd coverage with small numbers reporting higher or lower coverage.
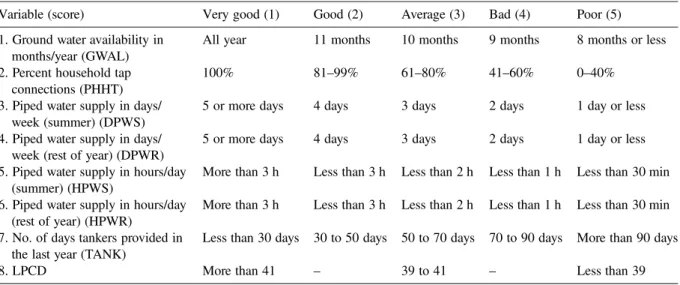
Other survey questions address watershed conditions, community water supplies, water system assets, financial practices, operations, and maintenance. Here, we concentrate on the eight central water service measures listed inTable 1. Gram sevaks who are government employees responsible for development
administration in a village collected the data and were supervised by block coordinators in district head-quarters. The mobile app interface identifies five levels of coverage for each variable, which the app converts into ordinal values (scored from 1 to 5) for analysis, mapping, and ranking purposes.
Results for individual variables were mapped on a GIS basemap of revenue villages to identify pat-terns of good and poor water service in villages across the four case study blocks. We hypothesized that while conditions will vary within a block, there will also be patterns of water service distinctive to each block.
Aggregate ranking and mapping of villages
Ranking on a common scale of 1–5 also enabled aggregate ranking and mapping of villages that have greater or lesser needs. We employed a simple additive approach to aggregating the 8 water service vari-ables, in which an aggregate score of 8 is a best possible score (all‘1s’) and 40 is the worst possible score (all‘5s’). For simplicity, we did not weight the scores. We mapped aggregate scores using natural breaks to identify five categories of water service conditions from very good to very poor. Those ranked very poor or poor become the priority villages for field assessment and potential inclusion in the Annual Action Plan. Cluster analysis and mapping of water service variables
While aggregate ranking identifies the overall levels of need, it does not discern different types and spatial patterns of water service needs. To provide those insights, we conducted a k-means cluster analy-sis of water service ranking data using theGeoDa (2019)spatial data analysis software. Cluster analysis methods have been used for many purposes in water supply planning (Raju & Duckstein, 2004), water quality planning (Kirstein et al., 2015), urban water classification (Noiva et al., 2016), and related issues (e.g., Diao et al., 2014). Villages ‘closer’ to one other in statistical and spatial terms are clustered together. A dendrogram is produced to graphically represent these clustering relationships. The
Table 1. Water service variables, levels, and ordinal values.
Variable (score) Very good (1) Good (2) Average (3) Bad (4) Poor (5) 1. Ground water availability in
months/year (GWAL)
All year 11 months 10 months 9 months 8 months or less 2. Percent household tap
connections (PHHT)
100% 81–99% 61–80% 41–60% 0–40% 3. Piped water supply in days/
week (summer) (DPWS)
5 or more days 4 days 3 days 2 days 1 day or less 4. Piped water supply in days/
week (rest of year) (DPWR)
5 or more days 4 days 3 days 2 days 1 day or less 5. Piped water supply in hours/day
(summer) (HPWS)
More than 3 h Less than 3 h Less than 2 h Less than 1 h Less than 30 min 6. Piped water supply in hours/day
(rest of year) (HPWR)
More than 3 h Less than 3 h Less than 2 h Less than 1 h Less than 30 min 7. No. of days tankers provided in
the last year (TANK)
Less than 30 days 30 to 50 days 50 to 70 days 70 to 90 days More than 90 days 8. LPCD More than 41 – 39 to 41 – Less than 39
dendrogram was then investigated from the simplest division of two clusters up to a maximum of six clusters. We settled upon five clusters, both for substantive distinctions that can be drawn and for its correspondence with the five levels individual and aggregate variable ranking. We hypothesized that villages in more developed blocks like Haveli and Daund would have greater problems with ground-water supply (GWAL), while less developed blocks like Mawal would have greater problems with water services, and intermediate blocks like Purandhar may have a mix of both planning issues.
Results and discussion
Single variable analysis and mapping
Analysis and mapping of individual variables yielded interesting results. We provide one example in
Figure 4. The good news is that most villages (64%) reported having groundwater available all 12 months of the 2017–2018 year. The greatest concerns arose in villages that had only eight to nine months of groundwater that year (10%). Spatially, every block has some villages with unreliable groundwater supplies. Those risks are concentrated in the Purandhar block, the plateau case study, and more specifically in villages on the northern side of that block. These groundwater supply problems are associated with moderately to highly dissected terrain in a low rainfall area of the district. The eight variables were individually mapped to identify specific village water service needs and discussed with district officials.
Aggregate water services ranking
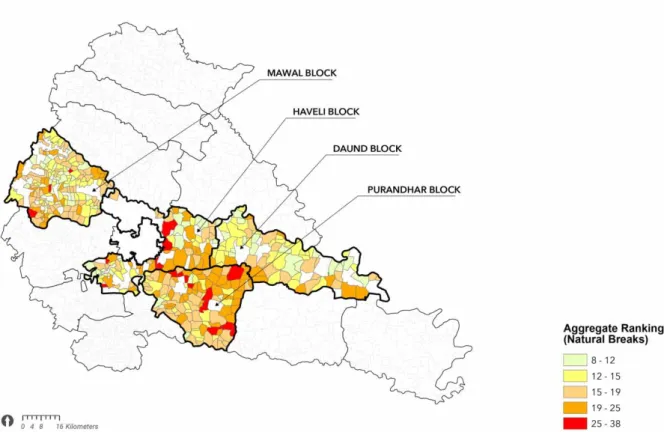
For planning purposes, it is useful to combine the eight variables in a simple aggregate score of water service conditions, which helps prioritize villages that have the greatest overall need. Aggregate scores were generated for each village by summing the 1–5 values for all eight water service variables. As noted in the methods section, variables were equally weighted and grouped into five categories using the natural break method in ArcMap. Low scores represent good water service levels, and high scores represent poor con-ditions, which are the villages to be flagged for attention in the Annual Action Plan. The best category of villages had scores of 8–12, and the poorest category of villages had scores greater than 25.
Villages with scores greater than 25 are top candidates for the next Annual Action Plan. Funds avail-able, those with scores from 19 to 24 could be considered.Figure 5shows the aggregate ranking results for villages in the four case study blocks. The best water services appear to be located in parts of Mawal and Daund blocks (i.e., in areas of both the upstream Western Ghats and the downstream eastern plains blocks). The Purandhar block has the lowest level of water services, which suggests a need for block-level planning as well as village-block-level support. A close inspection identified good conditions in parts of the peri-urban Haveli block, which supports a recent census-based analysis that identified good water and sanitation conditions in some larger peri-urban villages (Hui & Wescoat, 2018). Figure 5 also
Fig. 5. Aggregate ranking score for case study blocks, Pune district. Please refer to the online version of this paper to see this figure in color:http://dx.doi.org/10.2166/wp.2019.086.
shows that other peri-urban villages on the east side of Pune city have poor conditions. Another impor-tant finding was that all blocks have heterogeneous water service conditions, in which adjacent villages may have dramatically different conditions. If one considers the two lower categories of service (colored red and dark orange), then parts of each block will be high priorities for district planning.
Workshops in Pune district found that these individual and aggregate ranking methods are a simple and practical approach for district planners. The annual costs involve a half-day training session with district staff, followed by a half-day training session with local gram sevaks to complete a half-hour data entry process for each of their villages. District officials reported that this method is practicable and that it has the advantages of focusing on water services and of clearly visualizing and communicat-ing water service needs.
Cluster analysis of water service variables
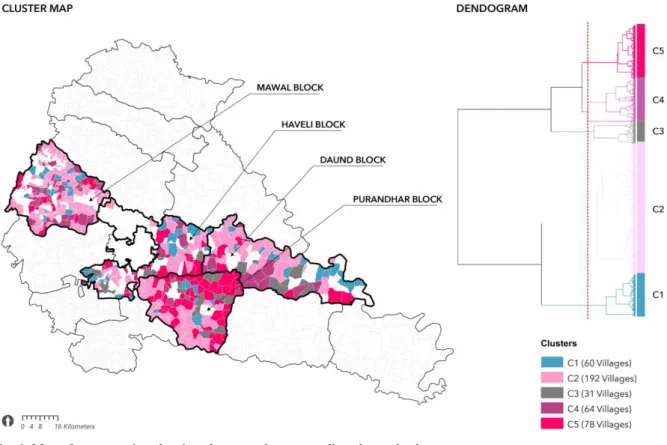
While aggregate ranking identifies villages with the greatest overall needs and is thus of primary importance for annual action planning, the cluster analysis is a more complex method that helps identify different types and patterns of needs. Ward’s method of the hierarchical cluster analysis in GeoDa yielded a dendrogram (Figure 6) that groups villages in clusters, starting at the level of individual pairs into progressively larger clusters until it includes all villages in one cluster. The clustering results were investigated at different cuts through the dendrogram using GIS mapping and box plots for each
variable in the cluster. This process led to the selection of five clusters that reflect different types of drinking water conditions, which are displayed in Figure 6and described below.
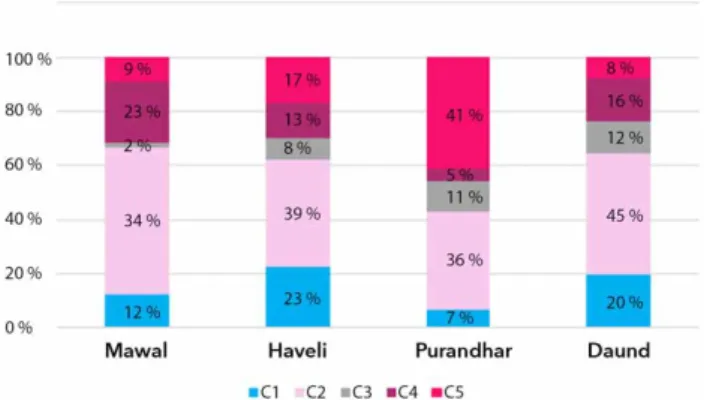
Cluster type 1 (C1): Villages with good groundwater availability and good water service (60 villages, 14%). Villages in this cluster have the best groundwater availability and piped water supply. They have average levels of household tap connection and lpcd service. As expected, they generally corre-spond with the best villages in the aggregate ranking analysis. They occur primarily in Haveli and Daund blocks and are least frequent in the Purandhar block.
Cluster type 2 (C2): Villages with fair groundwater availability but poor water service (192 villages, 45%). This cluster is the most common situation in the study area and occurs in all four case study blocks. Villages in this cluster have variable groundwater availability throughout the year, but they rank poorly in terms of piped water service, especially in terms of hours of piped water supply per day. There are large numbers of these villages in all four blocks, which reinforce the view that poor water service is the principal planning challenge in the district, especially in Mawal and Daund blocks. Cluster type 3 (C3): Villages with average groundwater availability and average water services (31 villages, 7%). This small cluster of villages has average or mixed conditions for all water supply and service variables. They are found at roughly the same frequency in all but Mawal block.
Cluster type 4 (C4): Villages with poor groundwater availability but decent water service (64 villages, 15%). This cluster type has villages with weak groundwater availability, but average to good water service conditions. For example, household tap coverage is average, but those who do have tap connections get rela-tively good service. The Mawal block has the most villages in this cluster (23%), followed by Daund (16%). Cluster type 5 (C5): Villages with poor water availability and poor water services (78 villages, 19%). Villages in this cluster have the worst groundwater availability and water services, and they would thus constitute the top planning priority. They generally correspond with the lowest-ranked villages. They are concentrated in the Purandhar block (41%), which reinforces the aggregate ranking results for that block. The second largest frequency in the Haveli block (17%) indicates the bimodal pattern of good and poor conditions in peri-urban areas. Interestingly, the most upstream (Mawal) and down-stream (Daund) villages have the fewest villages in this very poor cluster.
Again, the cluster analysis helps identify different types of planning conditions and needs in a district and especially the relative importance of source strengthening and water service needs. Figure 7
indicates that the four case study blocks have a larger proportion of water service problems than water source problems. The cluster analysis may be complex for local planning purposes at present, but it pro-vides a jointly quantitative and visual method for identifying types of water service conditions that may prove useful for district water planning in the future.
Conclusions
This analysis of water service variables, aggregate scores, and clusters on a common scale of 1 (good) to 5 (poor) enables a simple comparison of the results from each method. The results are not strictly comparable because the individual rankings are ordinal, while the aggregate rankings employ natural breaks, and the cluster analysis identifies different types of conditions. However, we still observe that a significant proportion of villages in the best aggregate rank corresponds with those in cluster 1, while a significant proportion of those in the poorest rank corresponds with those in cluster 5. District planners would logically focus their interventions on these poor conditions and look for positive lessons and innovations from the best conditions. They may develop different types of interventions for villages in each of the problematic clusters.
The analysis revealed spatial heterogeneity in water service conditions that calls for additional study. However, it identified broad patterns of water source and service conditions in the four case study blocks. The greatest concentration of issues was observed in the upland, low rainfall, dissected terrain of the Purandhar block in central Pune district, which suggests that a block-level planning approach may be useful in that area, along with multi-village planning.
At a higher level, this analysis supports the current policy direction of focusing on drinking water services. It identified salient water service variables for data collection and analysis. It developed a mobile app that demonstrates how simple quantitative estimates can be collected by local village offi-cers. It showed how these data can be aggregated to rank villages and clustered to identify different types of village needs. In each case, GIS mapping helped district officials visualize the frequency and distribution of village water needs. Based on the Pune case study, the Government of Maharashtra is testing the methodology in five additional districts.
This analysis can be taken further by incorporating new data (e.g., GSDA village observation wells and water quality data scraped from the IMIS database) and by diagnosing why metrics of water service vary among adjacent villages, blocks, and the district as a whole. That could entail multivariate analysis of demographic and environmental variables, including sanitation, water quality parameters, and com-peting water uses in the irrigation and industrial sectors that could lead toward a more comprehensive approach to rural water planning in India (Kumar et al., 2016).
Acknowledgements
We would like to express our appreciation for collaboration with the Government of Maharashtra, Water Supply and Sanitation Department, JS2 Reform Support Project Management Unit, Pune Zilla Parishad officers, and Mr Raghava Neti of the World Bank. The MIT Tata Center for Technology and Design provided generous funding for this research. Reviewers provided helpful and encouraging advice.
Conflict of interest
The authors declare that they have no conflict of interest in the research.
References
Bakker, K. (2013).Neoliberal versus postneoliberal water: geographies of privatization and resistance. Annals of the Associ-ation of American Geographers 103(2), 253–260.
Census of India (2011). 2011 Census, Population Enumeration Data. http://www.censusindia.gov.in/2011census/population_e-numeration.html. Last accessed November 28, 2019.
Diao, K., Farmani, R., Fu, G., Imani, M., Ward, S. & Butler, D. (2014).Clustering analysis of water distribution systems: identifying critical components and community impacts. Water Science and Technology 70, 1764–1773.
Foster, S., Garduño, H. & Tuinhof, A. (2007). Confronting the Groundwater Management Challenge in the Deccan Traps Country of Maharashtra: India. Sustainable Groundwater Management Lessons from Practice, Case collection profile no. 18. World Bank, Washington, DC.
GeoDa (2019). GeoDa: An Introduction to Spatial Data Analysis. Available at: https://geodacenter.github.io/ (Accessed September 6, 2019).
Government of India (1993). 73rd Amendment to the Constitution of India. Available at: https://www.india.gov.in/my-govern-ment/constitution-india/amendments/constitution-india-seventy-third-amendment-act-1992(Accessed September 30, 2018). Government of India, Central Ground Water Board (GOI-CGWB) (2013). Ground Water Information, Pune District,
Mahar-ashtra. CGWB, Nagpur.
Government of India, Ministry of Drinking Water and Sanitation, National Rural Drinking Water Programme (NRDWP) (2013). Guidelines. NRDWP, New Delhi.
Government of India, Ministry of Drinking Water and Sanitation (2018). Integrated Management Information System (IMIS) Database. Available at: https://ejalshakti.gov.in/IMISReports/NRDWP_MIS_NationalRuralDrinkingWaterProgramme.html
(Accessed November 30, 2019).
Government of Maharashtra (1885/2007). Poona District Gazetteers, 3 volumes. Available at: https://archive.org/details/ PoonaDistrictGazetteersPartOne-English(Accessed March 11, 2019).
Government of Maharashtra, Groundwater Surveys and Development Agency (GSDA) (2018). Hydrology of Maharashtra. GSDA, Pune.
Hooja, R. & Hooja, M. (eds) (2007). Democratic Decentralization and Planning. Rawat, New Delhi.
Hui, R. & Wescoat Jr, J. L. (2018).Visualizing peri-urban and rurban water conditions in Pune district, Maharashtra, India. Geoforum. Available at: https://doi.org/10.1016/j.geoforum.2018.01.008 (Accessed September 30 2018).
Hutchings, P., Franceys, R., Smits, S. & Mekalaet, S. (2017). Community Management of Rural Water Supply: Case Studies of Success from India. Routledge, New York.
IMIS (2019). Physical Progress Reports. Integrated Management Information System.https://ejalshakti.gov.in/imisreports/. Last accessed November 28, 2019.
Kapur, D., Mehta, P. B. & Vaishnav, M. (2017). Rethinking Public Institutions in India. New Oxford University Press, Delhi. Kirstein, J. K., Albrechtsen, H. -J. & Rygaard, M. (2015).Topological clustering as a tool for planning water quality monitoring
in water distribution networks. Water Science and Technology: Water Supply 15(5), 1011–1018.
Kulshrestha, S. K. (2012). Urban and Regional Planning in India: A Handbook for Professional Practice. Sage, New Delhi. Kumar, M. D., James, A. J. & Kabir, Y. (eds) (2016). Rural Water Systems for Multiple Uses and Livelihood Security. Elsevier,
Amsterdam.
Lockwood, H. & Smits, S. (2011). Supporting Rural Water Supply: Moving Towards a Service Delivery Approach. Practical Action, Rugby, UK.
Noiva, K., Fernandez, J. E. & Wescoat Jr, J. L. (2016).Cluster analysis of urban water supply and demand: toward large-scale comparative sustainability planning. Sustainable Cities and Society 27, 484–496.
Raeside, I. (1978).A note on the‘Twelve Mavals’ of Poona district. Modern Asian Studies 12(3), 393–417.
Raju, K. S. & Duckstein, L. (2004).Integrated application of cluster and multicriterion analysis for ranking water resources planning strategies: a case study in Spain. Journal of Hydroinformatics 6(4), 295–307.
Sangameswaran, P. (2014). Neoliberalism and Water: Complicating the Story of Reform. Orient Blackswan, New Delhi. Schouten, T. & Moriarty, P. (2003). Community Water, Community Management: From System to Service in Rural Areas.
ITDG Publishing, London.
Schouten, T. & Smits, S. (eds) (2015). From Infrastructure to Services: Trends in Monitoring Sustainable Water, Sanitation, and Hygiene Services. Practical Action, Rugby, UK.
Thakur, D. & Singh, S. N. (eds) (1991). District Planning and Panchayati Raj. Deep and Deep Publications, New Delhi. Verma, K., Bisht, B. & Cronin, A. (eds) (2014). Decentralized Governance in Water and Sanitation in Rural India. Academic
Foundation, New Delhi.
Wescoat Jr, J. L. (2018). Human use of landforms on the Deccan Volcanic Plateau: formation of a geocultural region. Geomorphology 331, 175–190.
Wescoat Jr, J. L., Fletcher, S. & Novellino, M. (2016).National rural drinking water monitoring: progress and challenges with India’s IMIS database. Water Policy 18(4), 1015–1032.
Wescoat Jr, J. L., Shah, R. P., Singh, R. & Murty, J. (2019).Habitations, villages, and gram panchayats: local drinking water planning in rural India with a Pune district case study. Journal of Water, Sanitation and Hygiene for Development 9(3), 522–530.
World Bank (2007). Confronting the Groundwater Management Challenge in the Deccan Traps Country of Maharashtra– India. Sustainable Groundwater Management: Concepts and Tools. The World Bank, Washington, DC, USA.
World Bank (2014). Maharashtra Rural Water Supply and Sanitation Program. Project Appraisal Document. Report no. 76172-IN. World Bank, Washington, DC, USA.