PLANT BIOLOGY EARTH, ATMOSPHERIC, AND PLANETARY SCIENCES
North America’s oldest boreal trees are more efficient
water users due to increased [CO
2
], but do not
grow faster
Claudie Gigu `ere-Croteaua,b,c,1, ´Etienne Boucherb,d,e,1,2, Yves Bergerona,c,f, Martin P. Girarding, Igor Drobyshevc,f,h, Lucas C. R. Silvai, Jean-Franc¸ois H ´elieb,j, and Michelle Garneaub,d,e
aDepartment of Biology, Universit ´e du Qu ´ebec `a Montr ´eal, Montr ´eal, QC H2X 1Y4, Canada;bGEOTOP, Universit ´e du Qu ´ebec `a Montr ´eal, Montr ´eal, QC H2X
1Y4, Canada;cCentre d’ ´Etudes sur la For ˆet, Universit ´e du Qu ´ebec `a Montr ´eal, Montr ´eal, QC H2X 1Y4, Canada;dDepartment of Geography, Universit ´e du
Qu ´ebec `a Montr ´eal, Montr ´eal, QC H2X 3R9, Canada;eCentre d’ ´Etudes Nordiques, Universit ´e Laval, Qu ´ebec, QC G1V 0A6, Canada;fInstitut de Recherche sur
les For ˆets, Universit ´e du Qu ´ebec en Abitibi-T ´emiscamingue, Rouyn-Noranda, QC J9X 5E4, Canada;gCentre de Foresterie des Laurentides, Ressources
Naturelles Canada, Sainte-Foy, QC G1V 4C7, Canada;hSwedish University of Agricultural Sciences, Southern Swedish Forest Research Centre, SE-230 53
Alnarp, Sweden;iEnvironmental Studies Program, Department of Geography, Institute of Ecology and Evolution, University of Oregon, Eugene, OR 97403;
andjDepartment of Earth and Atmosphere Sciences, Universit ´e du Qu ´ebec `a Montr ´eal, Montr ´eal, QC H2X 3Y7, Canada
Edited by Donald R. Ort, University of Illinois, Urbana, IL, and approved December 20, 2018 (received for review September 27, 2018)
Due to anthropogenic emissions and changes in land use, trees are now exposed to atmospheric levels of [CO2] that are unprece-dented for 650,000 y [L ¨uthi et al. (2008) Nature 453:379–382] (thousands of tree generations). Trees are expected to acclimate by modulating leaf–gas exchanges and alter water use efficiency which may result in forest productivity changes. Here, we present evidence of one of the strongest, nonlinear, and unequivocal postindustrial increases in intrinsic water use efficiency (iWUE) ever documented (+59%). A dual-isotope tree-ring analysis (δ13C and δ18O) covering 715 y of growth of North America’s oldest boreal trees (Thuja occidentalis L.) revealed an unprecedented increase in iWUE that was directly linked to elevated assimilation rates of CO2(A). However, limited nutrient availability, changes in carbon allocation strategies, and changes in stomatal density may have offset stem growth benefits awarded by the increased
iWUE. Our results demonstrate that even in scenarios where a
positive CO2 fertilization effect is observed, other mechanisms may prevent trees from assimilating and storing supplementary anthropogenic emissions as above-ground biomass. In such cases, the sink capacity of forests in response to changing atmospheric conditions might be overestimated.
water use efficiency | carbon dioxide | stable isotopes | productivity | boreal forest
P
lants are an integral component of both water andcar-bon cycles on Earth. This is because stomata (i.e., micro-scopic apertures on plant leaves) allow plants to adjust their metabolism to changing environmental conditions by control-ling the tradeoff between CO2 intake for photosynthesis and
water loss through transpiration. However, since the beginning of the industrial period, anthropogenic emissions and changes in land use resulted in a 40% increase in atmospheric [CO2] (1)
(hereafter referred to as ca). Plants have not been exposed to
concentrations above 290 ppm for at least 650,000 y (2, 3), so the dynamic carbon–water coupling that prevailed for several millen-nia could be disrupted with potential, yet uncertain, impacts on hydro-ecosystem functioning (4, 5).
One of the most striking consequences of elevated ca is an
increase in plant intrinsic water use efficiency (iWUE, i.e., the rate of carbon uptake per unit of water lost). The rate of increase of iWUE in response to rising cadepends on how the assimilation
rate (A) and/or stomatal conductance (gs) adjusts to determine
the optimal internal [CO2] (ci) (5, 6). Three theoretical
sce-narios (hereafter referred to as S1–S3) have been proposed (7) as guidelines on how to interpret possible acclimation strate-gies and their respective effects on iWUE (Fig. 1). In S1, plants maintain a constant ci (iWUE increases strongly); in S2, there
is a constant ci/ca ratio (iWUE increases moderately); and in
S3, there is a constant difference between ca and ci (iWUE
remains constant). Short-term flux measurements (4) and free-air CO2 enrichment (FACE) experiments (8) have shown that
S1 requires a strong and active physiological response leading to the highest rates of iWUE increase, most consistent with a strong CO2fertilization effect. However, the active iWUE response
doc-umented over short periods of time (yearly to decadal) may not reflect the changes occurring on longer timescales characteristic of natural forests (decadal to centennial). Over these timescales, there is no clear line of evidence that points toward a single, timescale-independent, acclimation strategy. To the contrary, the emerging concept of “optimal stomatal behavior” implies that woody plants shift along a continuum of strategies (5) and adjust gs to maximize carbon gains while minimizing exposure
to drought stress. This complex interplay takes place on yearly to multidecadal timescales and therefore requires the investiga-tion of time series that are sufficiently long to be able to track and compare present-day stomatal behavior and iWUE changes to preindustrial reference levels.
Moreover, it is still unclear how these shifts in stomatal behav-ior impact forest productivity, i.e., whether changes in the rate of increase in iWUE are mirrored by changes in growth rates. Based on FACE studies (8), one could hypothesize that increases
Significance
The metabolism of North America’s oldest boreal trees (Thuja occidentalis L.) is strongly affected by rising anthropogenic CO2emissions. Intrinsic water use efficiency (iWUE) increased
dramatically, although nonlinearly, since the beginning of the industrial Era. Our study shows that while T. occidentalis L. acclimated to rising [CO2], no stem growth was observed,
suggesting that trees could not benefit from the increased iWUE.
Author contributions: C.G.-C., ´E.B., Y.B., I.D., and M.G. designed research; C.G.-C., ´E.B., and M.P.G. performed research; C.G.-C., ´E.B., M.P.G., and J.-F.H. contributed new reagents/analytic tools; C.G.-C., ´E.B., Y.B., M.P.G., I.D., L.C.R.S., and J.-F.H. analyzed data; C.G.-C., ´E.B., Y.B., M.P.G., I.D., L.C.R.S., and J.-F.H. wrote the paper; and ´E.B. provided funding.y
The authors declare no conflict of interest.y This article is a PNAS Direct Submission.y
This open access article is distributed underCreative Commons Attribution-NonCommercial-NoDerivatives License 4.0 (CC BY-NC-ND).y
1C.G.-C. and ´E.B. contributed equally to this work.y
2To whom correspondence should be addressed. Email: boucher.etienne@uqam.ca.y This article contains supporting information online atwww.pnas.org/lookup/suppl/doi:10. 1073/pnas.1816686116/-/DCSupplemental.y
A
B
C
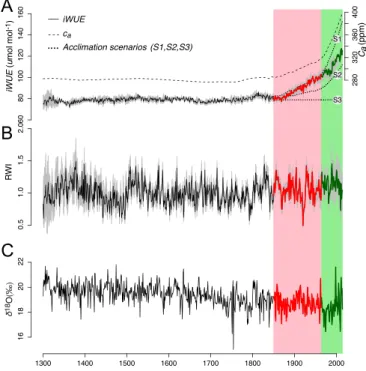
Fig. 1. Evolution of iWUE, ca, RWI, and δ18O since 1300 CE for old-growth
white cedars at lake Duparquet, Eastern Canada. Two distinct periods emerge which have been highlighted through different coloring and shad-ing: P1 (1850–1965, red) and P2 (1965–2014, green). (A) iWUE is calculated
from δ13C-derived physiological parameters shown in Fig. 2. The gray
shad-ing around the iWUE curve represents the intertree variability. The three
theoretical iWUE scenarios presented in the Introduction (S1, constant ci;
S2, constant ci/ca; and S3, constant ca− ci) are plotted as dotted lines. (B)
Annually resolved RWI chronology, RCS standardized with bootstrap 95% CI
(gray shading). (C) δ18O values.
in iWUE (e.g., S1 or S2) would enhance stem growth. However, at least in boreal North America, tree-ring–based and biocli-matic modeling studies found little evidence of a widespread growth of forest stands that could be attributed to ca increases
(9, 10). Conversely, in this zone, growth has declined over vast portions of land, which has been attributed to the nega-tive effects of temperature-induced droughts (10, 11). However, few of these tree-ring studies were accompanied by a thorough and time-continuous investigation of changes in gas exchange in response to increasing ca. Only one study measured changes
in iWUE and found that the positive response to ca could not
compensate for growth declines observed at the southernmost fringe of the boreal forest (12). Nevertheless, a high level of uncertainty persists with regard to the linkages between climate variability, iWUE, and forest productivity and their changes since preindustrial times.
To remedy this uncertainty, we report on the acclimation of a population of long-lived white cedars (Thuja occidentalis L.) growing in xeric conditions that offers a unique, long-term perspective on iWUE–growth relationships. We present a long (1300–2014), annually resolved, multiproxy tree-ring chronol-ogy in eastern North America (ring widths and stable isotopes of carbon and oxygen), to track changes in iWUE and growth attributable to rising ca and climate variability for a period that
extends far beyond the onset of the Industrial Era. Results and Discussion
Acclimation to Rising ca. Our results indicate a remarkable and unprecedented (59%) iWUE increase over the past 150 y (Fig. 1A). δ13C-derived physiological parameters reveal that
old-growth white cedars have been acclimating to rising ca in two
distinct stages: period 1 (P1: 1850–1965, red shaded area in Fig. 1) and period 2 (P2: 1965–2014, green shaded area). During P1, a 37.42-ppm increase in ca was accompanied by a slight and
non-significant (P > 0.05) 1.84-ppm increase in ci (Fig. 2 and SI Appendix, Table S1). This translates into a 28% iWUE increase compared with preindustrial (1300–1850) averages. Thus, during P1, for each increase of ca of 1 ppm, ci rose by only 0.05 ppm.
This response nearly matches predictions from S1 according to which ci would remain constant for increasing ca (see
Introduc-tion for details) (Fig. 1A). Once careached 320 ppm (onset of P2),
cistarted to rise proportionally to ca (Fig. 2), resulting in a
con-stant ci/caratio of 0.49 (SI Appendix, Table S1), accompanied by
an additional 31% increase in iWUE (in agreement with S2). The observed rate of iWUE increase during P1 (0.59 µmol·mol−1per ppm of c
a) is among the highest ever reported
for the Northern Hemisphere (13–17). Thus, even at a mature age, white cedars can actively respond to rising ca, by
maintain-ing a constant ci. Around the world, evidence from tree-ring
analyses to support the hypothesis of a constant ci (S1) exists,
but is scarce. Prosopis alba (Griseb.) trees from the Atacama Desert (Chile) maintained a constant ci from 1890 (earliest date
in study) to 1980 (18). A population of Smith fir (Abies georgei var. smithii) trees of the southeastern Tibetan plateau in China (19) presented a constant ci(150 ppm) from 1900 (earliest date
in study) to 1944. In Finland, all beech, oak, and pine species also revealed a relatively constant ci from 1895 (earliest date in
study) to 1975 (20). At our site, once ca reached 320 ppm, the
rate of increase of iWUE slowed down to 0.31 µmol·mol−1per 1 ppm of ca, marking the beginning of P2 and a lower sensitivity
to increasing ca. While uncommon, similar shifts from a
near-constant ci to a proportional increase of ci with rising ca have
been observed in relatively arid (19) and temperate areas (20), but were never reported in boreal North America.
Fig. 2. Tree-ring δ13C (corrected for Suess effect), derived physiological
parameters (δ13C, c
i, ci/ca, ∆, ca− ci, iWUE plotted against ca. The
scat-ter plot is divided into three periods: preindustrial (black, <1850), P1 (red, 1850–1965), and P2 (green, 1965–2014). Linear trends describing the
evo-lution of physiological parameters as a function of caare depicted for P1
and P2. Thick lines represent significant (P < 0.05) increasing or decreasing trends.
PLANT BIOLOGY EARTH, ATMOSPHERIC, AND PLANETARY SCIENCES
A shift in the acclimation strategy to rising ca implies active
physiological adjustments, either through carbon assimilation rate, A, or stomatal conductance, gs, or both (5). To determine
the relative importance of each factor for δ13C-derived iWUE in
white cedars, we used a tree-ring δ18Oanalysis. According to the
dual-isotope theory (21), the δ18Ocomposition of tree rings is
unaffected by photosynthetic activity (22) and more influenced by source-water composition, isotopic exchanges with plant tis-sues, and evaporative enrichment of leaf water (23, 24). Our year-resolving tree-ring δ18Otime series (Fig. 1C) shows no cor-relation with δ13Cvalues (P > 0.05) and does not follow the increases in iWUE observed after 1850. Up to 1965, δ18Oremains relatively constant while δ13Ccontinually increases (SI Appendix,
Fig. S11), suggesting that stimulation of A by increased CO2
may be responsible for the pronounced increase in iWUE during P1. After 1965 (P2), however, mature T. occidentalis L. prob-ably switched from an A-dominated to a gs-dominated iWUE
response. A steady increase in both δ18
Oand iWUE which
per-sists until the end of our time series indicates a declining stomatal conductance and transpiration, which is typically accompanied by enrichment in leaf water with18O due to the preferential
evaporation of lighter oxygen isotopes (24).
Ultimately, our study provides in situ evidence of a shift in stomatal behavior: Old-growth white cedars maximized carbon gains at low ca (during P1), but minimized water losses and
exposure to drought stress at higher ca (during P2). This switch
in acclimation strategy is coherent with the one proposed by the optimal stomatal behavior theory (5). Indeed, based on a large number of field and [CO2]-enrichment studies, the theory
suggests that as ca increases, no fixed homeostatic set point is
observed in tree acclimation. Thus, at low ca, plants seem to
be profligate water users, as incremental increases in gs lead
to significant carbon gains. However, at high ca, saturation of
the photosynthetic apparatus forces the switch to a drought-avoidance strategy, because incremental increases in gs lead to
water losses that are disproportionately large relative to carbon gains. In conformity with that theory, we postulate that the shift from P1 to P2 indicates that white cedars are getting closer to sat-uration with rising ca. iWUE of white cedars will thus continue to
increase in the near future, but at half the pre-1965 rate.
Contributions of caand Climate to iWUE Variability. Commonality analysis revealed that both ca and climate predictors [growing
season (May–August) average air temperatures (T), soil mois-ture index (SMI), and vapor pressure deficit (VPD)] had a sig-nificant effect on iWUE during the 1953–2014 period. However, each variable had its maximal effect at a different time frequency. To show this, we incrementally filtered out the lower-frequency component of iWUE, each time computing a new commonal-ity analysis (Materials and Methods). While the lower-frequency bands (f ) between 0 cycle·y−1and 0.03 cycle·y−1(cycle lengths
between ∞ and 75 y) were incrementally removed, caexplained
75% ± 9% of the variance in iWUE and beta weights remained very high (0.9 ± 0.03) (Fig. 3 A and B). About 20% of the over-all effect of ca on iWUE also appeared to be shared with that of
other climatic variables, namely VPD and T (Fig. 3 C, 1). As the degradation of the iWUE signal continued, ca quickly became
less dominant and the importance of climate predictors progres-sively increased. For example, filtering out the low-frequency component of iWUE up to f = 0.05 cycle·y−1 (cycle lengths = 20 y) boosted beta weights and proportion of variance explained by climate predictors to a point that exceeds those of ca (Fig. 3 A and B). More specifically, the pure (positive) effect of
sum-mer VPD at higher frequencies (cycle length = 20 y) rose to
nearly 20% (±6%), while ca had no more effect on iWUE at
those timescales (Fig. 3 C, 2).
While most of the variance in iWUE can be explained by low-frequency variations in ca, climate variables influence iWUE at
Propor tion of Va riance 0.005 0.010 0.020 0.050 0.100 0.200 0.500 200 100 50 20 10 5 2 200 100 50 20 10 5 2 T VPD SMI ca 0.0 0.2 0.4 0.6 0.8 1.0 T VPD SMI ca cycles ( f ) years 1 2 1 f=0.013 (75 years) 2 f=0.125 (8 years) shared pure Effects Propor tion of Var iance Beta Weights 0 0.2 0.4 0.6 0.8 1.0 -1.0 -0.5 0 0.5 1.0 VPD T SMI Ca R2
A
B
C
Fig. 3. (A and B) Commonality analysis showing beta weights (A) and the
proportion of variance (B) in iWUE explained by the pure effects of ca(gray)
and growing-season (May–August) temperatures (T, blue), VPD (green), and SMI (red). Color bands represent the bootstrap 95% CIs for beta weights and proportion of variance explained in iWUE. (C) Pure and shared effects are detailed for two specific iWUE frequencies: f = 0.013 (75 y) (C, 1) and f = 0.125 (8 y) (C, 2).
the higher end of the frequency spectrum. The strong relationship between ca and low-frequency changes in iWUE could somehow
be expected because variations in iWUE are physiologically linked to ca (25). At higher frequencies though, VPD, an important
driver for transpiration, plays a slightly more important role in controlling iWUE, as documented for other species and environ-ments (26). This implies that at annual to subdecadal timescales, increases in VPD led to reductions in stomatal conductance and increases in iWUE during the growing season (27).
The unprecedented increase in iWUE since 1850, however, cannot be attributed to changes in climate. For example, hypoth-esizing that the iWUE increase was climate induced would imply that increasingly dry conditions would have prevailed, causing a sustained stomatal closure and a drastic increase in iWUE. However, no such clear trend has been found in climate records extending back to 1901 (SI Appendix, Fig. S13). The pre-1965 period actually shows increasingly wetter/colder growing seasons (lower T and higher SMI). These pre-1965 trends seem to be confirmed by several independent dendrochronological indica-tors that point toward a decrease in the intensity and frequency of droughts in the area: The amount of biomass being burned in northwest Quebec has decreased since 1930 (28, 29), water lev-els of lake Duparquet have been rising since 1850 (30), and an increase in the severity of spring floods has been reported dur-ing that period (31). Growdur-ing-season climate conditions became drier/hotter only after 1965 (T increased, SMI decreased, and VPD increased).
As trees have been acclimating to rising ca levels since the
beginning of the Industrial Era, it appears plausible that cli-matic factors played only a marginal and indirect role in the observed interdecadal variability in iWUE. The strong stimula-tion of photosynthesis during P1 needed to rely upon a high stomatal conductance that probably would not have been possi-ble if drier conditions prevailed. In contrast, the drier post-1965
climate conditions probably reinforced the drop in stomatal con-ductance during P2, therefore down-regulating photosynthesis and the rates of iWUE increase. In combination with the progres-sive saturation of the photosynthesis apparatus, this drying trend might represent an additional contributing factor that triggered the switch to a constant ci/ca(S2) acclimation strategy during P2.
No Unprecedented Growth Despite Increasing iWUE. Given the sig-nificant increase in iWUE, it appears reasonable to expect that white cedars experienced a substantially higher growth since 1850. However, our analysis of ring-width indexes (RWIs) shows that growth during the last 150 y was good, but not unprece-dented at the scale of the last 715 y (Fig. 1B). Indeed, since 1300, at least three periods (early 1400s, 1520s, and mid-1800s) are equivalent in magnitude to the periods of high growth during the late 1980s–early 1990s.
Several studies have reported iWUE increases without appar-ent growth stimulation (13, 32–35). However, most of these studies found only modest average increases in iWUE (20% over the past 40 y) (32), reflecting a constant ci/ca adjustment
(S2). Observed increases in growth that can be attributed to ca
(19) remain scarce and are inconsistently distributed across the Earth’s biomes (32). The same holds for boreal Canada where only few measurements of iWUE are available and tree-ring widths provide little evidence for a positive growth trend that could be interpreted as a CO2 –related stimulation of
photo-synthesis (9, 10, 13). White cedars typically found in mesic and hydric sites around Lake Duparquet even exhibited a notable growth decline during recent decades (36).
Four mechanisms can explain the lack of growth stimulation in a context of increasing iWUE. First, carbon allocation strate-gies might have shifted with time. Indeed, for slow-growing and water-stressed trees such as white cedars, priority in carbon allo-cation might be given to storage components other than the stem (which is used here as a proxy for growth). Under such condi-tions, a greater proportion of photosynthates would be used to produce volatile organic compounds or root exudates instead of above-ground biomass (37). Carbon taken up allocated to biosynthesis may also have been lowered owing to respiratory requirements for acquiring water and nutrients (38, 39). Second, the lack of growth stimulation in a context of increasing iWUE has often been associated to drought stress (13, 17, 33, 35). While we could not find any evidence for a persistent, century-long, dry-ing trend (SI Appendix, Fig. S13), commonality analysis revealed that the RWI is positively (but poorly) related to the summer SMI (total effect <20%;SI Appendix, Fig. S11), implying that lateral growth could be limited when dry conditions prevail (40), especially during P2. Third, a progressive reduction in stomatal density (41) could also result in a rise of iWUE at the stomata scale without significant increase of total photosynthesis at the tree level. Higher CO2 uptake by stomata co-occurring with a
lower number of stomata would lead to carbon gains similar to the ones that prevailed during the preindustrial period. How-ever, there should be a lower limit for stomatal density as scaled leaves need evaporative cooling and efficient CO2 diffusion to
the chloroplasts. Finally, nutrient limitation (42) also needs to be considered as a potential factor limiting growth in these thin-soiled, xeric environments. For example, in similar ecological conditions in southeastern Canada, ref. 43 found that phospho-rus was the main limiting nutrient for slow-growing white cedars (apart from the limited physical space for root penetration in bedrock). An increase in leaf and root (but not trunk) biomass was observed in young white cedar saplings when supplied with additional phosphorus (43).
Our study has important implications for the modeling of vegetation response to atmospheric variability. Most ecophysio-logical and dynamic global vegetation models (DGVMs) predict an increase in plant biomass due to a stimulation of
photo-synthesis by ca (44). Given the results presented here, such
models might overestimate future forest carbon storage capac-ities. Our post-1850 data showed an unprecedented increase in iWUE that coincided with a drop in carbon use efficiency. These results imply that even when a marked stimulation of photosynthesis drove changes in iWUE (at least until 1965), the above-ground biomass did not increase substantially. Therefore, in light of previous findings (32), any assumption that positive stimulation of photosynthesis by CO2 systematically translates
into more carbon storage should be treated with caution. This result has wide-ranging implications for the modeling of climate– carbon feedbacks at the leaf–atmosphere interface and stresses the urgent need for additional research in this area to reduce these uncertainties.
Conclusions
North America’s oldest boreal trees (T. occidentalis L.) exhibited an unprecedented 59% increase in iWUE since the beginning of the Industrial Era, mainly in response to rising atmospheric [CO2] (ca). This response was not constant in time, but a clear
regime shift occurred around 1965, gradually switching the leaf gas-exchange strategy from a constant cito a constant ci/ca
accli-mation. Trees maximized carbon gains between 1850 and 1965 (P1) when the local climate was relatively wet and cold. Con-versely, they reduced vulnerability to drought stress when the local climate became hotter and drier after 1965 (P2), possi-bly also combined with a closer saturation of the photosynthetic apparatus. However, the marked iWUE increase since 1850 did not translate into enhanced stem growth. This implies that other physiological processes such as nutrient availability, changes in carbon allocation strategies, or changes in stomatal density may have offset the growth benefits awarded by the increase in iWUE. Our results thus suggest that even in favorable conditions for growth, not all trees can take advantage of elevated levels of ca and iWUE. These mechanisms are not typically taken into
account by ecophysiological models (45) and DGVMs (44) which may lead to them overestimating any positive effects bestowed by a higher ca on carbon assimilation and fixation. Predictions
of elevated future growth and possible alleviating effects on ca
might be overly optimistic if the models do not allow for the possibility of constant or even reduced growth in the context of increasing ca. It would be advisable to define improved allocation
rules and determine whether those rules can change over time (and with increasing ca). Integrating measurements acquired at
shorter time intervals (daily or weekly resolution) with long times series of tree-ring measurements would further help to track and define those allocation rules in trees exposed to a varying climate and nutrient availability.
SI Appendix. SI Appendixprovides complementary information on methods and results: the regional curve used for regional curve standardization (RCS), quality statistics for the RCS chronology, cohorts selected for δ13
C and δ18
O analysis and their junction, effect of correction methods on δ13
Cchronology, and results for whole-wood and cellulose δ13
Cand δ18
Ovalues comparison.
Materials and Methods
Study Site and Sampling Strategy. Lake Duparquet is located at the
south-ern limit of the boreal forest (48,47◦N, 79,27◦W), in northeastern Canada
(SI Appendix, Fig. S1). Climate is continental, cold, and humid, with a
mean annual temperature of 1◦C and a mean annual total precipitation of
985.2 mm (climate normals for 1981–2010 from Station Mont-Brun, located 12 km south and 42 km east from Duparquet) (46). In 1987, 39 trees were sampled by ref. 40. To extend their ring-width chronology (1186–1987) until 2014, 35 trees, spread across five islands and six peninsulas of Lake
Dupar-quet (SI Appendix, Fig. S1), were resampled in 2012 and 2014 using a 5-mm
PLANT BIOLOGY EARTH, ATMOSPHERIC, AND PLANETARY SCIENCES
first chronology by ref. 40. Trees were measured, cross-dated, and detrended
using the RCS approach (47) (SI Appendix).
Stable Isotope Chronologies. Eleven trees were selected for carbon and oxy-gen stable isotope ratio analysis to cover the maximum time period with
the smallest number of possible cohort changes (SI Appendix, Fig. S4). This
avoids loss of a reliable mean as we go back in time, considering the system-atic offsets typically encountered in the stable isotope analyses of different trees (25, 48, 49). Isotope chronologies have been shown to require few replicates (as little as four) to obtain a strong common signal (expressed population signal ≥0.85) (25). Two cohorts of six (cohort 1: 1620–2014) and
five trees (cohort 2: 1295–1645) were selected, with an overlap of 25 y (SI
Appendix, Fig. S4). The trees selected for stable isotope analysis had dif-ferent ages that were well spread through time. This avoids incorporating
noise due to nonclimatic age effects (SI Appendix, Fig. S4). The first 50 y of
each sample were excluded to avoid any nonclimatic age-related trends (49,
50) (SI Appendix).
δ13C-Derived Physiological Parameters. δ13C variability in tree rings depends on processes by which trees fractionate carbon at the leaf gas-exchange site
(discrimination against13C vs.12C) before fixing it in the stem during the
growing season (25, 51). Carbon fractionation (∆,‰) is expressed as the
difference between δ13C values of atmospheric CO
2(δ13Cair) and tree-ring
δ13C values (δ13C
tree) as shown by Eq. 1 (7):
∆(‰) = δ 13C air− δ13Ctree 1 + δ13Ctree/1,000≈ δ 13 Cair− δ13Ctree. [1]
Carbon fractionation thus occurs in two main steps (52): CO2 diffusion
through stomata (step i ≈−4.4‰; ref. 53) and carboxylation (step ii ≈
−27‰; refs. 25 and 54). However, the overall fractionation is dependent on
the ratio between leaf intercellular (ci) and ambient (ca) CO2concentrations:
∆ ≈ δ13Cair− δ13Ctree=a + (b − a)
ci ca
. [2]
Records of δ13C
airand caobtained from Antarctic ice cores by ref. 55 were
linearly interpolated until 1295. From 1850 to 2003, values from ref. 25 were used (following refs. 2, 4, and 55) and linearly interpolated until 2014.
Based on plant physiology theory and models, physiological parameters
can be derived from tree-ring δ13C values. c
iis calculated from Eq. 2,
pro-vided that all other variables are known. iWUE, a measure of the amount of carbon assimilated per unit leaf area per unit time per unit cost of water, is calculated as (18)
iWUE = A
gs
=ca− ci
1.6 . [3]
According to Eq. 3, the difference between ca and ci is proportional to
iWUE and reflects the balance between the rate of CO2assimilation (A) and
stomatal conductance (gs).
For each of the three theoretical scenarios of leaf–gas strategy (7), the
δ13C response to cais shown in Fig. 2 (main text). This was achieved by fixing
ciaccordingly, using Eq. 3. Scenarios start in 1850, at the beginning of the
industrial period, and exhibit a linear response to caincreases and assume
a negligible ciresponse to climate variability. The cipreindustrial level was
150 ppm (the 1295–1850 mean).
Dendroclimatic Analyses. Daily weather data (1901–2014 maximum and minimum temperatures) and precipitation (1901–2014 sum) and VPD (1953–2014) were retrieved from BioSIM v.10, which interpolates site-specific estimates from historical weather observations (56) as described in ref. 57. The quantity of available soil moisture was estimated for each month using the quadratic + linear (QL) formulation procedure described in ref. 58, which accounts for water loss through evapotran-spiration (simplified Penman–Monteith potential evapotranevapotran-spiration) and gain from precipitation. Parameter values for maximum and critical avail-able soil water were set at 300 mm and 400 mm, respectively; the number of weather stations for interpolation was set to eight. We used
values of annual mean ca recorded at Mauna Loa observatory since
1958 (59); the data were extended to 1901 using estimates from ice cores (60).
Commonality analysis (61) was used to explore the climate effects of
ca and climate predictors on iWUE, δ18O, and RWI. With a commonality
analysis, one seeks to decompose linear regression R2into its unique and
common effects. Unique effects indicate how much variance is uniquely accounted for by a single variable, taken as a single predictor. Common effects indicate how much variance is common to a set of predictors. Total effects refer to the combination of unique and common effects and describe the explanatory power of a predictor, summing up all common-alities. Commonality analysis is particularly useful to estimate effects in the presence of multicollinearity in a predictor dataset. For each anal-ysis, we show regression beta weights, unique effects, common effects,
and total effects for each variable, as well as R2 values for the whole
regression model. For simplicity, we chose to use a limited set of predic-tor variables: May–August (growing season) temperatures (T), SMIs, and VPDs. We performed the commonality analysis iteratively; i.e., the data were passed several times through a high-pass filter which led to incre-mental degradation of the original iWUE variable, as each pass removed a bigger part of the low frequencies. Hence, at the beginning of the loop iWUE contained all frequencies from 0 ≤ f ≤ 0.5 y−1(cycle lengths between
∞and 2 y) while at the end of the iteration iWUE was degraded to a
perfectly detrended seesaw signal with f = 0.5 y−1 (cycle length = 2 y).
The iterative degradation of the original iWUE signal coupled to the commonality analysis allowed us to pinpoint those frequencies above or
below which ca and climate had a dominant influence on iWUE, δ18O,
and RWI.
ACKNOWLEDGMENTS. We acknowledge the contribution of many people who helped with field and laboratory work: A. Barbe, G. Proulx, P. Leclerc, M. Gratton, and A. Adamowicz-Walczak. We thank the Natural Sciences and Engineering Research Council (NSERC) and Her Majesty The Queen in due right of Canada. C.G.-C. acknowledges financial support from both NSERC and Fonds de Recherche Qu ´eb ´ecois Nature et Technologies for her master’s thesis.
1. Robertson A, et al. (2001) Hypothesized climate forcing time series for the last 500 years. J Geophys Res Atmos 106:14783–14803.
2. L ¨uthi D, et al. (2008) High-resolution carbon dioxide concentration record 650,000– 800,000 years before present. Nature 453:379–382.
3. Petit JR, et al. (1999) Climate and atmospheric history of the past 420,000 years from the Vostok ice core, Antarctica. Nature 399:429–436.
4. Keenan TF, et al. (2013) Increase in forest water-use efficiency as atmospheric carbon dioxide concentrations rise. Nature 499:324–327.
5. Voelker SL, et al. (2016) A dynamic leaf gas-exchange strategy is conserved in woody plants under changing ambient CO2: Evidence from carbon isotope dis-crimination in paleo and CO2 enrichment studies. Glob Change Biol 22:889– 902.
6. Ehleringer JR, Cerling TE (1995) Atmospheric CO2 and the ratio of intercellular to ambient CO2 concentrations in plants. Tree Physiol 15:105–111.
7. Saurer M, Siegwolf RT, Schweingruber FH (2004) Carbon isotope discrimination indi-cates improving water-use efficiency of trees in northern Eurasia over the last 100 years. Glob Change Biol 10:2109–2120.
8. Battipaglia G, et al. (2013) Elevated CO2 increases tree-level intrinsic water use effi-ciency: Insights from carbon and oxygen isotope analyses in tree rings across three forest face sites. New Phytol 197:544–554.
9. Gedalof Z, Berg AA (2010) Tree ring evidence for limited direct CO2 fertilization of forests over the 20th century. Glob Biogeochem Cycles 24:GB3027.
10. Girardin MP, et al. (2016) No growth stimulation of Canada’s boreal forest under half-century of combined warming and CO2 fertilization. Proc Natl Acad Sci USA 113:E8406–E8414.
11. Girardin MP, et al. (2016) Negative impacts of high temperatures on growth of black spruce forests intensify with the anticipated climate warming. Glob Change Biol 22:627–643.
12. Silva LC, Anand M, Leithead MD (2010) Recent widespread tree growth decline despite increasing atmospheric CO2. PloS one 5:e11543.
13. Silva LC, Horwath WR (2013) Explaining global increases in water use efficiency: Why have we overestimated responses to rising atmospheric CO2 in natural forest ecosystems? PLoS One 8:e53089.
14. Frank D, et al. (2015) Water-use efficiency and transpiration across European forests during the Anthropocene. Nat Clim Change 5:579–583.
15. Brienen RJ, Lebrija-Trejos E, Zuidema P, Martinez-Ramos M (2010) Climate-growth analysis for a Mexican dry forest tree shows strong impact of sea surface temperatures and predicts future growth declines. Glob Change Biol 16:2001– 2012.
16. G ´omez-Guerrero A, et al. (2013) Growth decline and divergent tree ring isotopic com-position (δ13C and δ18O) contradict predictions of CO2 stimulation in high altitudinal forests. Glob Change Biol 19:1748–1758.
17. Saurer M, et al. (2014) Spatial variability and temporal trends in water-use efficiency of European forests. Glob Change Biol 20:3700–3712.
18. Ehleringer JR (1993) Carbon and water relations in desert plants: An isotopic perspec-tive. Stable Isotopes and Plant Carbon-Water Relations, eds Ehleringer JR, Hall AE, Farquhar GD (Elsevier, San Diego), pp 155–172.
19. Huang R, et al. (2017) Does increasing intrinsic water use efficiency (iWUE) stimulate tree growth at natural alpine timberline on the southeastern Tibetan plateau? Glob
20. Waterhouse JS, et al. (2004) Northern European trees show a progressively diminish-ing response to increasdiminish-ing atmospheric carbon dioxide concentrations. Quat Sci Rev 23:803–810.
21. Scheidegger Y, Saurer M, Bahn M, Siegwolf R (2000) Linking stable oxygen and car-bon isotopes with stomatal conductance and photosynthetic capacity: A conceptual model. Oecologia 125:350–357.
22. Yakir D (1992) Variations in the natural abundance of oxygen-18 and deuterium in plant carbohydrates. Plant Cell Environ 15:1005–1020.
23. Roden JS, Ehleringer JR (1999) Hydrogen and oxygen isotope ratios of tree-ring cellulose for riparian trees grown long-term under hydroponically controlled environments. Oecologia 121:467–477.
24. Barbour MM (2007) Stable oxygen isotope composition of plant tissue: A review.
Funct Plant Biol 34:83–94.
25. McCarroll D, Loader NJ (2004) Stable isotopes in tree rings. Quat Sci Rev 23:771– 801.
26. Maxwell TM, Silva LCR, Horwath WR (2018) Integrating effects of species composition and soil properties to predict shifts in montane forest carbon–water relations. Proc
Natl Acad Sci USA 115:E4219-E4226.
27. Farquhar GD, Sharkey TD (1982) Stomatal conductance and photosynthesis. Annu Rev
Plant Physiol 33:317–345.
28. Girardin MP, et al. (2013) Fire in managed forests of eastern Canada: Risks and options. For Ecol Manage 294:238–249.
29. Drobyshev I, et al. (2017) Strong gradients in forest sensitivity to climate change revealed by dynamics of forest fire cycles in the post Little Ice Age era. J Geophys
Res Biogeosci 122:2605–2616.
30. Denneler B, Asselin H, Bergeron Y, Begin Y (2008) Decreased fire frequency and increased water levels affect riparian forest dynamics in southwestern boreal Quebec, Canada. Can J For Res 38:1083–1094.
31. Tardif J, Bergeron Y (1997) Ice-flood history reconstructed with tree-rings from the southern boreal forest limit, western Qu ´ebec. Holocene 7:291–300.
32. Pe ˜nuelas J, Canadell JG, Ogaya R (2011) Increased water-use efficiency during the 20th century did not translate into enhanced tree growth. Glob Ecol Biogeogr 20:597–608.
33. Dietrich R, et al. (2016) Climatic sensitivity, water-use efficiency, and growth decline in boreal jack pine (Pinus banksiana) forests in Northern Ontario. J Geophys Res
Biogeosci 121:2761–2774.
34. L ´evesque M, Siegwolf R, Saurer M, Eilmann B, Rigling A (2014) Increased water-use efficiency does not lead to enhanced tree growth under xeric and mesic conditions.
New Phytol 203:94–109.
35. Andreu-Hayles L, et al. (2011) Long tree-ring chronologies reveal 20th century increases in water-use efficiency but no enhancement of tree growth at five Iberian pine forests. Glob Change Biol 17:2095–2112.
36. Housset JM, Girardin MP, Baconnet M, Carcaillet C, Bergeron Y (2015) Unexpected warming-induced growth decline in Thuja occidentalis at its northern limits in North America. J Biogeogr 42:1233–1245.
37. Vicca S, et al. (2012) Fertile forests produce biomass more efficiently. Ecol Lett 15:520– 526.
38. Manzoni S, et al. (2018) Reviews and syntheses: Carbon use efficiency from organisms to ecosystems–definitions, theories, and empirical evidence. Biogeosciences 15:5929– 5949.
39. Delucia E, Drake J, Thomas R, Gonzalez-Meler M (2007) Forest carbon use efficiency: Is respiration a constant fraction of gross primary production? Glob Change Biol 13:1157–1167.
40. Archambault S, Bergeron Y (1992) An 802-year tree-ring chronology from the Quebec boreal forest. Can J For Res 22:674–682.
41. Lake J, Quick W, Beerling DJ, Woodward FI (2001) Plant development: Signals from mature to new leaves. Nature 411:154.
42. Norby RJ, Warren JM, Iversen CM, Medlyn BE, McMurtrie RE (2010) CO2 enhancement of forest productivity constrained by limited nitrogen availability. Proc Natl Acad Sci
USA 107:19368–19373.
43. Matthes-Sears U, Nash CH, Larson DW (1995) Constrained growth of trees in a hostile environment: The role of water and nutrient availability for Thuja occidentalis on cliff faces. Int J Plant Sci 156:311–319.
44. Sitch S, et al. (2008) Evaluation of the terrestrial carbon cycle, future plant geogra-phy and climate-carbon cycle feedbacks using five dynamic global vegetation models (DGVMs). Glob Change Biol 14:2015–2039.
45. Guiot J, Boucher E, Gea-Izquierdo G (2014) Process models and model-data fusion in dendroecology. Front Ecol Evol 2:52.
46. Government of Canada (2016) Canadian climate normals 1981-2010. Available at climate.weather.gc.ca/climate normals/index e.html. Accessed April 25, 2017. 47. Esper J, Cook ER, Krusic PJ, Peters K, Schweingruber FH (2003) Tests of the RCS method
for preserving low-frequency variability in long tree-ring chronologies. Tree Ring Res 59:81–98.
48. Gagen M, et al. (2012) A rapid method for the production of robust millennial length stable isotope tree ring series for climate reconstruction. Glob Planet Change 82:96– 103.
49. Labuhn I, et al. (2014) Tree age, site and climate controls on tree ring cellulose δ18O: A case study on oak trees from south-western France. Dendrochronologia 32:78–89. 50. Young GH, et al. (2011) Age trends in tree ring growth and isotopic archives: A
case study of Pinus sylvestris L. from northwestern Norway. Glob Biogeochem Cycles 25:GB2020.
51. Gessler A, et al. (2014) Stable isotopes in tree rings: Towards a mechanistic under-standing of isotope fractionation and mixing processes from the leaves to the wood.
Tree Physiol 34:796–818.
52. Farquhar GD, O’Leary MH, Berry JA (1982) On the relationship between carbon iso-tope discrimination and the intercellular carbon dioxide concentration in leaves.
Funct Plant Biol 9:121–137.
53. O’Leary MH (1981) Carbon isotope fractionation in plants. Phytochemistry 20:553– 567.
54. Farquhar G, Richards R (1984) Isotopic composition of plant carbon correlates with water-use efficiency of wheat genotypes. Funct Plant Biol 11:539–552.
55. Francey R, et al. (1999) A 1000-year high precision record of δ13C in atmospheric CO2.
Tellus B 51:170–193.
56. Environment Canada (2013) National climate data and information archive. Available at climate.weatheroffice.gc.ca/. Accessed April 25, 2017.
57. R ´egni `ere J, Bolstad P (1994) Statistical simulation of daily air temperature pat-terns eastern North America to forecast seasonal events in insect pest management.
Environ Entomol 23:1368–1380.
58. Hogg E, Barr A, Black T (2013) A simple soil moisture index for representing multi-year drought impacts on aspen productivity in the western Canadian interior. Agric
For Meteorol 178:173–182.
59. Keeling CD, et al. (2001) Exchanges of atmospheric CO2 and 13CO2 with the terres-trial biosphere and oceans from 1978 to 2000: I. Global aspects (Scripps Institution of Oceanography, San Diego), SIO Reference Series, No. 01-06.
60. Etheridge DM, et al. (1996) Natural and anthropogenic changes in atmospheric CO2 over the last 1000 years from air in Antarctic ice and firn. J Geophys Res Atmos 101:4115–4128.
61. Ray-Mukherjee J, et al. (2014) Using commonality analysis in multiple regressions: A tool to decompose regression effects in the face of multicollinearity. Methods Ecol
Correction
PLANT BIOLOGY, EARTH, ATMOSPHERIC, AND PLANETARY SCIENCES
Correction for “North America’s oldest boreal trees are more efficient water users due to increased [CO2], but do not grow
faster,” by Claudie Giguère-Croteau, Étienne Boucher, Yves Bergeron, Martin P. Girardin, Igor Drobyshev, Lucas C. R. Silva, Jean-François Hélie, and Michelle Garneau, which was first published January 28, 2019; 10.1073/pnas.1816686116 (Proc Natl Acad Sci USA 116:2749–2754).
The authors note that an additional affiliation should be listed for Igor Drobyshev. The new affiliation should appear as Swedish University of Agricultural Sciences, Southern Swedish Forest Research Centre, SE-230 53 Alnarp, Sweden. The cor-rected author and affiliation lines appear below. The online version has been corrected.
Claudie Giguère-Croteaua,b,c, Étienne Boucherb,d,e,
Yves Bergerona,c,f, Martin P. Girarding, Igor
Drobyshevc,f,h, Lucas C. R. Silvai, Jean-François Hélieb,j,
and Michelle Garneaub,d,e
aDepartment of Biology, Université du Québec à Montréal, Montréal, QC
H2X 1Y4, Canada;bGEOTOP, Université du Québec à Montréal, Montréal, QC
H2X 1Y4, Canada;cCentre d’Études sur la Forêt, Université du Québec à
Montréal, Montréal, QC H2X 1Y4, Canada;dDepartment of Geography,
Université du Québec à Montréal, Montréal, QC H2X 3R9, Canada;eCentre
d’Études Nordiques, Université Laval, Québec, QC G1V 0A6, Canada;fInstitut
de Recherche sur les Forêts, Université du Québec en Abitibi-Témiscamingue,
Rouyn-Noranda, QC J9X 5E4, Canada;gCentre de Foresterie des Laurentides,
Ressources Naturelles Canada, Sainte-Foy, QC G1V 4C7, Canada;hSwedish
University of Agricultural Sciences, Southern Swedish Forest Research
Centre, SE-230 53 Alnarp, Sweden;iEnvironmental Studies Program,
Department of Geography, Institute of Ecology and Evolution, University of
Oregon, Eugene, OR 97403; andjDepartment of Earth and Atmosphere
Sciences, Université du Québec à Montréal, Montréal, QC H2X 3Y7, Canada
Published under thePNAS license. Published online February 25, 2019.