Landscape Research. Accepted paper. In press.
Characterizing the morphology of suburban settlements: a method based on a semi-‐ automatic classification of building clusters.
Fabian de Smet (*), Jacques Teller (LEMA ULg)
(*) Lepur Université de Liège. Centre de Recherche sur la Ville, le Territoire et le milieu Rural. (**) Local Environment Management and Analysis. University of Liège
Keywords: suburban settlements, landscape structures, building clusters, semi-‐automatic classification
Abstract: Urban sprawl is transforming our landscapes and rural areas at a spectacular pace. Measuring the strength of the phenomenon and proposing dynamic ways to delineate suburban areas have been the object of much debate amongst scientists. The present article takes the view that, beyond measuring and delineating suburban areas, more efforts should be directed to qualifying the morphology of built settlements within these areas. Therefore it proposes a method based on a semi-‐automatic classification system of building clusters, designed to describe and interpret the phenomenon from a morphological perspective. This method is based on a combination of field surveys with numerical analyses of digital land cadastre maps. The application of this classification system to the suburban area around Liege reveals that, far from developing in a complete indifference of local conditions, contemporary suburban settlements are influenced by landscape structures inherited from the past.
1. Introduction
Urban sprawl has been defined by the European Environment Agency as the « physical pattern of low-‐density expansion of large urban areas, under market conditions, mainly into the surrounding agricultural areas » (E.E.A., 2006: 6). Containing sprawl is an objective of numerous land use policies and a subject of intense debate about the future of cities and the countryside (Chalas, 1997; Couch, 2007; EEA 2006; Espon, 2004; Pinol, 2000). This massive
of territories and cities; though its impact on our landscapes has been very profound both from a quantitative and a qualitative point of view.
The notion of urban sprawl is commonly used to both describe the actual process of urbanization affecting suburban areas and its materialization through modifications of natural landscapes and built structures (Chin, 2002; Couch, 2007; Le Jeannic, 1997; Mangin, 2004; Potier, 2007). A specificity of urban sprawl is the fast urbanization of sites partly occupied, located at the outskirts of towns. Villages and small cities located in the periphery of large cities were gradually integrated in the urbanization of larger areas. This process implies a layering of formal characters of existing villages and recent urbanization patterns. As a result, in many suburban areas, traces of various types of habitat and agricultural areas are still present. These areas can be described as a patchwork, combining traditional rural villages, encompassed by fields, meadows or pastures, with recent low density housing ensembles, commercial areas and economic estates.
Accordingly suburban areas have often been termed as a kind of intermediate reality, combining both rural and urban characteristics (Roux, 1997; Secchi, 2006; Sieverts, 2004). The main attribute of suburban areas would then lie in the presence of severe formal and functional discontinuities, both within and between these areas. These areas are hence usually considered as “detached” from the territory they belong to, especially by those who consider they are characteristic of a form of homogenisation and blurring of European landscape diversity (Bessy-‐Pietri & Sicamois, 2001; EEA, 2006; Piron, 2004).
It is hereby considered that urban sprawl produces specific built-‐up patterns, which may be characteristic of a given place, even though these patterns are acknowledged to be different from traditional ones, may these be villages or dense urban settlements. Analysing the structure and diversity of these built-‐up patterns may require specific methods, that somehow departs from those applied to continuous urban forms on the one hand and dispersed rural settlements on the other hand. This will be the core issue addressed by this research paper. We hence propose to develop a characterization method for analyzing suburban settlements. This method is based on a set of four geometric descriptors applied
field surveys with numerical analyses of digital land cadastre maps. It has been calibrated and validated on the suburban area surrounding the city of Liege (Belgium).
The next section introduces existing analysis methods for measuring and categorizing urban sprawl. By comparison with these approaches our concern is specifically related to characterizing the morphology of suburban settlements. The approach followed to progressively build and calibrate this characterization system is presented in section 3. It is based on a three-‐steps process. In the first step, traditional field survey techniques are applied to suburban settlements in order to elicit different types of building clusters on a qualitative basis (section 4). A set of four descriptors is derived from this typology in order to develop a semi-‐automatic classification system of suburban building clusters (section 5). Finally the proposed classification system is applied to the entire suburban area of Liege (Belgium). The results of this test are presented and discussed in section 6. Section 7 presents the conclusions of our work and considers its application to other suburban areas.
2. Morphological analysis of suburban areas
To date, morphological analysis of suburban areas has largely been focused on measuring the strength of urban sprawl and defining the limits of suburban areas. Such measures of sprawl can usefully be contrasted with other indicators related to transport, land use or socio-‐economic characteristics. The measures can be further mobilized for monitoring the impact of land use and urban policies in the long term. They also enable comparisons between different cities or urban regions (Arribas-‐Bel & al., 2011; Bhatta & al., 2010; Herold & al., 2002; Huang & al., 2007; Kasanko & al., 2006; Poelmans & Van Rompaey, 2009; Schneider & Woodcock, 2008; Schwarz, 2010). Comparisons are commonly used to classify cities and their suburban areas according to criteria such as density, built-‐up areas, amount of land taken over by urban sprawl etc.
Different methods and measures have been proposed in the literature for measuring sprawl (Arribas-‐Bel & al., 2011; Bhatta & al. 2010; Jaeger & al., 2010b; Schneider & Woodcock,
urban sprawl mostly depends on the thematic approach that is pursued. Some authors proceed by identifying similarities with known cases; others focus on aesthetic judgement or functional characteristics such as mobility, residential density, city’s attractiveness, environmental or socio-‐economic issues, for instance (Chin, 2002; Frenkel & Ashkenazi, 2008; Galster & al., 2001). Analysing urban sprawl requires data describing the state of a suburban area at a particular time. “If sprawl is to be a useful concept for describing something that occurs in urban areas, it must be first reduced to some objective conditions or traits” (Galster & al., 2001: 685). As Davis and Schaub state, “it is clear that each metric reveals a different dimension of urban sprawl and is necessarily subject to various limitations” (Davis & Schaub, 2005). Ban and Ahlqvist (2009) proposed the application of fuzzy set theories to the delineation of suburban spaces.
An objective of morphological characterization of suburban areas is the identification of morphological features or, more specifically, the definition of homogeneous spatial sets within a study area.
Satellite images can be used to characterize the evolution of urbanization within a territory. A first level of analysis consists of distinguishing built-‐up and non-‐built land (Poelmans & Van Rompaey, 2009). Other studies have integrated more data in order to reach a finer classification system. The presence and characteristics of vegetation cover are commonly used to distinguish different types of suburban areas (Eberhard, 1995; Terrettaz & Collet, 1995). Morphological analysis by remote sensing seems relevant to the land cover characterization of an area. However when it comes to refining those results, characterization is much more difficult. It is necessary to take into account new data, which makes the classification process even more complex. Moreover local characteristics may influence the results of a general classification method.
Fractal geometry is another approach to characterizing urban and suburban areas. It allows the delineation of large morphological entities using significant contrasts in fractal indices (Batty, 2005; Thomas & al., 2008). The approach allows a comparison and classification of different types of structure at different scales. Once fractal indices are calculated,
identification of boundaries between rural and urban areas. They concluded that a morphological boundary between town and country could be defined through fractal analysis. Badariotti studied a range of particular urban fabric types he selected to see how fractal measures could account for their specific features (Badariotti, 2005).
With respect to existing studies, the object of our research is focused on the characterization of the built settlements located within suburban areas. The delineation of urban and suburban areas are taken as an input into our analysis. The objective here is to identify specific patterns that may help to better describe, qualify and interpret the inner morphology of these areas.
3. General methodology and study area
Our classification method was designed and tested on an application to the suburban area of Liege in Belgium. It is worth underlining that Belgium is one of the most urbanized countries in Europe: more than 20% of the land is urbanized and the rhythm of sprawl has been very sustained over the past few decades. The mutation of agricultural land to urbanized land is evaluated as being 899 km2 between 1834 and 1980, and as 1156 km2 in the period from 1980 to 1999 alone (INS). In Wallonia a random sampling of housing, established on a cadastral database estimated that around one in five houses is currently located on the peripheries of urban centres (Carlier & al., 2007). In terms of suburban population, this finding is also quite meaningful. Halleux (2005) identified that between 1971 and 2001, suburban municipalities experienced a significant level of residential development with a 22.6% increase in their population. The density of infrastructures combined with a loose legal planning framework is probably a key element in explaining the strength of sprawl in Belgium (Halleux, 2012).
The definition of our case study is based on an existing delineation of urban agglomerations, suburban areas and commute-‐areas in the whole of Belgium (Luyten & Van Hecke, 2007; Sporck & al., 1985). The delineation of these areas (Figure 1) combines morphological and
Figure 1: Delineation of urban agglomerations, suburban areas and commute-‐areas following Luyten and Van Hecke (2007)
The continuity of the built fabric is the main criterion for delineating urban agglomerations in the method developed by Luyten and Van Hecke. This continuity is satisfied when, in a group of buildings, any building is at a distance of no more than 200 metres from its nearest building (Van Hecke & al., 2009: 13). In Luyten and Van Hecke (2009), the delimitation of suburban areas uses seven weighted criteria. The first criterion is a characterization of demographic trends, through a comparison between the population growth during a particular period and the share of immigration from the agglomeration. The second criterion is related to income levels. The next three criteria are related to mobility factors. The last criterion is related to a quantification of the speed of urbanization. It is assessed through the increase of the built area in the municipality compared to that of the agglomeration as a whole. The delineation of the commute-‐area is exclusively determined through functional criteria, namely the share of the population commuting every day into the agglomeration.
Within this research we focused on the suburban area around the city of Liege (Figure 1). It has been considered that the commute-‐area stays largely rural in its form and landscape. Accordingly this area was not included in the scope of our analysis.
Our method for characterizing suburban settlements is based on a semi-‐automatic classification of building clusters. A building cluster is defined here as a set of buildings that share architectural characteristics and a given layout. These clusters may be described according to different scales and attributes. The methodology adopted to detect and classify these clusters is based on a combination of qualitative observations and quantitative measures, following three successive steps.
The first step consisted in developing an exploratory typology of building clusters. This typology was built upon a qualitative visual analysis of building clusters in four small villages around the city of Liege (Belgium). The second step brought methodological adaptations to develop our first qualitative observations into a semi-‐automatic classification of building clusters. We therefore selected a sample of 47 building clusters within a town located at about 25 km from the city centre of Liege, in its suburban area. These 47 building clusters were classified according to 7 types. We then tested a series of morphological descriptors such as building geometry, the built density and road network features on this set of clusters. Quantitative and qualitative results were compared in order to develop a semi-‐ automatic classification system, based on these descriptors and fixed thresholds. In the third and final stage, we adapted our method to analyse and characterize the entire suburban area around Liege. The morphological descriptors and thresholds elaborated during the second step were calibrated and validated against field surveys in order to obtain a semi-‐ automatic classification of building clusters.
All geometric descriptors are calculated on land cadastre maps. These maps are available in GIS format for the entire territory of the Walloon Region. They include all parcel limits and building footprints in a two-‐dimensional vector format and can hence readily be used for geometrical and topological analyses.
4. Exploratory analysis
The exploratory stage of the study consisted of eliciting the formal characteristics of four villages located in the suburban area of Liege. Based on field observations, supplemented by work on maps, we proposed a clustering of buildings according to their architectural and urban features. We then developed a typology whose aim is to look at building clusters rather than at individual buildings. The most discriminative features appeared to be the joint ownership of buildings, building height, the formal aspect of a building’s facade and the type of building use (residential vs. commercial).
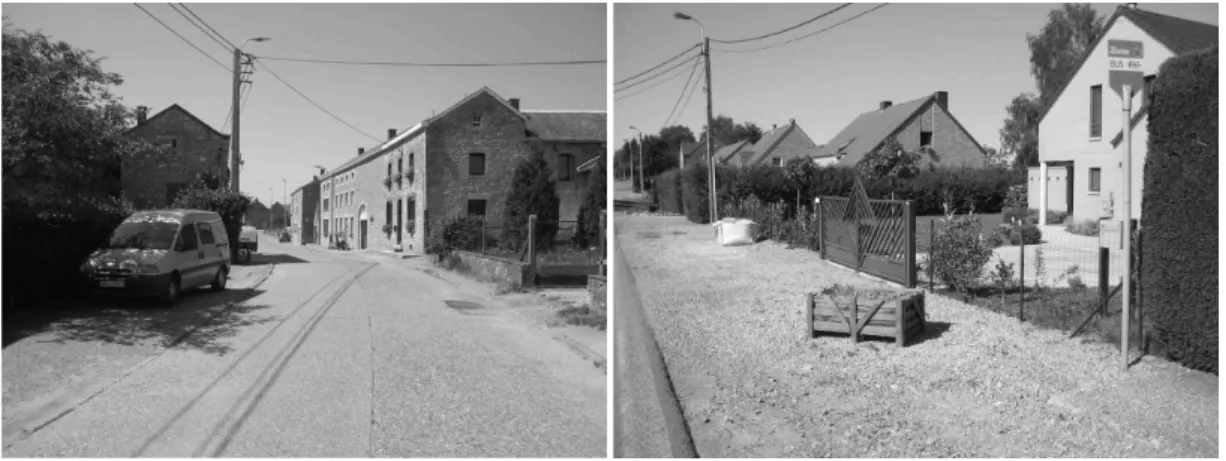
We first grouped buildings with similar architectural and urban characteristics. Those groups formed what we called “homogeneous building clusters”. Five types of homogeneous building cluster were identified (E1 to E5), respectively, historic rural cores (E1), ancient rural extensions (E2), semi-‐terraced buildings (E3), detached high buildings or pavilions (E4) and, finally, detached low buildings, often described as typical suburban housing (E5). Quite typically, building clusters of types 4 and 5 generate a public space characterized by large spatial openings. This is mainly due to the lateral distances between buildings, which may open up views to the landscape behind buildings. Additionally the distance between buildings and the public space is rather large in those types of configuration (Figure 2).
Figure 2: Examples of type E1 (left) and E5 (right) building clusters
Some buildings could not be grouped according to this typology because of their spatial isolation or their formal characteristics. We identified three types of isolated building: high
detached buildings (I1), low detached buildings (I2) and specific buildings (I3) such as churches, castles, isolated farms or chapels.
Finally, apart from homogeneous building clusters and isolated buildings, we identified heterogeneous building clusters. We divided this last type into two sub-‐types in order to identify clusters mainly oriented towards residential functions (H1) as distinct from those mainly oriented towards commercial functions (H2).
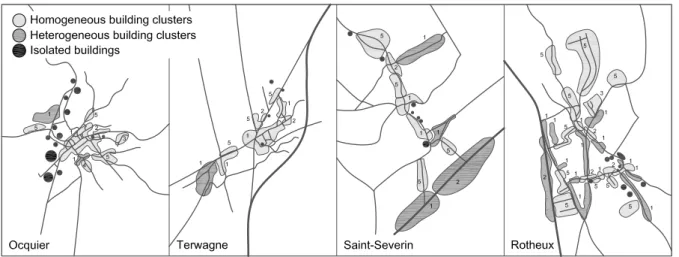
Figure 3: Qualitative typology of building clusters in four villages near Liege
Figure 3 shows the distributions of the different types of building cluster in the four villages. The presence of historic rural cores (type E1, medium grey-‐number 1) can be observed, as can large groups of detached houses (type E5, medium grey-‐number 5) and heterogeneous building clusters with residential functions (type H1, dark grey-‐number 1). These four villages were ordered, from left to right, according to a decreasing distance from the city centre. It can be observed how they have been increasingly affected by sprawl through the overall size of the village and the ratio between the grey clusters and the other clusters. In the last village on the right, traditional rural cores almost vanish amongst new developments, especially suburban housing clusters (E5). Heterogeneous building clusters oriented towards commercial functions (H1) dominate all entrances to the village.
5. Semi-‐automatic classification of building clusters
A typology of building clusters based on a quantification of geometric and typological characteristics is proposed. The different building cluster types classified in this typology are shown in Table 1. These types do not match exactly with the ones identified in the qualitative analysis of the four villages presented above. They are the result of a process of successive calibrations of threshold values and of typological classification.
Type 1 Type 2 Type 3 Type 4 Type 5 Type 6
Type 7 Type 8 -‐ rejection Table 1: Building cluster types
Seven types of building cluster were identified. The first type relates to heterogeneous clusters of terraced buildings. These are mainly historic rural cores. The second type involves homogeneous clusters of terraced buildings. It includes social housing as well as working class terraced houses typical of industrial housing. The third type includes clusters of buildings including terraced and detached buildings. The fourth type is related to heterogeneous clusters of detached buildings. This is the product of a mix of residential and commercial functions or building clusters consisting of detached houses with very different ground areas. The fifth type of building cluster consists of homogeneous detached houses. This is often considered as the archetype of suburban, repetitive housing. The sixth type consists of building clusters with a very low built density. These usually consist of isolated buildings located away from central locations. The seventh type of building cluster includes buildings with a very large floor area. This last type is related to business or industrial buildings.
The morphological descriptors we used were as follows: the coefficient of joint ownership of buildings, the coefficient of variance of the floor surface of the building, the built density and the ellipse of dispersion of buildings. Each of these descriptors is defined below.
These descriptors are calculated on windows of observation that define the building-‐ polygons to be taken into account. A building-‐polygon corresponds to the set of points delineating the footprint of a building on a land cadastre map; building clusters are sets of such building-‐polygons. The main question concerning windows of observation was their optimal size. Three window sizes were tested to determine which was the best to identify consistent building clusters. We therefore assessed the validity of square windows with a 400, 300 and 200 m side. Because of their size, 400 m side and 300 m side squares made it more difficult to identify coherent building clusters. On the other hand, the 200 m side square allowed the selection and ranking of almost all the urban types identified previously and therefore 200 m sided windows were used in this study.
5.1. Definition of morphological descriptors used
5.1.1. Coefficient of joint ownership of buildings (Ev)
This descriptor assesses the degree of joint ownership of a group of buildings. Its calculation is based on changes in the number of building-‐polygons (BP) before and after merging adjacent polygons (equation 1). Its objective is to distinguish clusters of buildings mainly composed of detached buildings from those mainly composed of terraced buildings. It also identifies groups of buildings that mix these two types of building when none of those significantly dominates the other.
€
Ev.nb
= BP
nb.before _ merging
− BPnb.merged
BPnb.before _ merging [eq. 1]
Quite typically, historical rural cores (type 1) and social housing building clusters (type 2) will be characterized by a higher number of terraced buildings than the average of other suburban building clusters.
5.1.2. Homogeneity of floor sizes of buildings (Cv)
This descriptor aims to assess the homogenous or heterogeneous nature of the floor size of buildings. A set of buildings is homogenous when it is formed by a repetition of elements more or less equal in terms of floor size.
To calculate this descriptor we use the mean and the standard variation of the building polygon areas in each window (equation 2). The coefficient of variation (CV) expresses the relative dispersion of a set of values around their mean. This coefficient provides comparable values, regardless of sample size or amplitude of the observed values.
Cv =
St._ deviationmerged
Meanmerged [eq. 2]
High heterogeneity is linked either to historical rural cores (type 1) or to building clusters characterized by a stratification of various architectural styles (type 4). This stratification is quite common in those low-‐density building clusters that have progressively densified over time. Where there is no restructuring of the built fabric, buildings remain detached in those configurations and there is a wide variation in floor size. On the other hand, social housing projects (type 2) and contemporary suburban housing estates (type 5) will be characterized by a high homogeneity.
5.1.3. Built density (Dwindow and nb)
This descriptor evaluates the built density in each window of observation. It sorts densely built windows from those with a low rate of urbanization. Two descriptors are proposed to evaluate the built density: the total surface of all buildings divided by the surface of the window (Dwindow) and the number of buildings per window (nb). The built density in terms of built area is calculated according to equation 3. The number of buildings simply consists of a count of all buildings in a window, before merging adjacent buildings.
€
Dwindow = Area.
All _ buildings
Area.Window [eq. 3]
These two descriptors are used to identify and discriminate very low built density clusters (type 6) and large building clusters (type 7). Low built density clusters are characteristic of remote suburban areas as well as of highly dispersed areas; this is typically the case in those areas where suburbanization is related to individual household decision-‐making processes rather than grouped housing development projects. Large building clusters are characteristic of commercial or industrial estates, which include a small number of very large buildings.
5.1.4. Ellipse of dispersion centre and its eccentricity (e)
This descriptor defines the spatial distribution of a group of polygons according to the position of their centre of gravity and surface. The standard deviation of X and Y distances measured from the centre of the window to the centre of each polygon defines the radii of the ellipse of dispersion and orientation. In our case, the radii of the ellipse are equivalent to one unit of standard deviation in X and Y. The resulting ellipse encompasses about 68% of the set of polygons in each observation window.
[eq. 4]
The centre of the ellipse of dispersion gives a topological centre to a set of buildings in a window, while its elongation, ‘e’, also called eccentricity, (equation 4) assesses the orientation of the polygons. The elongation, e, was used in the exploratory stage of research to identify ribbon-‐like building clusters, typical of suburban development in Belgium. In a later stage of our research, this measure was discarded as a classifier of building clusters. The centre of the ellipse of dispersion was still used to discriminate those building clusters that were not properly centred on windows (type 8).
5.2. Calibration and validation of thresholds
Before analysing the entire suburban area of Liege, a validation study was conducted to test the possibility of discriminating building clusters on the basis of the proposed descriptors being applied to 2D cadastral maps. The validation procedure was organized into two steps: firstly, in relation to a given municipality and then in relation to the entire suburban area of Liege.
A first test was performed on one of the municipalities (Neupré) located within the suburban area of Liege. This area is characterized by a large variety of building clusters. A set of 47 sites framed by windows of observations was selected manually within the municipality. Two
selected windows based on field and map observations. The second was based on the calculation of geometric and topological descriptors presented above. From these quantitative values, we defined thresholds for each descriptor. We then developed a classification tree to sort windows according to different types of building cluster. Afterwards we compared the qualitative and the quantitative results. This classification tree enabled the matching of qualitative and quantitative classifications for more than 85% of the 47 cases.
Analysing a small territory allows the manual selection of windows of observation (one by one). When analysing a larger territory, such a manual selection is much more time-‐ consuming. Moreover the manual and qualitative selection of observation windows constitutes a possible bias in the analysis, as the user’s subjective criteria may influence the classification results. The analysis of the suburban area of Liege was hence based on a systematic and continuous grid of windows with a 200 m side. The grid of windows of observation was placed according to the spatial gravity centre of our case study.
This grid division implied a rejection of several windows, given the lack of centring of windows on building clusters (type 8). In order to identify windows of observation that contain most buildings near their borders, it was necessary to define a new criterion indicating the layout of buildings at the edges of the window. Observation windows were divided into five equal areas whose boundaries were concentric circles within this window. We then obtained a characterization of the different building clusters based on the global position of all their buildings. Comparison between the position of the centre of each window and the position of the centre of the ellipse of dispersion of the buildings contained in each window enabled the identification of windows of observation containing most buildings near their borders. Additionally, as the grid division is continuous, it does not always correspond to building clusters. For a window to be recognized as significant, we set a threshold of 3 built units. Below this threshold, observation windows were also rejected.
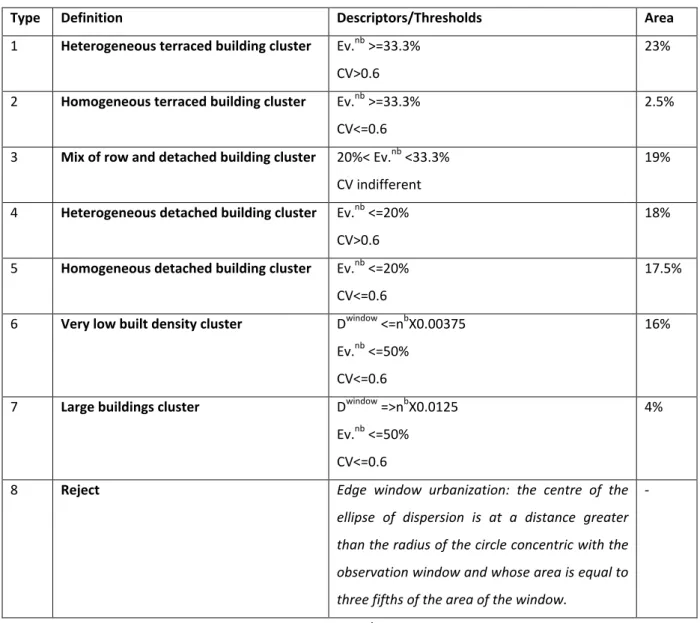
Type Definition Descriptors/Thresholds Area
1 Heterogeneous terraced building cluster Ev.nb >=33.3%
CV>0.6
23% 2 Homogeneous terraced building cluster Ev.nb >=33.3%
CV<=0.6
2.5% 3 Mix of row and detached building cluster 20%< Ev.nb <33.3%
CV indifferent
19% 4 Heterogeneous detached building cluster Ev.nb <=20%
CV>0.6
18% 5 Homogeneous detached building cluster Ev.nb <=20%
CV<=0.6
17.5% 6 Very low built density cluster Dwindow <=nbX0.00375
Ev.nb <=50%
CV<=0.6
16%
7 Large buildings cluster Dwindow =>nbX0.0125 Ev.nb <=50%
CV<=0.6
4%
8 Reject Edge window urbanization: the centre of the ellipse of dispersion is at a distance greater than the radius of the circle concentric with the observation window and whose area is equal to three fifths of the area of the window.
-‐
Table 2: Building cluster types versus descriptors/thresholds
For the final calibration and validation of thresholds, all descriptors were calculated for each of the 8373 windows identified as urbanized in the suburban area of Liege. Some windows were rejected because no building cluster could be identified as valid, either because of limited data (fewer than 3 polygons), or because of the distribution of polygons within the observation window. A set of 300 windows of observation was then randomly selected. These 300 windows were classified visually according to the 7 remaining types of building cluster. A quantitative classification of building clusters was carried out with the proposed thresholds afterwards.
Thresholds for each of the four descriptors were defined on the basis of previous results. Some had to be adapted to improve their matching with visual classification. Afterwards, a
second random selection of 200 windows was carried out. A comparison between visual and automatic classification of this second sample was conducted in order to validate new threshold values. The results were, as with the sample of 300 cases, a perfect match for more than 80% of our cases. After this final validation, the method of automatic classification was applied to the whole suburban area of Liege.
6. Application to the suburban area of Liege
Table 2 provides the global share of building cluster types in the Liege agglomeration. It can be seen that type 1 (heterogeneous terraced building cluster) is the dominant configuration in our study space. As stated earlier, this type of building cluster corresponds to the historical rural cores identified in our qualitative exploratory study. The next two dominant types are respectively types 4 and 5, namely heterogeneous detached building clusters and homogeneous detached building clusters. If we consider these two types together, they include 35.5% of observed building clusters, which greatly supersedes the number of type 1 clusters. Types 4 and 5 are related to two different forms of periurban settlements: individual houses progressively developing within existing dispersed settlements (heterogeneous clusters) and large development operation, systematized by land developers (homogeneous clusters).
Homogeneous terraced building clusters and large building clusters are not very present in our study space. These clusters respectively correspond to 2.5% and 4% of the observation windows. Nevertheless it should be stressed that this analysis remains quantitative. Large building clusters may have an important qualitative impact on landscapes, especially when they tend to be located along access routes or in very visible places.
In addition to these global figures, the spatial distribution of building clusters was also mapped (Figure 4). For legibility reasons, only five types are presented on the map. Types 2 (homogeneous terraced building clusters) and 7 (large building clusters) have not been represented, as they only account for a small share of building clusters. As can be seen on
cores (type 1). Pre-‐existing rural settlements are, in many cases, the background supporting sprawl.
Figure 4: Classification of building clusters in the suburban area of Liege
The different types of building cluster do not develop independently from the local conditions.
Landscapes of Wallonia were defined and delineated by Feltz (2004). Liege is at the crossroads between four of these typical landscapes (Figure 4): Hesbaye (North-‐West), Entre-‐Vesdre-‐et-‐Meuse (East), the Ensemble Mosan (following the river Meuse, from South-‐ West to North) and Condroz (South). Each of these landscapes typically has a specific historical background, notably concerning its urbanization scheme and its relation to agriculture.
Historically, East of Liege (Entre-‐Vesdre-‐et-‐Meuse) is characterized by a combination of densely built areas located within villages and buildings scattered outside these perimeters. The actual urbanization is spread widely over this area. It can be seen that there are very few homogeneous building clusters in this area.
The influence of traditional clustered housing can be observed in the North-‐West of Liege (Hesbaye). In this area, rural villages were originally relatively compact; many of them were densely built with heterogeneous terraced houses. Those villages were located along important roads and this feature is still notable today. Recent urbanization is located along main roads and around historical rural cores (type 1), which are still legible. Historic settlements clearly played a structuring role in that area.
In the South of Liege (Condroz), the rural habitat was historically clustered in small villages and hamlets while some large farms were scattered throughout the landscape. Recent urbanization has been massive, while remaining close to major roads and being organized in large homogeneous clusters. The mix of ancient rural settlements and large patches of recent urbanization is quite characteristic of this area. Historical rural cores are included within more recent urbanization (type 3), while large areas composed of clusters of homogeneous detached buildings (type 5) are disseminated through the landscape.
banks. Early habitat was dense and various industries took advantage of the presence of the river to settle there. Those characteristics still appear to be distinctive of the area through the presence of building cluster types 1 and 7 (not mapped). In the same vein, a linear built-‐ up settlement can be identified at the North-‐East of Liege. It corresponds to an old village, Bassenge, which developed along an affluent of the Meuse River. It constitutes another testimony of the persistency of rural structures in contemporaneous periurban settlements.
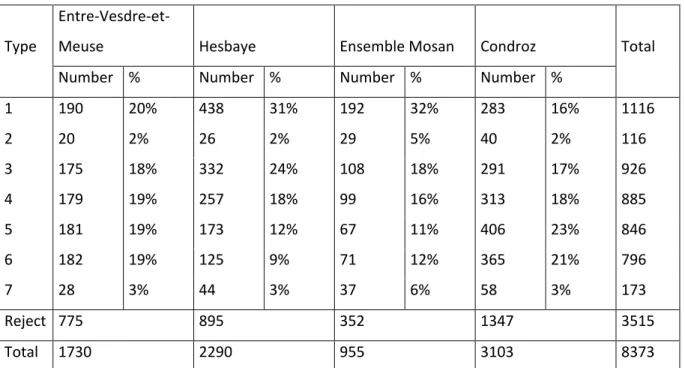
The following summary table shows the share of building cluster types in those four landscape areas (Figure 3). Values are given both in number of building clusters of a particular type and in relative percentage terms.
Type
Entre-‐Vesdre-‐et-‐
Meuse Hesbaye Ensemble Mosan Condroz Total
Number % Number % Number % Number %
1 190 20% 438 31% 192 32% 283 16% 1116 2 20 2% 26 2% 29 5% 40 2% 116 3 175 18% 332 24% 108 18% 291 17% 926 4 179 19% 257 18% 99 16% 313 18% 885 5 181 19% 173 12% 67 11% 406 23% 846 6 182 19% 125 9% 71 12% 365 21% 796 7 28 3% 44 3% 37 6% 58 3% 173 Reject 775 895 352 1347 3515 Total 1730 2290 955 3103 8373
Table 3: Distribution of building cluster types in the Liege landscape areas
The difference in the share of building cluster types between the four landscape areas is clear. Two landscape areas (Hesbaye and Ensemble Mosan) have more than 30% windows characterized by building clusters defined by heterogenous and terraced buildings, while that percentage is much lower in the two remaining landscape areas (less than 20%). The third landscape area (Ensemble Mosan) presents many more terraced and homogeneous building clusters (5%) and large building clusters (6%) than are observed in the three other landscape areas (2% and 3%). These observations confirm that significant differences exist
test applied to the four distributions indicates that the probability of an independence of the distribution of types from landscape type is marginal (p < 0.001).
7. Conclusion
The main objective of this research was to propose a robust methodology for characterizing the morphology of suburban settlements. We therefore proposed a method based on a geometrical and topological analysis of building clusters, defined as sets of buildings encompassed in windows of observation with a 200 m side. Four geometrical descriptors and associated thresholds were proposed to identify and distinguish seven building cluster types.
Our method was developed, calibrated and validated on the suburban area of Liege (Belgium) through a progressive refinement process. It started with an exploratory definition of building cluster types, based on field observation and qualitative judgement. It was then systematized and tested through the use of numeric cadastral maps. The typology, geometrical descriptors and thresholds constitute the most important result of our research. Even though these elements are acknowledged to be place-‐specific, the approach described in this paper is transferable to other suburban areas.
Our results suggest that urban sprawl, when considered from a morphological point of view, is far from being a place-‐independent process. It is deeply influenced by the pre-‐existing substrate. The weight of the rural structures appears to be an essential component of suburban settlements in our study space. This further challenges the idea that historical rural cores would simply become locked in new layers of urbanization. The reverse may in fact be true: current suburban patterns are constrained by local conditions and pre-‐existing settlements, which somehow relates them to specific landscape structures.
Differences observed within the suburban area considered here demonstrate the value of a morphological characterization adapted to the features of specific suburban areas.
develop comparisons of suburban settlements. It may contribute to a dispassionate debate about urban sprawl, through a better understanding of its local determinants and features.
9. References
Antrop M, 2005, “Why landscapes of the past are important for the future” Landscape and
Urban Planning 70 21-‐34
Arribas-‐Bel D, Nijkamp P, Scholten H, 2011, “Multidimensional urban sprawl in Europe: A self-‐organizing map approach” Computer, Environment and Urban Systems 35 263-‐275 Badariotti D, 2005, « Des fractales pour l’urbanisme? Quelques pistes de réflexion à partir de l’exemple de Strasbourg-‐Kehl » Cahiers de Géographie du Québec, Volume 49, 137 September 133-‐156
Ban H, and Ahlqvist O, 2009, “Representing and negotiating uncertain geospatial concepts – Where are the exurban areas?” Computers, Environment and Urban Systems 33 233-‐246 Batty M, 2005, Cities and Complexity: Understanding Cities with Cellular Automata, Agent-‐
Based Models and Fractals (MIT Press, Cambridge, Massachusetts)
Bhatta B, Saraswati S, Bandyopadhyay, 2010, “Urban sprawl measurement from remote sensing data” Applied Geography 30 731-‐740
Bessy-‐Pietri P, Sicamois Y, 2001, « Le zonage en aire urbaines en 1999 – 4 millions d’habitants en plus dans les aires urbaines » Insee première 765
Carlier P, Fontaine S, Monnier B, 2007, « La qualité de l’habitat wallon – synthèse des résultats de l’enquête » Les échos du Logement 4 1-‐15
Chalas Y, Dubois-‐Taine G, 1997 La ville émergente (éditions de l’aube, La Tour d’Aigues) Chin N, 2002, “Unearthing the roots of urban sprawl: a critical analysis of form, function and methodology”, Working Paper 47, Centre for Advanced Spatial Analysis, University College London, http://www.casa.ucl.ac.uk
Couch C, Leontidou L, Petschel-‐Held G, 2007, Urban Sprawl in Europe – Landscapes, land-‐use
Davis C, Schaub T, 2005, “A transboundary study of urban sprawl in the Pacific Coast region of North America: The benefits of multiple measurement methods” International Journal of
Applied Earth Observation and Geoinformation 7 268-‐283
Eberhard J-‐M, 1995, « Etude des structures urbaines de l’agglomération de Mexico à l’aide d’une image HRV de SPOT », in Actes des journées scientifiques de Liege 1995 – Télédétection de milieux urbains et périurbains, AUPELF
EEA: European Environment Agency, 2006, Urban Sprawl -‐ the ignored challenge (Office for publications of the European Communities, Luxembourg).
Espon, 2004, « Les relations urbain-‐rural en Europe -‐ Résumé du rapport final Projet ORATE 1.1.2 », Réseau interdisciplinaire pour l'aménagement du territoire européen, unité mixte de service 2414, http://www.ums-‐riate.fr/112.php
Feltz C, Droeven E, Kummert M, 2004, Les territories paysagers de Wallonie, Etudes et Documents, n°4, Ministère de la Région Wallonne, 68 p.
Frenkel A, Ashkenazi M, 2008, “Measuring urban sprawl: how can we deal with it?”
Environment and Planning B: Planning and Design 2008 35 56-‐79
Galster G, Hanson R, Ratcliffe M R, Wolman H, Coleman S, Freihage J, 2001, “Wrestling sprawl to the ground: defining and measuring an elusive concept” Housing Policy Debate 12 681-‐717
Halleux J-‐M, 2005, Structuration des marchés fonciers et production de l’urbanisation
morphologique : application à la Belgique et à ses nouveaux espaces résidentiels PhD Thesis,
Université de Liège
Halleux J-‐M, 2012, “The adaptive efficiency of land use planning measured by the control of urban sprawl. The cases of the Netherlands, Belgium and Poland” Land Use Policy 29 887-‐ 898
Herold M, Goldstein N C, Clarke K C, 2002, “The spatiotemporal form of urban growth measurement, analysis and modelling” Remote Sensing of Environment 86 286-‐302
Irvin B J, Ventura S J, Slater B K, 1997, “Fuzzy and isodata classification of landform elements from digital terrain data in Pleasant Valley, Wisconsin” Geoderma 77 137-‐154
Jaeger J A G, Bertiller R, Schwick C, Kienast F, 2010a, “Suitability criteria for measures of urban sprawl” Ecological Indicators 10 397-‐406
Jaeger J A G, Bertiller R, Schwick C, Cavens D, Kienast F, 2010b, “Urban permeation of landscapes and sprawl per capita: New measures of urban sprawl” Ecological Indicators 10 427-‐441
Kasanko M, Barredo J I, Lavalle C, McCormick N, Demicheli L, Sagris V, Brezger A, 2006, “Are European cities becoming dispersed? A comparative analysis of 15 European urban areas”
Landscape and Urban Planning 77 111-‐130
Le Jeannic T, 1997, « Radiographie d’un fait de société: la périurbanisation » Insee première 535
Luyten S, Van Hecke E, 2007, « Socio-‐economische Enquête 2001 », Working Papers, Algemene Directie Statistiek en Economische Informatie, Bruxelles, http://www.statbel.fgov.be/studies/thesis_nl.asp?n=848
Mangin D, 2004, Infrastructures et formes de la ville contemporaine – la ville franchisee (éditions de la Villette, Paris)
Pinol J-‐L, Fouchier V, Levy J, Beaucire F, 2000, La forme des villes: caractériser l’étalement
urbain et réfléchir à de nouvelles modalités d’actions (Centre d’études sur les réseaux, les
transports, l’urbanisme et les constructions publiques (CERTU), Lyon)
Piron O, 2004, « Penser, nommer, classer les territoires » Urbanisme 338 70-‐72
Poelmans L, Van Rompaey A, 2009, “Detecting and modelling spatial patterns of urban sprawl in highly fragmented areas: A case study in the Flanders–Brussels region” Landscape
and Urban Planning, Volume 93, 1 10-‐19
Potier F, 2007, Le périurbain Quelle connaissance ? Quelles approches ? (Centre d’études sur les réseaux, les transports, l’urbanisme et les constructions publiques (CERTU), Lyon)