HAL Id: tel-02389924
https://tel.archives-ouvertes.fr/tel-02389924v2
Submitted on 12 Jun 2020HAL is a multi-disciplinary open access archive for the deposit and dissemination of sci-entific research documents, whether they are pub-lished or not. The documents may come from teaching and research institutions in France or abroad, or from public or private research centers.
L’archive ouverte pluridisciplinaire HAL, est destinée au dépôt et à la diffusion de documents scientifiques de niveau recherche, publiés ou non, émanant des établissements d’enseignement et de recherche français ou étrangers, des laboratoires publics ou privés.
evolution using structural MRI in the context of
neurodegenerative diseases
Raphaël Sivera
To cite this version:
Raphaël Sivera. Modeling and measuring the brain morphological evolution using structural MRI in the context of neurodegenerative diseases. Medical Imaging. COMUE Université Côte d’Azur (2015 - 2019), 2019. English. �NNT : 2019AZUR4082�. �tel-02389924v2�
Thèse de Doctorat
Modélisation et mesure de l’évolution
morphologique du cerveau à partir d’IRM
structurelles pour l’étude des maladies
neurodégénératives
Raphaël Sivera
dirigée par Nicholas Ayache
co-encadrée par Hervé Delingette, Xavier Pennec et Marco Lorenzi preparée à l’Inria Sophia Antipolis, équipe Epione
soutenue le 29 novembre 2019
Présentée en vue de l’obtention du grade de Docteur en Automatique, Traite-ment du Signal et des Images de l’Université Côte d’Azur devant le jury composé de :
Jean-François Mangin - CEA (Neurospin) Président
Pierrick Coupé - CNRS (LaBRI - UMR 5800) Rapporteur
Stanley Durrleman - Inria (Aramis Lab) Rapporteur
Nicholas Ayache, - Inria (équipe Epione) Examinateur
Hervé Delingette - Inria (équipe Epione) Examinateur
Xavier Pennec - Inria (équipe Epione) Examinateur
Marco Lorenzi - Inria (équipe Epione) Invité
Titre français
Modélisation et mesure de l’évolution morphologique du
cerveau à partir d’IRM structurelles pour l’étude des
maladies neurodégénératives
Titre anglais
Modeling and measuring the brain morphological
evolu-tion using structural MRI in the context of
neurodegen-erative diseases
Cette thèse a été présentée en vue de l’obtention du garde de Docteur en Sciences de l’Université Côte d’Azur le 29 novembre 2019 devant le jury composé de :
Président Jean-François Mangin - CEA (Neurospin)
Rapporteurs Pierrick Coupé - CNRS (LaBRI - UMR 5800) Stanley Durrleman - Inria (Aramis Lab)
Examinateurs Nicholas Ayache, - Inria (Epione team) Hervé Delingette - Inria (Epione team) Xavier Pennec - Inria (Epione team) Invités Marco Lorenzi - Inria (Epione team)
En imagerie médicale computationnelle, l’analyse statistique des déformations per-met de caractériser les effets des maladies neurodégénératives sur la morphologie cérébrale. Elle soulève cependant des problèmes méthodologiques spécifiques et l’interprétation des résultats reste complexe. L’objectif de cette thèse est de mettre en place un cadre méthodologique et applicatif permettant une meilleure interpré-tation clinique des résultats.
Dans la première partie, nous proposons un modèle joint des effets du vieillisse-ment et de la maladie d’Alzheimer sur le cerveau. Le modèle propose une description simple des deux processus et peut être utilisé pour générer des évolutions réalistes et personnalisées pour divers diagnostics.
Dans la seconde partie, une analyse statistique morphométrique est réalisée dans le cadre de l’essai clinique MAPT. Un effet de l’intervention multidomaine sur la morphologie cérébrale est mis en évidence en multivariée alors qu’il n’est pas di-rectement observable sur les variables cliniques ou les mesures volumétriques. Nous montrons que ces différences associées au traitement sont corrélées à de meilleures performances cognitives.
La troisième partie détaille plus en profondeur la méthodologie statistique util-isée. Il s’agit d’un cadre général de test d’hypothèse à partir d’images multivariées qui généralise les outils non paramétriques existants et requiert peu d’hypothèses pour être appliqué.
Enfin, la dernière partie explore les relations existantes entre la morpholo-gie cérébrale et la cognition chez les personnes âgées. Les corrélations spatiales et les schémas d’évolution observés suggèrent l’existence de plusieurs dynamiques d’évolutions.
Mots-clés : morphométrie, vieillissement, maladie d’Alzheimer,
In medical imaging, the statistical analysis of deformations enables the characteriza-tion of the effects of neurodegenerative diseases on the brain morphology. Deforma-tions are able to capture precise changes but their analysis raises specific method-ological challenges and the results may be difficult to interpret. The objective of this thesis is to present deformation-based methods and to show applications that contribute towards a better clinical interpretation of morphological changes.
In the first part, we introduce a joint model of the effects of normal aging and Alzheimer’s disease on the brain morphology. The model proposes a simple descrip-tion of both processes and is used to generate realistic and personalized evoludescrip-tions under several diagnosis conditions.
In the second part, a morphometric study is conducted on the MAPT cohort. We bring out an effect of the multidomain intervention on the longitudinal deformation of the brain using multivariate statistics. This effect is not observable using clinical assessments or volumetric measures, but we show that the differences associated with the treatment are correlated with better cognitive performance.
The third part extends the statistical methodology used in the second part. A complete hypothesis testing framework for multivariate images is presented. It generalizes existing non-parametric frameworks and requires few hypothesis on the data to be applied.
Finally the last part builds on the methodology of the previous sections to ex-plore the relation between morphology and cognition in elderly subjects. The spatial correlations and the patterns of evolution described in this section suggest the ex-istence of several dynamics of evolutions that are associated with specific cognitive changes.
Keywords: morphometry, aging, Alzheimer’s disease, MRI, longi-tudinal models, multivariate statistical analysis
Cette thèse n’aurait évidemment pas été possible sans le soutien de mes encadrants Nicholas, Hervé, Xavier et Marco. Je tiens à vous remercier chaleureusement, ce travail est autant le votre que le mien. Merci pour tout ce que vous m’avez appris, je pense que vous êtes aussi arrivé à me transmettre un peu de la rigueur et du recul nécessaire au travail de recherche.
Je voudrais aussi remercier Philippe Robert, Valeria Manera et Nicolas Capet avec qui j’ai eu la chance de collaborer pour l’analyse des données MAPT. Travailler avec vous a été très stimulant et très agréable.
Enfin je remercie les membres du jury et en particulier Pierrick Coupé et Stanley Durrleman pour leur lecture attentive et leurs commentaires sur le travail présenté dans ce manuscrit et merci à Jean-François Mangin d’avoir accepter de présider mon jury de thèse.
À Rocío, Chloé, Loïc L., Nicolas C., Jan, Mathieu, Nina, Bishesh, Mehdi, Marc-Mich, Thomas, Sophie, Roch, Pawel, Shuman, Julian, Qiao, Wen, Luigi, Nicoco, Tania, Fanny, Yann, Benoit, Clément, Jaume, Sara, Buntheng, Nicolas G., Gaëtan et tous les autres membres d’Asclepios, d’Epione et d’ailleurs avec qui j’ai passé de nombreuses pauses café, soirées beachvolleys, journées à Auron... durant ces quatre années riches en souvenirs. À ma famille.
1 Context and objectives 1
1.1 Age related neurological disorders . . . 1
1.1.1 Alzheimer’s disease . . . 1
1.1.2 Toward a better understanding of disease progression . . . 2
1.2 Brain morphometry. . . 3
1.2.1 Segmentation-based approaches . . . 3
1.2.2 Voxel-wise morphometry and deformation modeling. . . 4
1.2.3 The stationary velocity field framework . . . 4
1.3 General objective . . . 5
1.4 Manuscript organization and contributions . . . 6
2 Modeling the effects of aging and Alzheimer’s disease on the brain morphology 11 2.1 Introduction . . . 12
2.1.1 Modeling brain morphological aging . . . 12
2.1.2 Disease progression modeling . . . 13
2.1.3 Toward a joint model of brain aging and disease progression . 14 2.2 Definition of the generative model. . . 15
2.2.1 A space of reference morphologies. . . 15
2.2.2 Modeling the morphological evolution of the template . . . . 16
2.2.3 Individual morphological variability and generative model . . 17
2.3 Estimation of the model parameters . . . 18
2.3.1 Estimation of the template trajectories vA and vD in a given template space . . . 19
2.3.2 Estimation of the template morphology T0 . . . 20
2.3.3 Estimation of the subject’s parameters . . . 21
2.4 Results. . . 21
2.4.1 Experiments with synthetic data . . . 21
2.4.2 Experiments on ADNI data . . . 24
2.4.3 Generating diagnosis driven morphological evolution . . . 33
2.5 Discussion and perspectives . . . 36
2.5.1 Approximations in the model estimation . . . 37
2.5.2 Limitations of the description . . . 38
2.5.3 Perspectives . . . 38
2.6 Appendix . . . 39
2.6.1 Validation on a synthetic dataset . . . 39
3 Exploratory morphometry for the MAPT clinical trial 43
3.1 Introduction . . . 44
3.1.1 The MAPT study . . . 44
3.1.2 Measuring the evolution of the brain morphology . . . 45
3.2 Method . . . 46
3.2.1 Participants . . . 46
3.2.2 Regional atrophy and cortical thickness assessments . . . 46
3.2.3 Statistical analysis of the deformations . . . 46
3.3 Results. . . 49
3.3.1 Cognitive, behavioral and functional assessment . . . 49
3.3.2 Segmentation-based statistical analysis of the interventions’ effect. . . 49
3.3.3 Deformation-based statistical analysis of the interventions’ effect 51 3.3.4 Description of the MDI effect on the brain morphology . . . . 51
3.3.5 Relation to cognitive and behavioral scores . . . 55
3.4 Discussion . . . 56
3.4.1 Interpretation of the morphological changes . . . 57
3.4.2 Limitations . . . 57
3.4.3 Perspectives . . . 58
3.5 Conclusion. . . 58
4 Statistical framework for hypothesis testing on deformations 61 4.1 Context and objectives . . . 62
4.1.1 Deformation-based morphometry . . . 62
4.1.2 Clinical motivation: the MAPT case study. . . 63
4.1.3 Chapter overview . . . 63
4.2 Method . . . 64
4.2.1 Multivariate General Linear Model . . . 64
4.2.2 Likelihood ratio test . . . 65
4.2.3 Design for non-parametric statistical testing on images . . . . 65
4.3 Experimental results in the MAPT study . . . 67
4.3.1 Results of the multivariate analysis . . . 67
4.3.2 Comparison to the atrophy-based assessments . . . 68
4.4 Alternative methodological choices . . . 70
4.4.1 Voxel statistic. . . 70
4.4.2 Summary statistic . . . 72
4.5 Discussion . . . 76
4.5.1 Statistical analysis parameters . . . 76
4.5.2 Interpretation of morphological differences . . . 77
4.6 Conclusion. . . 78
5 Relations between cognitive assessments and brain morphological
evolution in the MAPT cohort 79
5.1 Introduction . . . 80
5.2 Data and Method . . . 81
5.2.1 Participants: the MAPT cohort . . . 81
5.2.2 Modeling the brain evolution . . . 81
5.2.3 Statistical analysis of the correlation . . . 81
5.2.4 Cross decomposition of the cognitive and morphological evo-lution . . . 82
5.3 Correlation between morphological changes and cognitive and behav-ioral scores . . . 82
5.4 PLS between cognitive variables and morphological evolution . . . . 84
5.4.1 Dimension reduction with PCA . . . 86
5.4.2 Cross decomposition with PLS . . . 86
5.5 Discussion . . . 88
5.5.1 Correlations with cognitive scores . . . 88
5.5.2 Cross-decomposition of morphological and cognitive evolutions 88 5.5.3 Limitations and perspectives . . . 88
6 Conclusion and Perspectives 93 6.1 Summary of the main contributions. . . 93
6.2 Publications . . . 95
6.3 Perspectives . . . 95
6.3.1 Describing the brain deformations . . . 95
6.3.2 Multimodal approach . . . 96
6.3.3 Spatio-temporal patterns and disease evolution subtypes . . . 97
A Appendix A: Algorithmic contribution to the measure of the brain evolution 99 A.1 Robust-FOV . . . 99
A.1.1 Context . . . 99
A.1.2 Model . . . 100
A.1.3 Implementation . . . 101
A.2 Alignment: quality control . . . 101
A.2.1 Segmentation and skull-striping . . . 102
A.2.2 Residual affine component in a SVFs . . . 103
A.3 Affine invariant LCC-demons registration . . . 103
A.3.1 Local correlation coefficient . . . 103
A.3.2 Evaluation on controlled experiments. . . 104
Context and objectives
Contents
1.1 Age related neurological disorders . . . 1
1.1.1 Alzheimer’s disease . . . 1
1.1.2 Toward a better understanding of disease progression . . . . 2
1.2 Brain morphometry . . . 3
1.2.1 Segmentation-based approaches . . . 3
1.2.2 Voxel-wise morphometry and deformation modeling . . . 4
1.2.3 The stationary velocity field framework . . . 4
1.3 General objective . . . 5
1.4 Manuscript organization and contributions . . . 6
1.1
Age related neurological disorders
Age-related neurological disorders are a growing public-health concern with the ag-ing of the population (National Institute of Aging,2019). Life expectancy is increas-ing and the risk of developincreas-ing a neurodegenerative disease dramatically increases with age. For example, the proportion of people with Alzheimer’s disease (AD) doubles every 5 years above age 65 and about one third of people older than 85 may be affected.
1.1.1 Alzheimer’s disease
Alzheimer’s disease is the most common form of dementia for older adults. It pro-gressively destroys memory, reasoning, language and eventually disrupts the ability to carry even the simplest tasks and to have normal social interactions. The symp-toms of the disease were first described by Dr A. Alzheimer in 1906. Since then, many progresses have been done on the understanding of the disease and its char-acteristics (Alzheimer’s Association and others,2017).
The first changes associated with AD are visible at the cellular level with, in particular, an abnormal accumulation of beta-amyloid 42 protein between neurons, forming plaques that can disrupt normal metabolism. In the mean time, another abnormal accumulation of a protein called tau is observed inside the cells. These accumulations in conjunction with other factors (such as inflammation or vascular
problem) further injure the neurons and disrupt the normal axonal and the synaptic communication. Finally, these dysfunctions directly result in a massive increase of the cell death rate.
These deaths and the structural changes affecting the neurons are visible at a macroscopic level with regions of the brain shrinking. This atrophy is widespread in the brain but not uniformly distributed. Beyond the most used atrophy markers that are generally measured in the hippocampi, the atrophy is also characterized in the enthorinal cortex and most of the neocortex along a temporo-parietal-frontal trajectory. The changes are also visible in the white matter (through white matter tract abnormality) and in subcortical structure such as the amygdala and the tha-lamus (Pini et al.,2016). However these symptoms and their progression can differ between patients and the structural changes are often used has a complementary diagnosis tool.
Finally, the degradation of the functioning of the brain is reflected in the cog-nition with memory decline, language impairment, and emotional and behavioral changes. As the disease progresses, the general condition declines making constant care often necessary, and leading to the death of the patient.
1.1.2 Toward a better understanding of disease progression
The causes and origins of the disease and the mechanisms involved are not fully understood yet. Several risk factors have been identified regarding the genetic (in particular for the early-onset familial AD or relatively the APOE gene for late-onset AD) or the general health and vascular conditions but the precise characterization of the proceedings of the disease is still under investigation. As of today, the only available treatments aim to slow down the progression of the cognitive symptoms for some patients. Eventually the objective would be to identify an eventual treatment or some prevention actions.
Time plays a central role in the development of neurodegenerative diseases. First, age can be considered as the first risk factor and it is associated with the general effect of time on the body and the mind. Second, these diseases develop over several decade and the evolution between the first signs and the terminal stages can last over 20 years. These aspects have emphasized the importance of the description of the evolution for the prognosis (the prediction of the evolution) and the prevention of the disease.
From the practical point of view, longitudinal studies have been conducted to follow a cohort of subjects over several years. The longitudinal follow-up gives an intrinsic control on the individual variability that can be leveraged to refine the cross-sectional observations. The understanding of the individual evolution is crucial to design potential treatment, assess their efficacy in clinical trial and eventually predict the future progression of the patient to propose a personalized response.
1.2
Brain morphometry
The brain is a complex organ that can be described at many scales and from many points of view. It contains billions of neurons with their own metabolism that communicate between them and with the rest of the body through electrical and chemical signals in a huge interconnected network. The brain is also the central place for the consciousness and more generally all the cognitive activities.
The study of the brain is made even more complicated by the fact that the object of interest is inside the skull of a living person and is by consequence not easily acces-sible. Post-mortem dissections and histological analyses were crucial to describe the anatomy of the brain and remain important to understand, for instance, the neural mechanisms involved in AD (Ikonomovic et al.,2008). Animal model can also help understanding the brain (Roy et al.,2016). More significantly neuroimaging tech-niques make it possible to virtually explore the brain and give direct insights about its structure and its activity. Many different modalities are now available, each one informing us about different aspects. These modalities cover some metabolic function using Positron-Emission Tomography (PET), the functional activity of the cells for electroencephalography (EEG) or functional MRI, the tissue structure us-ing diffusion imagus-ing for example and the anatomy with specificity related to each modality.
In this work, we focus on the morphological changes affecting the brain. We will then introduce, in this section, morphometric approaches that deal with the assessments and the description of the shape of the brain and its evolution.
1.2.1 Segmentation-based approaches
The first step is to have a good description of the anatomy of the brain. Anatomi-cal descriptions of the brain can be found since ancient Egypt. Nowadays, modern anatomical atlases built from histological sections are complete and precise ( Ta-lairach,1988;Mai et al.,2015). These maps give accurate delineations or segmenta-tions of cortical and subcortical area that can be adapted to subject-specific data.
Nevertheless the manual segmentation of the whole brain or even of a single structure is time-consuming. In the last decades segmentation softwares were pro-posed to automatically or semi-automatically perform this task usually using the manually defined atlas as a prior to their segmentation. The focus of segmentation software can be diverse: whole brain segmentation (Fischl et al.,2002;Manjón and Coupé,2016), tissue classification with a focus on WM/GM (Ashburner and Fris-ton,2005) or specialized in in a substructure such as the hippocampus (Carmichael et al.,2005;van der Lijn et al.,2008;Coupé et al.,2011).
From these segmentations it is easy to derive measurements that characterize these anatomical regions of interest (some measures can be computed without a real segmentation, for example with landmarks, but the idea is similar). The most com-mon measures are arguably sub-cortical volumes and cortical thicknesses but more complex indicators can be designed such as the cortex curvature or folding (Pereira
et al.,2012).
Thanks to the availability of software providing brain analysis methods, these measures can be nowadays reproduced, evaluated and benchmarkerd in different applications. Their clinical use is still limited but these measures can be com-pared between subjects or groups and have been proven useful to monitor the brain evolution, characterize disease progression or to assist early-diagnostic of neurode-generative diseases (Devanand et al.,2007;Colliot et al.,2008;Risacher et al.,2010;
Coupé,2018).
However, even if these approaches offer valuable quantitative assessments, they also show some limitations related to their design: some regions are harder to seg-ment and are by consequence under-studied, scalar markers are unable to fully characterize the shape of a brain structure, and the resolution of the description is limited by the available segmentations. By consequence, many alternatives have been proposed in the last decades.
1.2.2 Voxel-wise morphometry and deformation modeling
The use of high-resolution digital images leads to a family of techniques that process the full images voxel-wise. These methods do not rely on a priori defined regions but aim for a description at the voxel level. The most important example is cer-tainly the voxel-based morphometry (VBM) methods for the statistical comparison of gray matter density map (Ashburner and Friston,2000), but similar approaches are commonly applied to various imaging data such as PET amyloid (Kemppainen et al.,2006) or fMRI (Liu et al.,2008).
In parallel of these methods focusing on the comparison of voxel intensities, some approaches aim at describing the morphological deformation that transform one brain into another one (Ashburner et al.,1998;Arsigny et al.,2006;Zhang et al.,
2010). Deformation-based morphometry requires more accurate and higher resolu-tion estimaresolu-tions of the deformaresolu-tions but is able to explicitly model the differences and to describe some subtle local changes.
The dichotomy between voxel-based and deformation-based methods is not ab-solute. Most VBM approaches use non-linear deformations to normalize the images (using modulation for example to take into account the deformation) (Hutton et al.,
2009). Likewise, deformation-based approaches go beyond the local comparisons of deformation fields and are able to describe global shape changes (Cury et al.,2016) or to spatially normalize manifold valued data (Qiu et al.,2007;Koval et al.,2017).
1.2.3 The stationary velocity field framework
The work presented in this thesis is centered around deformation-based morphome-try. More specificly, the deformation framework used is based on an parametrization of diffeomorphisms using stationary velocity fields (Arsigny et al., 2006). In this setting, smooth and reversible deformations that spatially align the anatomies are estimated through non-linear registration (Lorenzi and Pennec,2014) between pairs
of images. These deformations are fully parametrized by the flow of a stationary velocity field (SVF). This approach is similar to the Large Deformation Metric Map-ping (LDDMM) framework (Beg et al.,2005) but no metric between deformations is chosen a priori (even if we need a regularization criterion for the registration). To compute a deformation φ we integrate trajectories along the vector field v for a unit of time.
φ(x) = φ1(x) =
Z 1
0
v(φt(x))dt with φ0= Id.
From these deformations it is possible to compute the corresponding volume changes locally in the brain (Lorenzi et al.,2013), but it is also possible to analyze the longitudinal intra-subject evolutions directly in the deformation space using the SVFs transported in a common reference space where they can be compared. A more complete description and discussion about the complete processing pipeline for the comparison of longitudinal evolution is described in (Hadj-Hamou et al.,2016). During this thesis, some practical contributions to this pipeline were developed; they are summarized in AppendixA.
1.3
General objective
With this thesis, we aim at contributing to the description of the longitudinal evo-lution of the brain in aging and in Alzheimer’s disease with a focus on the mor-phological changes. The description of AD symptoms shows a complex entangling of multiple mechanisms that unroll over several decades and some of them are re-flected by morphological changes very early in the course of the disease. Moreover, mathematical and algorithmic tools in morphometry provide a large spectrum of well-established quantitative approaches that have been proven useful to study AD. Our objective is to develop new approaches for the characterizations of the mor-phological changes that leverage on the versatility of deformation-based modeling to propose simple but extensive descriptions that go beyond simple volumetric mea-sures. The idea is that the deformations could reflect cellular structural change that are not captured using simpler scalar assessments and that they consequently could help precise the clinical assessment of the disease progression.
We also consider that the relation with aging and the temporality of the disease are central key-points to the understanding of the brain evolution. To this end, we focus on longitudinal analysis and we draw on the existing databases of images acquired over several years to characterize the disease progression. Regarding the clinical applications, the problem is twofold: the description of the population-wise trends is interesting to understand the disease or to the conduct clinical trials but, in general, the clinical practice aims to take into account the specificity of the subject evolution in regard of the general model of the disease.
1.4
Manuscript organization and contributions
Each of the 4 chapters of this manuscript addresses different aspects of our main objective. We introduce here the focus and the contributions of each part.
First, in chapter2, we consider the problem of the modeling of the morphological evolution. The proposed deformation-based generative model aims to jointly take into account normal aging and AD, and to fill the gap between the short-term individual observations and the long-term disease evolution.
Relatively to this descriptive model, the next chapters are more related to ex-ploratory approaches. Statistical analysis of the images proved crucial to charac-terized the changes associated with Alzheimer’s disease. In chapter 3, we apply morphometric methods to the MAPT clinical trial to assess the potential effect of clinical interventions. The multivariate analysis of the deformations reveals an ef-fect that is not visible with traditional approaches. This leads us to the general hypothesis testing framework for multivariate images that we present in chapter 4. This framework enables the statistical analysis of deformations or complex imaging data in various contexts.
This framework is in particular used in chapter5to explore the relations between brain morphology and cognition. This last chapter concludes our thesis by opening perspectives towards a more inclusive description of the brain changes that takes into account, in addition to the morphology, other clinically relevant variables.
We now summarize each chapter individually and recall their main contributions.
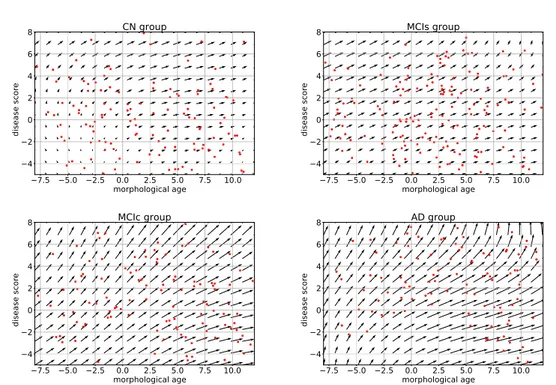
Modeling the effects of aging and Alzheimer’s disease on the brain mor-phology. The morphological aging of the brain and disease progression have gen-erally been modeled independently even though they involve intertwined processes, and their consequences may affect the same structural features of the brain. In chap-ter 2, we introduce a deformation-based framework to jointly model the influence of aging and Alzheimer’s disease on the brain morphological evolution. The model is used to describe the spatio-temporal evolution of both processes and to define two cross-sectional progression markers: 1) a morphological age and 2) a disease score. The longitudinal evolution of these markers is then studied in relation with the clinical diagnosis of the subjects and used to generate possible morphological evolutions.
We show that the joint modeling of normal and pathological evolutions using deformations leads to promising results to describe age-related brain diseases over long time scales. Our generative model is simplistic but the markers are able to confirm the presence of an accelerated apparent aging component in Alzheimer’s patients and to highlight specific morphological changes that can help discriminate clinical conditions, even in prodromal stages.
The main contributions developed in this part are:
• We disentangle aging and disease progression for elderly patients. We pro-pose a simple description of the brain morphological evolution using only two
interpretable image-based progression markers: the morphological age and a disease score.
• These markers are cross-sectional assessments and are consistent for intra-subject longitudinal analyses. They can be seen as alternative aging measure-ments compatible with ongoing biological processes.
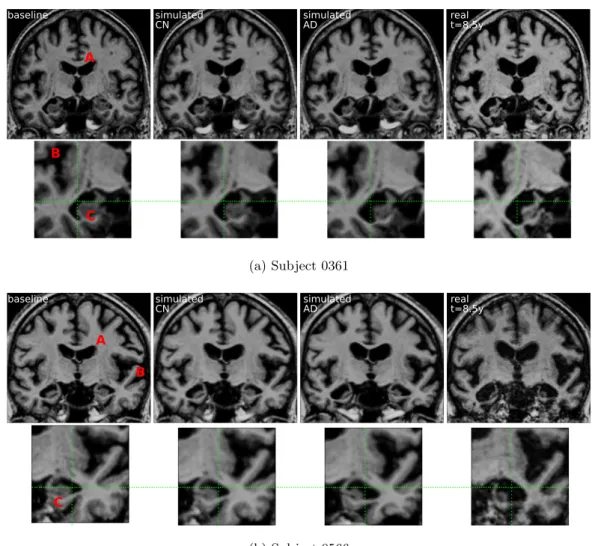
• We show that the markers and the generative model can be used in a person-alized image simulation setting. The framework allows us to generate smooth and realistic evolutions for several diagnosis conditions.
This chapter is based on the work published in A model of brain morphological changes related to aging and Alzheimer’s disease from cross-sectional assessments, Raphaël Sivera, Hervé Delingette, Marco Lorenzi, Xavier Pennec, and Nicholas Ay-ache. NeuroImage, 2019.
Morphometry for the MAPT clinical trial. In chapter 3, a complete mor-phometrical analysis is conducted in the context of the MAPT study.
The Multidomain Alzheimer Preventive Trial (MAPT) was designed to assess the effect of an omega-3 supplementation and a multidomain intervention (physical activity, cognitive training and nutritional advice) on cognitive decline of people with subjective memory complaint. In term of cognitive testing, no significant effect on cognitive decline was found.
The objective of this chapter is to assess an eventual effect of the interventions on the evolution of the brain morphology using the MR images acquired during MAPT. The morphological changes are assessed from volume measurements of regions of interest and a voxel-wise deformation-based approach that was specificly developed for this problem.
We find that the multi-domain intervention is associated with a significant effect on the 3-year morphological evolution. The voxel-wise deformation-based approach shows that the differences are mainly located in the left peri-ventricular area next to the temporo-parietal junction. These morphological changes correspond to a slower morphological evolution and are correlated with a better performance in cognitive assessments. These results could not be observed using the volumetric morphometry approach. We argue that the use of neuroimaging could help better define early intervention strategies that are effective to delay cognitive decline and dementia.
The main contributions developed in this part are:
• A significant effect of the multidomain intervention on the brain morphology is found.
• We are able to relate this effect to a slower morphological evolution and better performance in cognitive assessments.
• From the methodological standpoint, this work illustrates the fact that the statistical analysis of longitudinal deformations is able to discriminate
condi-tions more precisely than segmentation-based approaches even without priors on the affected areas.
This work have been submitted and is under-review: Voxel based assessments of treatment effects on brain evolution in the MAPT cohort, Raphaël Sivera, Nicolas Capet, Valeria Manera, Roxane Fabre, Marco Lorenzi, Hervé Delingette, Xavier Pennec, and Nicholas Ayache. submitted to Neurobiology of Aging, 2019.
Statistical framework for the analysis of deformation. The statistical anal-ysis of the deformations was central in the Chapter 3 to characterize the effect of the treatments in the MAPT study. However, the focus was on the description of the results and their clinical implications. The methodological contributions were then secondary. Nonetheless, because the causes of AD are not fully understood and because no treatment is available yet, the development of general approaches that can be easily adapted to new problems is a important challenge.
Voxel-wise statistical analysis for scalar images is a well-established domain in medical imaging. However, the usual approaches are limited in their characterization of the morphological changes and the analysis of the multivariate fields parametriz-ing the deformations raises new issues and challenges.
In this context, Chapter4describes the general mass-multivariate statistical test-ing framework for multivariate images that was used in Chapter 3. The framework is useful to characterize patterns at the population level and to highlight differences related to clinical variables. We present the theoretical foundations of the frame-work, detail the methodology and explore the importance of the main parameters of the approach. The question of the treatment effect in the MAPT study (introduced in Chapter 3) is used as the main illustration.
The main contributions developed in this part are:
• We present a complete framework for permutation-based hypothesis testing in multivariate images.
• We open several alternatives to the standard statistical analyses.
• No hypothesis on the data is required making it widely applicable in various context.
Relations between cognition and morphology. One of the main issue en-countered in the first chapters is the interpretation of the observed morphological deformations. Measuring the deformations is a challenging task and the results may be method dependent. Then, the spatial interpretation is made even more complex by the inter-connectivity of brain areas and because the local information given by the displacements is not directly interpretable. If the deformations are not fully meaningful by themselves maybe the solution is to consider them in relation with other clinical variables.
To address this problem and open new perspectives on the description of the brain evolution, in Chapter 5, we explore the relations between the morphological
and cognitive evolution of aging subjects. The objective is double. First, aging and neurological disorders cannot be fully understood if we only consider one point view. The brain processes are intricated and their interactions are decisive to comprehend the whole evolution. This work is one step in this direction. Second, we want to use the cognitive information to inform our description of the morphological changes in order to interpret and eventually label specific patterns. In particular, the methods and the processing are similar to the ones used in Chapter3 and this analysis may serve as a reference to better understand the observed treatment effect.
Two methodological approaches are proposed. The first one uses the statisti-cal multivariate framework described in Chapter 4, the second relies on a cross-decomposition using partial least square (PLS). Spatial correlation patterns are described for several common cognitive scores and the main modes of the cognitive-morphological evolution are characterized in the MAPT data set.
The main contributions developed in this part are:
• We show significant spatial correlations between morphological changes in ag-ing and the evolution of several cognitive variables.
• The spatial patterns are coherent with the assessed cognitive traits and the general knowledge of the brain.
• We highlight using PLS several modes of evolutions that can be interpreted as: 1. describing the general cognitive decline, 2. focusing on behavioral evolution, 3. specifically associated with the MDI treatment.
Modeling the effects of aging and
Alzheimer’s disease on the brain
morphology
Contents
2.1 Introduction . . . 12
2.1.1 Modeling brain morphological aging . . . 12
2.1.2 Disease progression modeling . . . 13
2.1.3 Toward a joint model of brain aging and disease progression. 14
2.2 Definition of the generative model . . . 15
2.2.1 A space of reference morphologies . . . 15
2.2.2 Modeling the morphological evolution of the template . . . . 16
2.2.3 Individual morphological variability and generative model . . 17
2.3 Estimation of the model parameters . . . 18
2.3.1 Estimation of the template trajectories vA and vD in a given
template space . . . 19
2.3.2 Estimation of the template morphology T0. . . 20
2.3.3 Estimation of the subject’s parameters. . . 21
2.4 Results . . . 21
2.4.1 Experiments with synthetic data . . . 21
2.4.2 Experiments on ADNI data . . . 24
2.4.3 Generating diagnosis driven morphological evolution . . . 33
2.5 Discussion and perspectives . . . 36
2.5.1 Approximations in the model estimation . . . 37
2.5.2 Limitations of the description . . . 38
2.5.3 Perspectives. . . 38
2.6 Appendix . . . 39
2.6.1 Validation on a synthetic dataset . . . 39
2.6.2 Bias on the estimated template trajectories . . . 40
In this chapter, we introduce a deformation-based framework to jointly model the influence of aging and Alzheimer’s disease on the brain morphological evolution.
This framework is used to describe the spatio-temporal evolution of both processes and to define two cross-sectional progression markers: 1) a morphological age and 2) a disease score. The longitudinal evolution of these markers is then studied in relation with the clinical diagnosis of the subjects and used to generate possible morphological evolutions.
We show that the joint modeling of normal and pathological evolutions using deformations leads to promising results to describe age-related brain diseases over long time scales. Our generative model is simplistic but the markers are able to confirm the presence of an accelerated apparent aging component in Alzheimer’s patients and to highlight specific morphological changes that can help discriminate clinical conditions, even in prodromal stages.
This work was published in the following paper: A model of brain morphological changes related to aging and Alzheimer’s disease from cross-sectional assessments, Raphaël Sivera, Hervé Delingette, Marco Lorenzi, Xavier Pennec, Nicholas Ayache, NeuroImage, 2019 in press.
2.1
Introduction
Age-related diseases are a growing public health concern with the aging of the popu-lation. For this reason, a precise description of aging would be useful to predict and describe the evolution of these diseases. In complement to the chronological age, i.e. the time elapsed since birth, one would like to estimate a biological age that reflects the current physiological, functional or structural status of an organ relatively to the aging changes. However there is no unified way to describe aging in a clinical context since aging is a complex process which affects every part of the body with specific mechanisms and specific rate. As a consequence multiple theories of aging have been proposed (Medvedev, 1990), leading to the definition of surrogate age variables based on the quantification of biological changes.
2.1.1 Modeling brain morphological aging
In this chapter we focus on the aging of the brain based on the study of its shape evolution. The brain is not exempt from aging and a decline of cognitive process-ing speed, workprocess-ing memory, inhibitory function, and long-term memory is generally observed. This decline has been associated with neural activity changes (Park and Reuter-Lorenz, 2009) and it was also shown to be directly correlated with struc-tural changes such as brain atrophy, cortex thinning and decrease of white matter integrity (Rosen et al.,2003;Rodrigue and Raz,2004).
The normal brain morphology has been studied in image-based studies from the development stage to the most advanced ages. Measurements of brain structures (volumes, cortical thickness, etc.) have been performed for wide age ranges and the statistical analysis of the evolution of these measurements helps in providing an initial understanding of the normal brain shape evolution across life span (Good et al.,2001;Long et al.,2012). These descriptions have been used to estimate models
characterizing brain aging in order to highlight differences across brain areas (Hutton et al., 2009;Sowell et al.,2003). The inverse problem, i.e. how to associate an age to a brain image, was also addressed. Models have been designed to estimate the chronological age (Cole et al., 2017) from an image but they can also be used to characterize abnormal evolutions. For instance, a mean brain age gap estimate was highlighted for Alzheimer’s patients (Franke et al., 2010). In Huizinga et al.
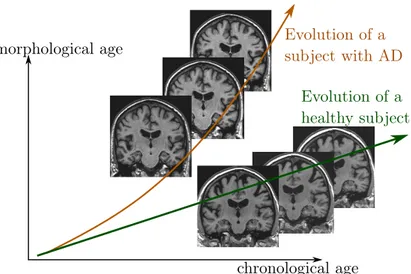
(2018), a morphological score is built to assess the effect of aging on the brain morphology and the authors show that AD subjects are associated with abnormaly high scores. More generally, these surrogate brain age estimates have been associated with an increase of risk factors for several age-related disorders such as cardio-vascular diseases (DeCarli et al.,2005; van Velsen et al., 2013). In a longitudinal setting, a brain age measurement could be used to compare the evolution of several clinical conditions (see Figure2.1).
chronological age morphological age Evolution of a subject with AD Evolution of a healthy subject
Figure 2.1: Schematic representation of two evolutions relative to an hypothetical morphological age reflecting the structural status of the brain relative to the aging process.
2.1.2 Disease progression modeling
Brain aging is often associated with the development of neurodegenerative patholo-gies. For example, it is estimated that one in three people over 85 have Alzheimer’s disease (AD), the most common form of dementia (Alzheimer’s Association and others, 2017). This disease comes with its own specific apparent brain morpholog-ical changes (Ohnishi et al., 2001) and computer-aided diagnosis techniques using neuroimaging features have shown promising results to classify and to predict clini-cal evolutions (Davatzikos et al.,2009;Klöppel et al.,2012;Schmitter et al.,2015). Longitudinal studies provide us with multiple acquisitions at different times for ev-ery subject but the disease affects patients over several decades, starting even before the first symptoms occur, and few studies follow a significant number of subjects
over such long times. Progression models have been developed to describe the global evolution and to put in relation the individual trajectories that could only be ob-served a limited number of times. They have been used to model the progression of biomarkers (Fonteijn et al., 2012; Donohue et al., 2014) but also directly brain shape (Cury et al.,2016) or spatio-temporal patterns in brain images (Koval et al.,
2017; Schiratti et al., 2017). These models produce good representations of the disease progression and can combine a variety of available biomarkers for patient monitoring (Bilgel et al.,2016;Lorenzi et al.,2017).
2.1.3 Toward a joint model of brain aging and disease progression
The morphological aging of the brain and disease progression have generally been modeled independently. However we know that the structural features used in di-agnosis (e.g cortical thickness or atrophy patterns) are also generally related to age. Indeed aging and neurodegenerative diseases involve intertwined processes with en-tangled consequences. Surrogate age measurements have been used to support the disease characterization (Franke and Gaser, 2012) or to put aside the aging part in order to focus on the disease specific changes. Lorenzi et al. (2015) proposed to model the normal aging evolution to separate the contribution of aging from a re-mainder that is not explicitly modeled. This rere-mainder is then used to describe the pathological evolution. However, this method does not propose an intrinsic model of the disease progression making it difficult to describe and to characterize disease specific changes.
In this study, we propose a generative model of the brain morphological evolution that jointly takes into account the normal aging and the disease effects. Our model is based on the approach proposed byLorenzi et al.(2015) and gives a deformation-based description of subject trajectories. It extends the original approach by explic-itly modeling the disease specific brain morphological evolution. In addition to the apparent morphological age computed in the proposed approach, it allows us to get a disease score, thus providing two morphological imaging biomarkers accounting for the progression of the two main ongoing processes: normal aging and Alzheimer’s disease. These biomarkers are estimated cross-sectionnally from a single structural MRI but the model estimation exploits longitudinal data to match as accurately as possible the morphological evolution of the subjects.
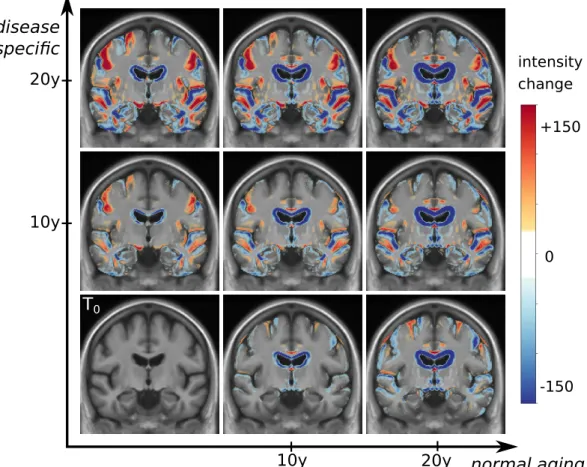
We introduce in section 2.2 the generative model used to represent the brain morphology. Section 2.3 focuses on the estimation of the model parameters and on the inverse problem solved to compute the morphological age and the disease score of a subject. Experimental results are then presented in section 2.4 in order to evaluate our model and parameter estimation procedure. We illustrate how the model helps to describe the evolution of subjects at different disease stages using the ADNI database. Then we show how the two proposed markers can help to follow the evolution of elderly patients. Finally, limitations and perspectives are discussed in section 3.4.
2.2
Definition of the generative model
In the sequel, we quantify differences between morphologies by spatial deformations that can be estimated from magnetic resonance images (MRI) through non-linear image registration. A deformation represents either a morphological difference be-tween the anatomies of two subjects or a longitudinal evolution of one subject-specific anatomy. Therefore deformation based frameworks are well suited to define a parametric model of the morphology. Our approach involves a population template morphology which is parametrized by two progression markers: the morphological age and the disease score.
In section 2.2.1, we expose the main ideas behind the definition of our reference parametric space. Then in section 2.2.2, we explain how the morphological evo-lutions are modeled in our framework. Finally in section 2.2.3, we show how we use the deformation framework to model individual morphologies relatively to this reference.
2.2.1 A space of reference morphologies
In deformation based morphometry, a single morphology is classically used to ap-proximate and represent a population. For a set of images {Ik}, we define a common reference image T0, called template. The difference of morphology between the
sub-ject k and the template is modeled with a spatial deformation φk and an intensity noise εk is added in the subject space accounting for local intensity variability.
Therefore the images are modeled as follows: Ik = T0◦ φk+ εk.
In our approach, we want to take into account two major processes that affect the brain morphology over time: the normal aging and the disease evolution. To do so, we model the effects of these processes on the template using a deformation Φ parametrized by two variables that measure the progress of each process: the morphological age λM A and the disease score λDS. The two variables λM A and
λDS can be seen as time variables and are scaled to correspond to years of standard
evolution. In this model, T0 ◦ Φ(λM A, λDS) represents the template morphology
after λM A years of normal aging and λDS years of normalized disease progression.
In the ideal case, the morphological age is equal to the chronological age. There-fore, T0◦Φ(t, 0) represents the morphology of a t years old healthy subject. Similarly T0◦ Φ(t, t0) would be the typical morphology of a AD patient of age t with a disease
duration of t0 years. If one is able to associate an age λ0 to the image T0, and
assumes that this is the image of a healthy subject, then it is natural to enforce Φ(λ0, 0) = Id.
The parametric subspace of images generated like this will be used as a reference: T = {T0◦ Φ(λM A, λDS) for λM A, λDS∈ R} . (2.1)
An initial model of the subject images is then:
Ik= T0◦ Φ(λkM A, λkDS) ◦ φk+ εk,
where λkM A and λkDS are the subject morphological age and disease score, while φk encodes differences specific to the subject morphology. Of course multiple options are available to combine the longitudinal deformation Φ with the subject specific changes φk. Here we write this operation as a right-composition but this choice will be discussed in section 2.2.2 and a similar but symmetrical operation will later be used.
Also, in the reference space, trajectories parametrized by time t 7→ T0 ◦
Φ(λM A(t), λDS(t)) give possible morphological evolutions where the morphological
age and the disease score can be seen as reparametrization of time. In particular, it defines two archetypal trajectories (i.e. ideal models of evolution): the normal aging template trajectory t 7→ T0◦ Φ(t, 0) and the disease specific template trajectory t 7→ T0◦ Φ(λ0, t).
Here, we assume that each progression of the two major processes (aging and disease) can be described with only one parameter. This implies that the evolution of healthy aging is similar for each subject, following the normal aging template tra-jectory, even if the speed of aging may vary from one subject to the other. Similarly, the disease progression is described using a single trajectory and we combine both template trajectories to model pathological evolutions.
2.2.2 Modeling the morphological evolution of the template
In a simplified approach, the template trajectories are assumed to be geodesics in an appropriate deformation space. Geodesics define continuous paths that can be easily parametrized and constrained to allow regularity in time. They can be used to interpolate between two anatomies or to approximate more complex trajecto-ries (Christensen et al.,1994;Wang et al.,2007). In this work, we use the station-ary velocity field (SVF) framework (Arsigny et al.,2006) for its ability to describe complex and realistic diffeomorphic (smooth and invertible) brain deformations in a straightforward manner (Lorenzi et al., 2013). In this framework, the observed anatomical changes are encoded by diffeomorphisms which are parametrized with the flow of SVFs. Within this setting, the metric between deformations is not chosen a priori even if we need a regularization criterion for the registration. To compute a deformation φ we integrate trajectories along the vector field v for a unit of time.
φ(x) = φ1(x) =
Z 1
0
v(φt(x))dt with φ0 = Id.
This relationship is denoted as the group exponential map φ = Exp(v).
By writing Φ(λM A, λDS) = Exp(λM AvA+ λDSvD), we propose a linear model in
the SVF space (i.e. the space of the parameter of the deformations) parametrized by two SVFs vA and vD. In particular, the two template trajectories are then
separately parametrized: vA controls the normal aging template trajectory and vD the disease specific template trajectory.
For each subject, the processes are meant to be intertwined and this can be modeled in different ways depending on the parametrization of the trajectories, for instance a right or a left composition. The proposed linear combination of the parameters provides us a middle ground. Indeed in the SVF setting, the relationship between composition and the linear combination of SVFs is given by the Baker-Campbell-Hausdorff formula (Bossa et al.,2007) and the linear combination of the SVFs is equivalent to alternate between right and left composition with infinitesimal steps.
To sum up, the longitudinal deformation Φ modeling the effects of aging and the disease on a reference morphology T0 is parametrized by two SVFs: vA and vD.
This ideal model generates a surface T of possible images describing the evolution of the template morphology:
T = {T0◦ Exp(λM AvA+ λDSvD) for λM A, λDS ∈ R} . (2.2)
2.2.3 Individual morphological variability and generative model
An individual image is modeled as follows:
Ik = T0◦ Exp((λkM A− λ0)vA+ λkDSvD) ◦ φk+ εk, (2.3)
where the choice of the intensity noise εk is implicitly related to the registration similarity metric. To specify the constraint on φk, we define a subject specific
residual SVF wkr (r stands for residual) such that:
Exp((λkM A− λ0)vA+ λkDSvD) ◦ φk= Exp((λkM A− λ0)vA+ λkDSvD+ wkr).
In this formula, Exp(wkr) is approximately equal to φk given the first order of the
BCH equation between composition and linear combination of SVFs. Moreover, we wish to have the subject specific deformation to encode what cannot be described using the template trajectories. That is why we impose wkr to be orthogonal to both vAand vD.
As we can see in Figure 2.2, the model parametrized by vA and vD allows us
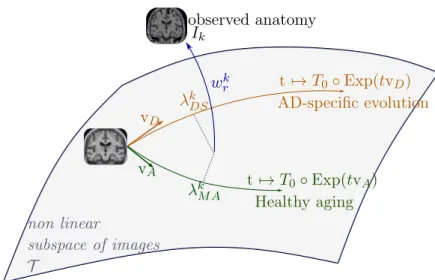
to characterize the subject morphology with two scalar variables, the morphological age λkM A and the disease score λkDS, and a SVF wkr for the subject-specific part. The orthogonality constraint makes the description of the subject uniquely defined. We denote by wk the subject-to-template deformation SVF:
vD vA λkDS λk M A wrk non linear subspace of images T t 7→ T0◦ Exp(tvD) t 7→ T0◦ Exp(tvA) AD-specific evolution Healthy aging observed anatomy Ik
Figure 2.2: Our two-trajectory model. The template image T0, the normal aging template trajectory parametrized by vA and the disease specific template trajec-tory parametrized by vD define a subspace of possible morphologies of reference.
An individual morphology is characterized by a morphological age λkM A, a disease score λkDS, and an SVF wrk modeling the subject-specific part. Each image can be projected onto the template subspace T using a decomposition of the deformation between the image and the template T0.
2.3
Estimation of the model parameters
The model parameters are of two kinds: the population parameters (T0, vAand vD) and the subjects parameters (λkM A, λkDS and wkr). To tackle this joint estimation problem in a computationally efficient way, several assumptions are made:
1. When available, the longitudinal evolution in the template space can be ap-proximated by the transported deformation estimated in the subject space. Parallel transport algorithms are commonly used in the geometrical analysis of longitudinal data. The use of geodesic parallelograms is in general an effi-cient way to bring individual trajectories in a common reference space (Lorenzi and Pennec, 2013). In practice, it allows us to work only with intra-subject deformation to estimate the model population parameters. It simplifies the op-timization and is also more stable as the intra-subject variability is in general smaller than the inter-subject one.
2. We also assume, while estimating the population parameters, that the aging speed and the disease progression speed are constant for all the subjects in the training set.
3. Intra-subject deformations are relatively small and smooth. Consequently, the registration regularization has less impact on the estimated deformation. This consideration allows us to estimate these longitudinal evolutions independently
of the population model.
These assumptions allow us to efficiently decompose the problem of the param-eter estimation. First, subjects with longitudinal data are processed independently and the intra-subject evolutions are modeled in the subject space. Then the popula-tion parameters (T0, vAand vD) are estimated using only intra-subject longitudinal
evolutions. Finally, the subjects’ parameters are estimated.
2.3.1 Estimation of the template trajectories vA and vD in a given
template space
In this section we suppose that we know T0 and that we can compute the subject-to-template deformation wk for a reference time point. We also consider that we have longitudinal data for every subject.
First we address the inverse problem of estimating the intra-subject evolution parameters with the framework proposed by Hadj-Hamou et al. (2016). Images are preprocessed, rigidly aligned to the MNI-152 template and then longitudinally registered. Intra-subject deformations between follow-up images and the baseline image are computed using non-linear registration. The resulting intra-subject model in the subject’s space is estimated using ordinary least square regression in the tangent space of SVFs. It is equivalent to the assumption that the deformation noises are centered, uncorrelated and have equal variance in the space of SVFs.
Then for a given template T0and subject-to-template deformation wk, the intra-subject model can be transported using parallel transport in the template space to get vk. This deformation can be decomposed along the template trajectories giving a morphological aging rate (noted skM A), a disease progression rate (noted skDS) and an orthogonal component (noted vkr):
vk = skM AvA+ skDSvD + vkr.
These progression rates are strongly related to the evolution of the morphological age and of the disease score (in a ideal euclidean case skM A= dλkM A/dt and skDS = dλkDS/dt) and they will be used to normalize the speed of evolution. The estimation is done on two groups of subjects: a group Gh composed by healthy subjects and a
group Gad composed by patients diagnosed with AD. We assume that each healthy subject of Gh is aging at normal speed skM A = 1, ∀k ∈ Gh and does not have any
evolution toward the disease skDS = 0, ∀k ∈ Gh. Similarly, each patient of Gad has
a normal morphological aging rate skM A = 1, ∀k ∈ Gad and a constant unit disease
progression rate skDS = 1, ∀k ∈ Gad. Finally the subject specific components are
assumed to be centered, uncorrelated and to have a fixed variance. The maximum likelihood problem writes:
min vA,vD X k∈Gh kvk− v Ak2+ X k∈Gad kvk− v A− vDk2. (2.5)
Data: an image I, a template image T and linear space of SVF T Result: two SVFs: wt∈ T , wr ∈ T⊥ wt= 0 ; repeat wr= registration(T ◦ Exp(wt), I) ; wt= wt+ projT(wr); until wr⊥ T ;
Algorithm 1: Iterative registration algorithm
The solution of the optimization problem is explicit: ˆ vA= 1 |Gh| X k∈Gh vk, (2.6) ˆ vD = 1 |Gad| X k∈Gad vk − ˆvA. (2.7)
We should however note that kˆvAk (resp. kˆvDk) is a biased estimator of kvAk (resp.
kvDk). We detail the bias estimation in the Appendix2.6.2.
2.3.2 Estimation of the template morphology T0
The population specific template morphology is computed using the algorithm pro-posed by Guimond et al. (2000) by alternating the registration of subject images to the template and the recomputation of the template intensities. However, in our approach, the subjects’ images do not need to be registered to T0 directly but to their projection on the template space. To tackle this problem, we propose an iterative procedure where we register the image to its current projection on the reference space. Algorithm 1 details the procedure with simplified notations in the general case where w parametrizes the deformation between the image I and T . The reference linear subspace of SVF is denoted T and w is decomposed accord-ingly w = wt+ wr with wt ∈ T , wr ∈ T⊥. The registration regularization should
only be applied to the residual part wr. In the context of the LCC-demons
regis-tration algorithm, it boils down to the following minimization problem (seeLorenzi et al.,2013):
min
wt∈T ,wr∈T⊥,w0
Sim(I, T, Exp(wt+ wr)) + Dist(wr, w0) + Reg(w0).
The idea is to alternate between the optimization and the projection on the con-straints.
Since we do not have any theoretical guarantee on the convergence of the al-gorithm, the stability and the convergence will be evaluated empirically. As the template estimation also involves iterative search, we can combine both algorithms for a faster optimization. The projection coordinates are kept from one iteration to the next and the images are registered to their estimated projections in the template
Data: a set of images (Ik) and a linear space of SVF T
Result: a template image T , a set of pairs of SVFs (wkt, wrk) wtk= 0 for all k;
initialize T ; repeat
wrk= registration(T ◦ Exp(wtk), Ik) for all k;
u = mean(wkr) ;
T = mean(Ik◦ Exp(−wrk+ u)) ;
wtk= wkt + projT(wrk− u) for all k; until convergence;
Algorithm 2: Iterative template space estimation algorithm
space. The deformation update u is then computed and finally the new atlas image T and the estimated projections are updated (see Algorithm 2).
In this work, the intra-subject models are transported to the template space to update the template trajectories parametrizing T at each iteration (using the approach described in the previous section 2.3.1). T is initialized using the MNI-152 template and the convergence is manually assessed comparing the template for successive iterations. At convergence, we obtain the template image T0 and both template trajectories vA and vD.
2.3.3 Estimation of the subject’s parameters
When the population parameters are learned, the estimation of the individual pa-rameters for a new subject is relatively simple. The deformation wkis computed by registration between a subject image and the template using Algorithm1, and then linearly decomposed, wk = (λkM A− λ0)vA+ λkDSvD + wrk, by solving the following
linear system:
wk· vA= kvAk2(λkM A− λ0) + vD· vAλkDS, (2.8)
wk· vD = vD· vA(λkM A− λ0) + kvDk2λkDS. (2.9)
In practice, the estimation is not exact because we work with the noisy estimators ˆ
vAand ˆvD. The linear decomposition can also be computed locally or by using any
voxel weighting scheme for the scalar product. When longitudinal data is available, this estimation is independently done for each time point.
2.4
Results
2.4.1 Experiments with synthetic data
We first evaluate our approach using synthetic data in order to assess the accuracy and the reproducibility of the biomarkers estimation. Realistic longitudinal MRIs are simulated using the software proposed byKhanal et al. (2016). The simulation
algorithm relies on a biophysical model of brain deformation and can be used to generate longitudinal evolutions with specific atrophy patterns. In this context, local atrophy is measured by the divergence of the stationary velocity field.
2.4.1.1 Simulated dataset
In this controlled experiments we choose to simulate two populations that are char-acterized by their atrophy patterns and that respectively emulate healthy controls and AD patients. Atrophy of the aging brain and the effect of AD have been exten-sively studied (Pini et al.,2016) and the atrophy measurements may vary depending on the methodology and the population studied. In this experiment, we choose to prescribe piecewise-constant atrophy map with constant value in brain areas delim-ited by the segmentation provided by FreeSurfer (Fischl et al., 2002). For every subject, the atrophy value of a region is sampled around a fixed population mean with an additive Gaussian noise of relative standard deviation of 5% . The healthy population is designed to have a small atrophy in the whole brain while the patients have a stronger atrophy especially in the hippocampal areas and the temporal poles. The means are chosen to give the order of magnitude of a one year evolution accord-ingly to what was reported inFjell et al.(2010) for healthy aging and inCarmichael et al. (2013), with an additional scaling for the pathological evolution. We detail the exact regional values in Table 2.2in the appendix (see2.6.1).
Structural MRIs of 40 healthy subjects from the ADNI database are taken as input to the simulations. For every subject, deformations are simulated for both pathological and healthy settings. The deformation extrapolated 5 times is then applied to the original image in order to simulate 5 years long evolutions. We then have two matched populations of 40 pairs of images.
2.4.1.2 Model estimation
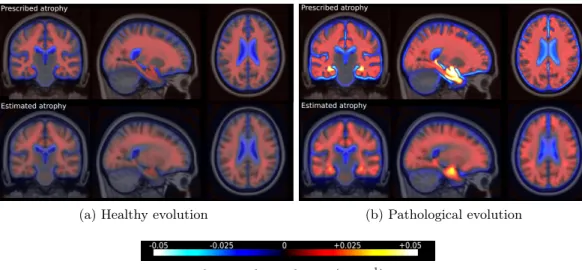
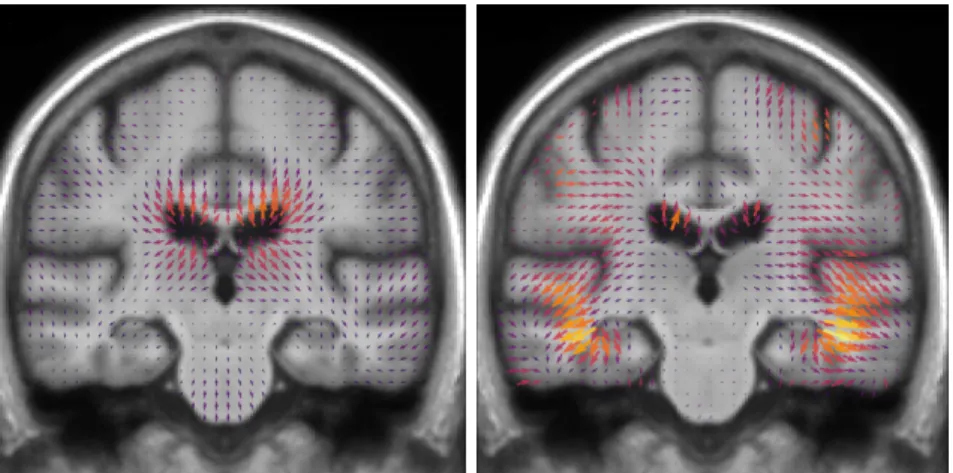
Individual longitudinal deformations are computed using registration, and the ref-erence anatomy and the template trajectories are built using our framework. The divergence fields associated with these template trajectories can be compared to the prescribed atrophy. Figure 2.3 shows the average atrophy maps in the estimated template anatomy.
The estimated atrophy patterns are smoothed versions of the simulated ground truth. This effect was already observed (Khanal et al., 2016). First of all, the reg-istration algorithm is unaware of the underlying simulation model and is unable to localize precisely the atrophy in homogeneous areas. Moreover, the spatial regular-ization of the registration and the parametrisation using SVFs also contribute to the smoothness of the estimated atrophy patterns. This is particularly visible in small (hippocampus) or thin regions (cortex). We therefore have a consistent bias when the atrophy measurements are integrated over the regions (see Figure 2.14 in ap-pendix). Indeed, the local atrophy is affected by neighboring regions evolving in the opposite direction (the ventricles or the CSF for example). However, we can see that
(a) Healthy evolution (b) Pathological evolution
relative volume change (year−1)
Figure 2.3: Simulated and estimated atrophy patterns in the template space. Top row: mean in the template space of the prescribed atrophy maps. Bottom row: atrophy maps estimated from the simulated images. Left: healthy simulations. Right: pathological simulations. The estimations are smoother but qualitatively similar to simulated maps.
the ratio between the pathological and healthy cases is conserved in every region. It was already noted that quantitative estimation using registration can be biased but can be more reproducible than the segmentation based approaches (Hadj-Hamou,
2016;Cash et al.,2015).
2.4.1.3 Imaging biomarkers estimation
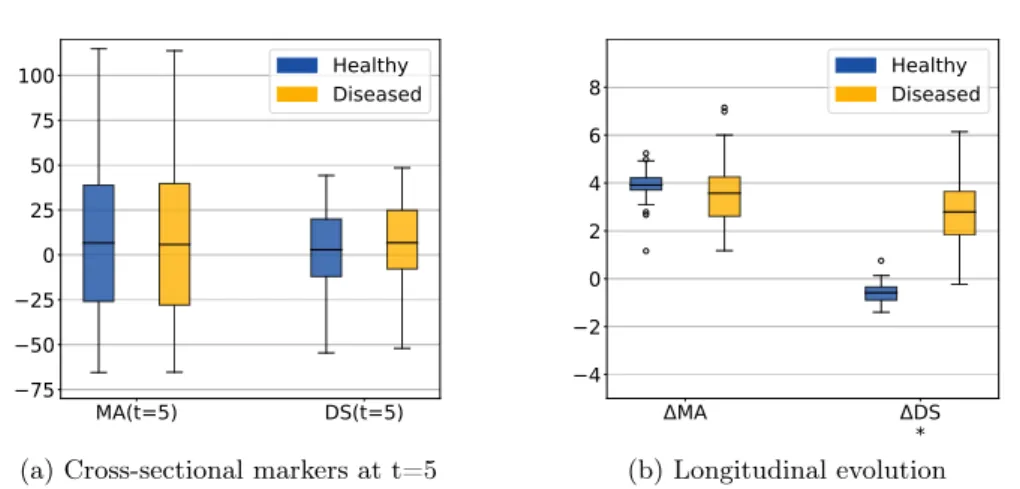
The morphological age and the disease score were computed for each image. By construction there is no difference at t=0 (exactly the same images in the two groups). We compare the simulated differences at t=5 and the evolution of the cross-sectional assessments for each subject (see Figure 2.4a).
In this experiment, the initial anatomical variability is important, indeed the standard deviation at t=0 is equal to 48 years for MA(0) and 24 years for DS(0). At t=5, a difference is visible for the disease score but it is still diluted in the inter-subject variability. It is also possible to extrapolate the evolution to determine how many years of evolution are needed in order to get a significant difference between the healthy and the disease groups. For a significance level of 0.05, the disease score would be significantly discriminant after 13 years of evolution. This figure for synthetic data highlights the slow time-pace of the disease and the interest in modeling and extrapolating the evolutions.
Looking at the evolution of these cross-sectional biomarkers in Figure 2.4b), we see that the measures are relatively stable despite the large inter-subject variability
MA(t=5) DS(t=5) 75 50 25 0 25 50 75 100 Healthy Diseased
(a) Cross-sectional markers at t=5
MA DS * 4 2 0 2 4 6 8 HealthyDiseased (b) Longitudinal evolution
Figure 2.4: Evolution of the imaging biomarkers estimated on simulated data. MA=morphological age, DS=disease score. The longitudinal evolutions ∆MA and ∆DS are the differences between the two cross-sectional assessments i.e. ∆MA = MA(5) - MA(0). The star indicates that the difference between the healthy and the diseased subjects is significant (p-value < 0.05) for the unpaired t-test. By con-struction there is no difference between the two populations at t=0. The changes are generally underestimated but the longitudinal evolutions show the stability of the estimation despite a strong inter-subject variability.
and that the difference measured between two different time points gives a good estimate of the longitudinal evolution. In practice the estimations are slightly biased, for example the increase of morphological age ∆M A = M A(5) − M A(0) is expected to be equal to 5 for both populations while the the mean of the estimation is equal to 3.92 for the healthy group and to 3.57 for the patients group. More importantly, the standard deviation is small in comparison to the standard deviation of the cross-sectional measurement (σ∆M A = 1.13 while σM A(0) = 47.8). For the change of
disease score ∆DS, the mean is equal to −0.6 for the healthy group and 2.8 for the patients group and it approximates the ideal expected values (respectively 0 and 5). The variance is also very small with respect to the cross-sectional one. In particular the difference between healthy and diseased subjects is clearly observed for the longitudinal evolution: the difference between the means is equal to 3.2 standard deviation for ∆DS. To summarize, the cross-sectional measurement gives a relatively stable assessment of the aging and disease progression and the markers’ evolution is strongly associated with the clinical diagnosis. Our generative model is able to explain most of the independently simulated changes.
2.4.2 Experiments on ADNI data
Longitudinal T1 sequences were obtained from the Alzheimer’s Disease National Initiative (ADNI) database. The ADNI was launched in 2003 with the primary goal to test whether magnetic resonance imaging (MRI), positron emission tomography