HAL Id: hal-02333039
https://hal.sorbonne-universite.fr/hal-02333039
Preprint submitted on 25 Oct 2019HAL is a multi-disciplinary open access
archive for the deposit and dissemination of sci-entific research documents, whether they are pub-lished or not. The documents may come from teaching and research institutions in France or abroad, or from public or private research centers.
L’archive ouverte pluridisciplinaire HAL, est destinée au dépôt et à la diffusion de documents scientifiques de niveau recherche, publiés ou non, émanant des établissements d’enseignement et de recherche français ou étrangers, des laboratoires publics ou privés.
beneficial interactions
Bertille Burgunter-Delamare, Hetty Kleinjan, Clémence Frioux, Enora Fremy,
Margot Wagner, Erwan Corre, Alicia Le Salver, Cédric Leroux, Catherine
Leblanc, Catherine Boyen, et al.
To cite this version:
Bertille Burgunter-Delamare, Hetty Kleinjan, Clémence Frioux, Enora Fremy, Margot Wagner, et al.. Metabolic complementarity between a brown alga and associated 1 cultivable bacteria provide indications of beneficial interactions. 2019. �hal-02333039�
Metabolic complementarity between a brown alga and associated
1cultivable bacteria provide indications of beneficial interactions.
2Bertille Burgunter-Delamare1†, Hetty KleinJan1‡†, Clémence Frioux2, Enora Fremy2, Margot 3
Wagner2, Erwan Corre3, Alicia Le Salver3, Cédric Leroux3, Catherine Leblanc1, Catherine 4
Boyen1, Anne Siegel2, Simon M. Dittami1* 5
1
Sorbonne Université, CNRS, Integrative Biology of Marine Models (LBI2M), Station Biologique 6
de Roscoff, 29680 Roscoff, France 7
2
Univ Rennes, Inria, CNRS, IRISA, Rennes F-35000, France 8
3
Sorbonne Université, CNRS, FR2424, Station Biologique de Roscoff, 29680, Roscoff, France 9
‡ present address: CEBEDEAU, Research and Expertise Center for Water, Allée de la découverte, 11 10
(B53), Quartier Polytech 1, B-4000, Liège, Belgium. 11
† These authors contributed equally to this study. 12 * Correspondence: 13 Corresponding Author 14 simon.dittami@sb-roscoff.fr 15
Keywords: Ectocarpus siliculosus, symbiotic/mutualistic bacteria, genome-scale metabolic 16
networks, metabolic complementarity, holobiont 17
Abstract: 18
Brown algae are key components of marine ecosystems and live in association with bacteria that are 19
essential for their growth and development. Ectocarpus siliculosus is a genetic and genomic model 20
for brown algae. Here we use this model to start disentangling the complex interactions that may 21
occur between the algal host and its associated bacteria. We report the genome-sequencing of 10 22
alga-associated bacteria and the genome-based reconstruction of their metabolic networks. The 23
predicted metabolic capacities were then used to identify metabolic complementarities between the 24
algal host and the bacteria, highlighting a range of potentially beneficial metabolite exchanges 25
between them. These putative exchanges allowed us to predict consortia consisting of a subset of 26
these ten bacteria that would best complement the algal metabolism. Finally, co-culture experiments 27
were set up with a subset of these consortia to monitor algal growth as well as the presence of key 28
algal metabolites. Although we did not fully control but only modify bacterial communities in our 29
experiments, our data demonstrated a significant increase in algal growth in cultures inoculated with 30
the selected consortia. In several cases, we also detected, in algal extracts, the presence of key 31
metabolites predicted to become producible via an exchange of metabolites between the alga and the 32
microbiome. Thus, although further methodological developments will be necessary to better control 33
and understand microbial interactions in Ectocarpus, our data suggest that metabolic 34
complementarity is a good indicator of beneficial metabolite exchanges in holobiont. 35
1 Introduction 36
Microbial symbionts are omnipresent and important for the development and functioning of 37
multicellular eukaryotes. Together the eukaryote hosts and their microbiota form meta-organisms 38
also called holobionts. Elucidating the interactions within microbial communities and how they affect 39
host physiology is a complex task and requires an understanding of the dynamics within the 40
microbiome and the host, as well as of possible inter-species interactions and/or metabolic exchanges 41
that could occur between the partners. One way to dissect those interactions is via targeted co-culture 42
experiments using culturable bacteria. This approach works particularly well for 1:1 or 1:2 43
interactions, but as the number of potentially interacting organisms increases, selecting the “right” 44
bacterial consortia becomes a major bottleneck (Lindemann et al. 2016). 45
Metabolic complementarity has previously been proposed as an indicator for potentially beneficial 46
host-symbiont interactions and can be assessed in silico using the metabolic networks of the host and 47
the microbiota (Dittami, Eveillard, et al. 2014; Levy et al. 2015). Common examples of metabolic 48
complementarity are associations of autotrophic and heterotrophic organisms such as corals and their 49
photosynthetic symbionts (Rohwer et al. 2002), or algae, and their heterotrophic bacterial biofilm 50
(Wahl et al. 2012). In this case, the autotrophic partner has a metabolic capacity (photosynthesis) that 51
allows for the production of metabolic intermediates (organic carbon), which can be further 52
metabolized by the heterotrophic partners. However, especially in systems with long-lasting 53
interactions more complex metabolic interdependencies are likely to evolve (e.g. Amin et al. 2015). 54
As a tool to further explore such interactions, Frioux et al. (Frioux et al. 2018) have proposed the 55
pipeline MiSCoTo. Given the metabolic networks of a host and several symbionts, this tool predicts 56
potential metabolic capacities of one partner that could be unlocked by a contribution of a metabolite 57
from another (e.g. the provision of carbohydrates by a photosynthetic organism unlocking the 58
biochemical processes related to primary metabolism in heterotrophs). Furthermore, this 59
computational approach uses these complementarities to define minimal consortia (i.e. with the 60
lowest possible number of exchanges/contributors) allowing the host to reach its maximum metabolic 61
potential. However, the actual predictive value of these models, both in terms of the effect on host 62
growth and fitness, and in terms of the metabolic scope (i.e. the metabolites producible by the 63
holobiont system), remains to be assessed. 64
Here we have applied the MiSCoTo tool to the filamentous brown alga Ectocarpus siliculosus, a 65
model filamentous brown alga with an available metabolic network (Prigent et al. 2014), as well as a 66
selection of 10 Ectocarpus-derived bacteria (KleinJan et al. 2017). We then selected specific minimal 67
microbial consortia for in vivo testing of the proposed hypotheses (growth rate, production of specific 68
metabolites). Our results demonstrate a clear positive effect of inoculation with the predicted 69
bacterial consortia on algal growth as well as an effect on the production of algal metabolites 70
predicted to depend on bacterial contributions. In vivo observations largely corresponded to in silico 71
predictions despite the incomplete input data (with models limited to annotated pathways) and the 72
fact that we had only limited control of the microbiome. The present work thus generates numerous 73
testable hypotheses on specific beneficial interactions between Ectocarpus and its microbiome, but 74
also provides a proof of concept for the overall predictive power of network-based metabolic 75
complementarity for beneficial host-microbe interactions. 76
2 Methods
77
2.1 Bacterial cultures and genome sequencing 78
Ten bacterial strains were selected from the 46 isolated by KleinJan et al. from Ectocarpus subulatus 79
(KleinJan et al. 2017). They were grown in liquid Zobell and/or diluted R2A until bacterial growth 80
was visible with the naked eye (~3 days at room temperature), and their identity was confirmed by 81
sequencing of the 16S rRNA gene with the primers 8F and 1492R (KleinJan et al. 2017). Bacterial 82
DNA was extracted using the UltraClean® Microbial DNA isolation kit (MoBio, Qiagen, Hilden, 83
Germany) and used for standard pair-end sequencing at the GENOMER platform (FR2424, Station 84
Biologique de Roscoff), using Illumina Miseq technology (V3 chemistry, 2x300bp). After cleaning 85
with Trimmomatic v0.38, default parameters (Bolger et al. 2014), the paired-end reads were 86
assembled using SPADES v3.7.0 (Bankevich et al. 2012; default parameters for long reads). The 87
RAST/SEED server (Aziz et al. 2008) was used for gene annotation, and sequences were later also 88
incorporated into the MAGE platform (Vallenet et al. 2006). 89
2.2 In silico predictions of metabolic interactions and selection of consortia
90
Bacterial metabolic networks were constructed using Pathway Tools version 20.5 (Karp et al. 2016) 91
and version 2 of the Ectocarpus siliculosus EC32 metabolic network for the host, prior to any gap-92
filling step, in order to prevent the presence of possibly false positive reactions in the model. 93
(because these false positive reactions could hide algal bacterial interactions). This network 94
comprised a total of 2,118 metabolites, 1,887 metabolic reactions, and was able to produce five of the 95
50 metabolites known to be a part of the Ectocarpus biomass (Aite et al. 2018) with only the culture 96
medium as input. For the remaining 45 compounds the lack of producibility can be explained by the 97
presence of metabolic gaps – either because a reaction was missed during the reconstruction of the 98
network (missing annotation etc.), or because the corresponding pathways require metabolite 99
exchanges with other partners in the environment, e.g. bacteria. The more such gaps can be filled by 100
exchanging compounds between two metabolic networks, the higher we consider the degree of 101
metabolic complementarity between the corresponding organisms. 102
Here we used the MiSCoTo tool (Frioux et al. 2018) to compute such potential metabolic exchanges 103
between Ectocarpus and any of the ten targeted bacteria. The underlying model of MiSCoTo 104
assumes that a compound is producible by a host-symbiont community if there is a chain of 105
metabolic reactions which transforms the culture medium into the expected compound without taking 106
into consideration flux accumulations or competition for resources, and allowing for the exchange of 107
compounds across cell boundaries. These simplifications imply that compounds predicted to be 108
producible in silico may, in some cases, remain unproducible in vivo, although the consortium has all 109
the genes to activate the pathways. 110
In this study MiSCoTo was run twice, first to determine the scope of all algal compounds that 111
become producible via exchanges with all 10 bacterial genomes together, and as second time to select 112
minimal bacterial consortia for the production of these compounds. In both cases the Provasoli 113
culture medium was used as a source as defined previously (Prigent et al. 2014). 114
2.3 Algal cultures 115
Two of the six predicted bacterial consortia were tested experimentally via algal-bacterial co-culture 116
experiments. Additionally, each member of the two consortia was tested individually, as well one 117
other sequenced strain that was not part of any of the predicted minimal consortia, i.e. Sphingomonas 118
sp. 391. Ectocarpus siliculosus (strain 32; accession CCAP 1310/4, origin San Juan de Marcona, 119
Peru) was cultured under standard conditions (13 °C; 12h light regime) in Provasoli-enriched natural 120
seawater until the start of antibiotic treatment. Prior to co-culture experiments, algal filaments were 121
treated with a mixture of the following liquid antibiotics: 45 μg/ml Penicillin G, 22.5 μg/ml 122
streptomycin, and 4.5 μg/ml chloramphenicol dissolved in Provasoli-enriched artificial seawater 450 123
mM Na+, 532 mM Cl-, 10 mM K+, 6 mM Ca2+, 46 mM Mg2+, 16 mM SO42-. Filaments were exposed
124
to 25 ml of this solution for 3 days and then placed in Provasoli-enriched artificial seawater for 3 125
days to recover. The absence of bacteria on the algal surface was verified by microscopy using phase-126
contrast (Olympus BX60, 1.3- PH3 immersion objective, 800x magnification) and by plating of algal 127
filaments on Petri dishes with Zobell medium followed by three weeks of incubation at room 128
temperature. 129
2.4 Co-culture experiments 130
For co-culture experiments, cell densities of bacterial cultures were determined using a BD FACS 131
CantoTM II flow cytometer (BD Bioscience, San Jose, CA) using samples fixed in Tris-EDTA. 132
Before the start of the experiment, antibiotic-treated algae (three replicate cultures per condition) 133
were inoculated with 2.3*105 bacterial cells per strain and ml medium. Each co-culture was then 134
incubated for 4 weeks under standard algal growth conditions (see above). During this time, algal 135
growth was quantified by measuring the filament length of the algae each week using the binocular 136
microscope (3 measurements per replicate). Furthermore, bacterial abundance in the algal growth 137
medium was estimated using flow cytometry (described above) and bacteria attached to algal cell 138
walls were counted by microscopy (5x 10 μm long filaments observed per biological replicate, 800x 139
magnification in phase contrast). At the end of the experiment, general algal morphology was 140
observed using a LEICA DMi8 microscope and in parallel, remaining algal tissues were frozen in 141
liquid nitrogen and freeze-dried for downstream analyses. Two controls (three replicates each) were 142
run in parallel: a non-antibiotic treated positive control (CTRL w/o. ATB), and an antibiotic-treated 143
non-inoculated alga as a negative control (CTRL w. ATB). 144
2.5 Bacterial community composition after co-culture experiments 145
A metabarcoding approach was implemented to investigate the composition of the bacterial 146
community after the co-culture experiments. For each culture, 20 mg ground freeze-dried tissue 147
(TissueLyserII Qiagen, Hilden, Germany; 2x45sec, 30 Hz) was used for DNA extraction (DNeasy 148
Plant Mini Kit, Qiagen; standard protocol). Nucleotide concentrations were verified with 149
NanodropONE (Thermofisher Scientific). A mock community comprised of DNA from 32 bacterial 150
strains (covering a variety of taxa) as well as a negative control were included in addition to the 151
samples (see Thomas et al. in prep. for details). Libraries were prepared according to the standard 152
Illumina protocol for metabarcoding MiSeq technology targeting the V3–V4 region (Illumina 2017) 153
and sequenced using Illumina MiSeq Technology (2x300 bp, pair-end reads; MiSeq Reagent v3 kit; 154
Platform de Séquencage-Génotypage GENOMER, FR2424, Roscoff). 155
Resulting raw sequences (7,354,164 read pairs) were trimmed using fastq_quality_trimmer from the 156
FASTX Toolkit (quality threshold 30; minimum read length 200) and assembled into 6,804,772 157
contigs using PandaSeq v2.11 (Masella et al. 2012). Data were analyzed with Mothur (V.1.40.3) 158
according to the MiSeq Standard Operating Procedures (Kozich et al. 2013). Contigs were pre-159
clustered (allowing for four mismatches), and aligned to the Silva_SEED 132b database for sequence 160
classification. Chimeric sequences were removed (Vsearch) and the remaining sequences classified 161
taxonomically (Wang et al. 2007). Non-bacterial sequences were removed and the remaining 162
sequences were then clustered into operational taxonomic units (OTUs) at a 97% identity level and 163
each OTU was classified to the genus level where passible (Wang et al. 2007). All OTUs with n ≤ 10 164
sequences were removed resulting in a final data matrix with 1,834,992 sequences. The OTU matrix 165
was subsampled to have the same number of sequences per sample for downstream analyses. 166
2.6 Targeted metabolomics 167
Seven metabolites predicted to be producible by the algae only in presence of metabolic exchanges 168
with specific bacteria were selected for targeted metabolite profiling after manual verification of 169
automatic predictions of corresponding pathways in the algal and bacterial networks and based on 170
their biological importance for the alga: L-histidine, putrescine, beta-alanine, nicotinic acid, folic 171
acid, auxin, and spermidine. Metabolites were extracted from 10 mg of ground, freeze-dried tissue 172
using a triple extraction protocol based on the method of Bligh and Dyer (1959): two ml of 173
methanol:chloroform:water (6:4:1) were used as first extraction solvent, then the remaining pellet 174
was extracted with 1 ml of chloroform:methanol (1:1), and finally, a 3rd extraction was performed 175
using 1ml of H2O. The supernatants of each extraction were pooled and evaporated under a stream of
176
nitrogen. The residue was then resuspended in 100 μl methanol:water (1:1) and analyzed on an 177
ACQUITY Ultra-performance convergence chromatography (UPC²) system (Waters®, Milford, 178
USA) equipped with a Viridis BEH column (3x100 mm, 1.7 μm). A linear gradient of two solvents 179
was used to separate peaks: supercritical carbon dioxide (Solvent A), and methanol spiked with 0.1% 180
formic acid (Solvent B). The gradient ran from 5% to 25% of solvent B (35% for spermidine and 181
nicotinic acid) during 2 minutes, was kept at this level for another 2 minutes and then gradually 182
reduced back to 5% during 3 minutes. The UPC² system was coupled to a Xevo G2 Q-Tof mass 183
spectrometer (Waters), operating in positive ESI ion mode (m/z 20–500). Blanks, as well as 184
standards of all 7 compounds obtained from Sigma-Aldrich (St. Louis, MO, USA), were run in 185
parallel to samples. The resulting chromatograms were then used to examine the presence/absence of 186
the target compounds in the other samples based on retention time and the mass spectra. Analyses 187
were performed at the METABOMER platform (FR2424, Station Biologique de Roscoff). 188
2.7 Statistical analyses 189
Growth data (both algal and bacterial) were confirmed to follow a normal distribution using a 190
Shapiro-Wilk test (Rstudio v1.0.44). Significant differences between all treatments after four weeks 191
of co-culture (day 28) were calculated with an ANOVA and a Tukey honestly significant difference 192
(HSD) post-hoc test with a significance level α 0.05 using the PAST software version 3.20 (Hammer 193
et al. 2001). 194
3 Results 195
3.1 Predicted metabolic interactions and selection of beneficial bacterial consortia 196
Genome sequencing and subsequent bioinformatics analyses yielded bacterial genome assemblies 197
with sufficient coverage and 11-72 scaffolds per genome Table 1). Metabolic networks were then 198
reconstructed for these ten genomes. On average, 1,714 reactions, 111 transport reactions, and 1,405 199
metabolites (Table 2) were predicted per bacterium. These reactions belonged, again on average, to 200
261 pathways, 137 of which were complete and 124 were incomplete (i.e. missing one or more 201
reactions). Based on metabolic complementarity analysis carried out using MiSCoTo, these bacterial 202
networks were predicted to enable the production of 160 additional compounds with the algal 203
networks, including several polyamines (Cadaverine, Spermidine, Agmatine), amino acids (Histidine, 204
Tyrosine, beta-alanine), vitamins B3, B9, and E, several lipids and lipid derivatives, and nucleic 205
acids. Please refer to Supplementary Table S1 for a complete list of compounds. Many of these 206
compounds were also previously predicted via the metabolic interaction between the same strain of 207
E. siliculosus and the associated bacterium Candidatus Phaeomarinobacter ectocarpi (Dittami, 208
Barbeyron, et al. 2014; Prigent et al. 2017). A total of six bacterial consortia comprising three 209
bacterial strains each (Table 3) were predicted to be sufficient to enable the production of all of these 210
compounds. Of these six proposed consortia, two comprising one phylogenetically distinct bacterium 211
each (i.e. the Bacteriodetes Imperialibacter vs the Gammaproteobacterium Marinobacter) were 212
chosen for in vivo testing using algal-bacterial co-cultures. 213
3.2 Growth rates in co-culture experiments 214
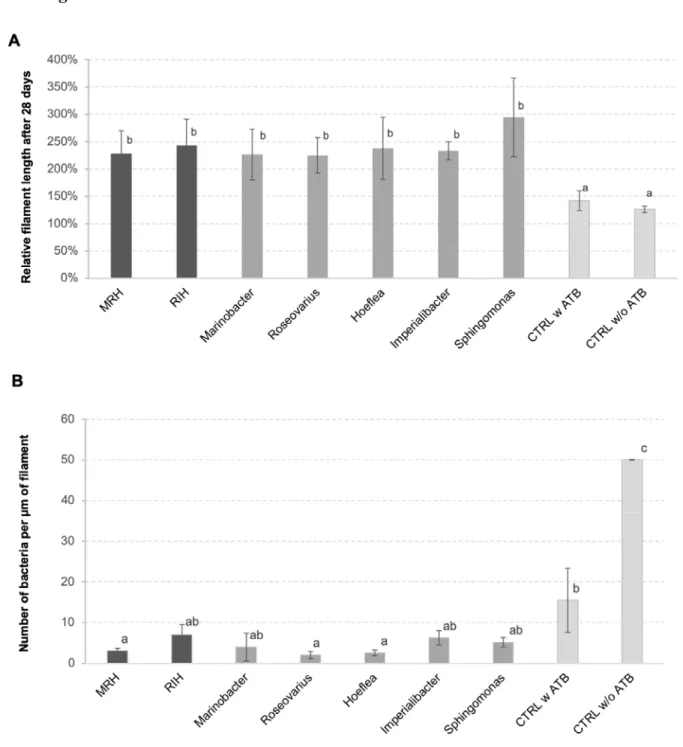
The inoculation with one or several bacterial strains significantly enhanced algal growth by a factor 215
of 2 compared to controls (Figure 1A). This positive effect was observed both for the predicted 216
bacterial consortia and for all the individual strains tested. At the same time, the abundance of 217
bacteria on algal filaments after four weeks of cultivation was significantly lower in cultures initially 218
inoculated with bacteria compared to both controls with and without initial antibiotic treatment 219
(Figure 1B), although bacterial cell counts in the medium were similar between co-culture 220
experiments and the non-inoculated control after 28 days (Supplementary Figure S1). 221
3.3 Bacterial impact on morphology 222
Compared to the negative control, which exhibited a ball-like morphology typical for “axenic” 223
cultures (Tapia et al. 2016), all bacterial inocula tested resulted in filamentous thalli with clear 224
branching patterns (Figure 2). We furthermore observed differences in the branching patterns 225
depending on the bacterial inocula. For example, Sphingomonas-inoculated cultures produced 226
relatively long filaments with few branching sites (Figure 2H), whereas Hoeflea-inoculated cultures 227
produced filaments with frequent branching (Figure 2E). Imperialibacter induced aggregation of 228
individual filaments (Figure 2F), while in all other co-cultures, filaments remained more or less 229
separated. These differences were, however, difficult to quantify given complexity of their 230
morphology. 231
3.4 (Algal) metabolome in co-culture conditions 232
Seven putatively key metabolites (l-histidine, putrescine, beta-alanine, nicotinic acid, folic acid, 233
auxin, and spermidine) predicted to be non-producible by the alga alone but producible via exchanges 234
with some bacterial consortia, were quantified in algal tissues by UPC2-MS after four weeks of co-235
culture. The presence/absence of these metabolites is shown in Figure 3, comparing both the 236
predicted producibility by metabolic network analysis and the experimental UPC2-MS results. In the 237
negative control, i.e. antibiotic-treated algae that were not inoculated with bacteria, none of the 238
compounds could be identified by UPC2-MS confirming the computational predictions. In contrast, 239
in all co-cultures, at least one target compound was experimentally detected. Furthermore, each 240
compound became producible in at least one of the co-cultures. Overall, across the 56 predictions 241
made based on the metabolic networks (7 metabolites x 8 consortia including the individual bacteria 242
and the negative control) in silico and in vivo data agreed in 28 cases (Figure 3). Only in four cases 243
did we observe the presence of a metabolite although it was not predicted by the networks. Finally, in 244
24 cases we did not detect the presence of a metabolite predicted to be producible in the co-cultures. 245
3.5 Bacterial community composition after co-culture experiments 246
The bacterial community composition of each sample was analyzed by 16S rDNA metabarcoding at 247
the end of the co-culture experiments. This was done to verify if the bacteria inoculated had grown in 248
the co-cultures and to determine to what extent other bacteria were present and affected by the 249
inoculations. The results (Table 4) show that, except for Imperialibacter, all of the bacterial strains 250
inoculated were detected in the corresponding co-cultures 28 days after inoculation. However, except 251
for Marinobacter and Hoeflea, read abundances of these strains were low compared to the total 252
number of reads. In parallel, several other OTUs that had not been inoculated were detected in our 253
co-culture experiments, suggesting that these bacteria were at least partially resistant to or protected 254
from (e.g. within the cell wall) the antibiotic treatments applied, and were able to recover under the 255
experimental conditions: in total 30 additional OTUs with a minimal abundance of 1% of total reads 256
were detected in our samples, accounting for 63 to 82% of the total reads. Furthermore, Hoeflea reads 257
were dominant in all samples including the non Hoeflea-inoculated cultures (14-30% of total reads). 258
4 Discussion 259
Metabolic complementarity, a powerful metric despite limitations 260
Metabolic complementarity intuitively seems like an excellent marker for beneficial metabolic 261
interactions. The more organisms are complementary at the metabolic and by extension the gene 262
level, the more they can potentially benefit from each other (Levy et al. 2015); the more they overlap 263
in terms of metabolic pathways, the more likely they are to compete for the same resources (Kreimer 264
et al. 2012). There are, however, two important restrictions that limit the applicability of this simple 265
idea. First, the possibility of a beneficial exchange does not necessarily mean that it will occur, 266
because this may require the presence and activation of excretion/uptake mechanisms in both 267
partners, e.g. via chemical or environmental cues. Secondly, the genome-scale metabolic models used 268
to predict metabolic complementarities may be partially erroneous and incomplete. For instance, 269
metabolic networks frequently do not comprise interactions of chemical signals with receptor 270
molecules, which may be key to regulate interactions (Zhou et al. 2016; Wang et al. 2018). 271
Furthermore, in many cases, they are based on automatic predictions and annotations of protein 272
sequences, which may, in some cases, miss genes or introduce overpredictions of functions (Schnoes 273
et al. 2009). In this paper, we provide first in vivo tests of host-microbe interactions inferred from 274
genome-based predictions of metabolic complementarity. Despite the aforementioned restrictions and 275
simplifications, our results discussed below provide a strong indication that, genome-based 276
predictions of metabolic complementarity is a powerful tool to handle the complexity of host microbe 277
systems and to generate hypotheses on their interactions. 278
Similar complementarities found across studies and Ectocarpus symbionts. 279
Compared to a previous analysis of metabolic complementarity between Ectocarpus and another 280
associated bacterium, Candidatus Phaeomarinobacter ectocarpii, (Dittami, Barbeyron, et al. 2014; 281
Prigent et al. 2017), newly producible compounds predicted in this study were largely similar, 282
notably regarding polyamines, histidine, beta-alanine, and auxin. This similarity persists even though 283
metabolic complementarity analyses were performed using MiSCoTo, which incorporates the notion 284
of different compartments minimizing the number metabolite exchanges (Frioux et al. 2018) and 285
despite the fact that different bacteria were examined. The main difference compared to the previous 286
study is that numerous additional compounds were predicted to be exchanged, which can be 287
explained by the fact that ten rather than one bacterial network were available to complete the algal 288
network. 289
Inoculation with metabolically complementary bacteria enhances growth rate and impacts 290
morphology and metabolism 291
As described above, both the bacterial consortia tested, as well as all of the bacteria inoculated 292
individually had clear positive effects on algal growth and impacted algal morphology and metabolite 293
profiles, even though, by the time the co-cultures were harvested, some of the inoculated bacteria 294
were present only in very low abundance or even below the detection limit. These positive effects 295
could be due either to interactions early in the co-culture experiments followed by a decline in 296
bacterial abundance, or due to the capacity of bacteria to impact and interact with their algal hosts 297
even at very low cell concentrations. The latter would support the hypothesis that part of the 298
observed effects may not be due to the exchanges of (abundant) primary metabolites, such as the 299
predicted histidine/histidinol, but due to lowly concentrated signaling molecules or growth hormones. 300
One such compound could be the examined auxin, which was detected in 5 of the 7 tested co-301
cultures, and which has previously been shown to modify the developmental patterns and 302
morphology of Ectocarpus cultures (Le Bail et al. 2010) in a similar way as bacterial inoculations. 303
Another observation was that the abundance of bacteria on algal filaments but not in the medium was 304
significantly lower in co-culture conditions compared to the controls. This suggests that the 305
inoculated bacteria, either directly, or indirectly, by stimulating algal growth or defense, can also 306
regulate biofilm formation (see Goecke et al. 2010 for a review). 307
Interestingly, although differences in the effects of individual bacteria and bacterial consortia were 308
observed on metabolite profiles and morphology, all consortia had similar effects on algal growth. 309
Indeed, all of the tested bacteria, including Sphingomonas, which was not part of the minimal 310
solutions proposed by MiSCoTo, were to a great extent complementary to the alga, already covering 311
a large part of the metabolic gaps. In future studies, it may be particularly useful to incorporate a 312
larger range of bacteria, possibly from other sources so that they are not expected to have evolved 313
mutualistic interactions with brown algae. These negative controls could then be used to correlate 314
growth rates with the presence or absence of specific metabolic capacities in the network. Once the 315
list of candidate metabolite exchanges has been narrowed down by such comparisons, supplying 316
these metabolites from artificial sources but also testing for their excretion into the medium by 317
bacteria can be used to corroborate their role. 318
Predicted metabolic exchanges likely to occur in part 319
With respect to the predictions of target metabolites, we observed that for a large number of cases, 320
predictions from the metabolic networks corresponded to the observations made by experimental 321
metabolic profiling: none of the target metabolites were detected in the negative control, and only in 322
four cases (Figure 3), did we detect compounds in co-cultures that were not predicted to be there. 323
This could either be attributed to undetected metabolic pathways in the examined/added bacteria (e.g. 324
due to missing annotations) or, more likely, to the activity of other bacteria present in our co-culture 325
experiments (see below). Furthermore, there were several cases in which a potentially co-producible 326
metabolite was not detected in our co-cultures. Here two explanations appear particularly likely: first, 327
the metabolites in question may be produced but quickly metabolized in certain consortia, so that 328
they do not accumulate sufficiently to be detectable in our cultures; secondly, it is possible that the 329
corresponding biosynthetic pathway of the metabolite was not active or that the necessary exchange 330
of metabolites was not taking place. To resolve this point in future experiments, the addition of gene 331
expression data may help to establish whether or not biosynthetic or degradation pathways are active. 332
From a global perspective, however, the fact that none of the compounds in question were detected in 333
negative controls, but all of them it at least one co-culture condition, constitutes a highly promising 334
result. 335
Outlook 336
In our opinion, the main challenge for future in vivo studies of metabolic complementarity will be to 337
better control the Ectocarpus-associated microbiome in co-culture experiments, and thus to avoid any 338
impact of non-inoculated microbes. The currently applied antibiotic treatments are successful in 339
removing bacteria from the algal surface to a level where they are no longer detectable by 340
microscopy and spreading on culture medium, but once the treatment is stopped and algae are left to 341
recover, so do parts of the microbiome, possibly from spores that were inactive or embedded in the 342
algal cell wall and thus less susceptible to our treatments (Tetz and Tetz 2017). In the light of these 343
results, we strongly recommend routine metabarcoding analysis for any type of coculture experiment, 344
also in other model systems. One possibility in the future would be to use axenization protocols 345
based on the movement of gametes, as has been done for Ulva mutablilis (Spoerner et al. 2012); at 346
least some strains of Ectocarpus have previously been shown to produce phototactic gametes (Kawai 347
et al. 1990). A second alternative is the continuous use of antibiotics throughout the experiment, and 348
working with antibiotic-resistant bacterial strains. In this context a better understanding of the 349
metabolic requirements of the algae will help to durably maintain axenic cultures. 350
Despite these challenges, the present study constitutes an important proof of concept for the use of 351
metabolic complementarity to study simplified system of mutualistic host-symbiont interactions. We 352
anticipate that, in the long run, this concept can be applied not only to controlled co-culture 353
experiments, but that it will also prove useful for the interpretation of more complex datasets such as 354
metatranscriptomic or metagenomic data. 355
5 Conflict of Interest 356
The authors declare that the research was conducted in the absence of any commercial or financial 357
relationships that could be construed as a potential conflict of interest. 358
6 Author Contributions 359
Conceived the experiments: BB, HK, SD; Conceived in silico analyses: CF, AS. Performed 360
experiments: BB, HK; Performed analyses: BB, ALS, EF, CF, MW, SD, EC, CL; Wrote the 361
manuscript: SD, HK, BB. Corrected and approved of the final manuscript: all authors. 362
7 Funding
363
This work was funded partially by the CNRS Momentum call, the ANR project IDEALG (ANR-10-364
BTBR-04) “Investissements d’Avenir, Biotechnologies-Bioressources”, the European Union’s 365
Horizon 2020 research and innovation Programme under the Marie Sklodowska-Curie grant 366
agreement number 624575 (ALFF), and joint PhD scholarship from the Brittany region (Project 367
HOSALA) and the Sorbonne University (ED227). 368
8 Acknowledgments 369
We thank Laurence Dartevelle for advice on algal culturing; Sylvie Rousvoal for extractions of 370
bacterial DNA; Gwenn Tanguy and Erwan Legeay from the GENOMER platform (FR2424, Station 371
Biologique de Roscoff) for access to the sequencing platform and support during library preparation; 372
and François Thomas, Angélique Gobet, Maeva Brunet for helpful discussions and for sharing their 373
mock community; Dominique Marie and Christian Jeanthon for granting us access to their flow 374
cytometer; and the ABIMS platform and the GenOuest bioinformatics core facility 375
(https://www.genouest.org) for providing the computing infrastructure for amplicon analyses and 376
community predictions. The LABGeM (CEA/Genoscope & CNRS UMR8030), the France 377
Génomique and French Bioinformatics Institute national infrastructures (funded as part of 378
Investissement d'Avenir program managed by Agence Nationale pour la Recherche, contracts ANR-379
10-INBS-09 and ANR-11-INBS-0013) are acknowledged for support within the MicroScope 380 annotation platform. 381 9 Figures 382 383
Figure 1: A) Relative length of E. siliculosus filaments after 28 days of (co-)culture compared to the 384
starting point. B) Number of bacteria detected on algal filaments after 28 days of co-culture. Both 385
panels A and B show means of 3 replicate co-cultures ± SD and differences are statistically 386
significant (one-way ANOVA p<0.01). The letters above the columns indicate the results of a 387
TUKEY HSD pairwise comparisons (p<0.05). CTRL = control, ATB = antibiotic treatment, MRH = 388
Marinobacter-Roseovarius-Hoeflea; RIH = Roseovarius-Imperialibacter-Hoeflea. 389
390
Figure 2: Morphological effect cultures with bacteria on E. siliculosus after 4 weeks of co-391
culturing. MRH = Marinobacter-Roseovarius-Hoeflea, RIH = Roseovarius-Imperialibacter-Hoeflea. 392
394
Figure 3: Comparison of predicted production of target metabolites in co-cultures based on 395
metabolic networks (symbol before the slash) and results from targeted UPC2-MS analyses of algal 396
filaments after 28 days (symbol after the slash). The column “Exchange” indicates one possible 397
compound provided by the microbiome leading to the production of the compound in the column 398
“Target” in the algal metabolome; it was these target metabolites that were tested for using UPC2 -399
MS. All experiments were carried out in triplicate, each replicate of the same condition yielding 400
identical results. (-): a target metabolite was not predicted/detected (+): a metabolite was 401
predicted/detected. Green highlights conditions where predictions correspond to the in vivo 402
observations, red highlights compounds that were detected although no pathway was predicted. 403
Yellow indicates compounds potentially producible via bacterial exchanges that were not detected. 404
MRH: Marinobacter-Roseovarius-Hoeflea; RIH: Roseovarius-Imperialibacter-Hoeflea; CTRL = 405
control; ATB = antibiotic treatment. 406
407
10 Tables 408
Table 1: Overview of bacterial genomes used in this study and corresponding assembly statistics. 409 raw reads # scaffolds genome size (mbp) N50 (mbp) Coverage mapped reads Bosea sp. 5A 1 863 417 26 6.34 0.98 133 X 99.91% Erythrobacter sp. 430 1 065 278 11 3.14 0.44 157 X 99.93% Hoeflea sp. 425 3 734 649 41 5.22 1.26 326 X 99.94% Imperialibacter sp. R6 1 553 981 65 6.8 0.21 111 X 99.94% Marinobacter sp. HK15 1 587 675 14 4.39 1.11 172 X 99.93% Rhizobium sp. 404 1 332 560 27 4.2 0.45 148 X 99.93% Roseovarius sp. 134 987 463 73 4.68 0.18 150 X 99.92% Roseovarius sp. 420 803 175 85 4.68 0.12 79 X 99.89% Sphingomonas sp. 631 1 111 277 25 3.28 0.29 150 X 99.87% Sphingomonas sp. 391 1 150 343 74 4.6 0.16 113 X 99.91% 410 411 al d.
412
Table 2: Predicted metabolic pathways (complete pathways in parentheses), reactions and 413
metabolites in bacterial metabolic networks. 414 number of pathways number of reactions transport reactions number of metabolites Bosea sp. 5A 298 (187) 1892 153 1557 Erythrobacter sp. 430 218 (91) 1532 63 1247 Hoeflea sp. 425 315 (170) 1920 129 1558 Imperialibacter sp. R6 239 (131) 1711 100 1425 Marinobacter sp. HK15 249 (128) 1679 128 1364 Rhizobium sp. 404 289 (142) 1814 125 1462 Roseovarius sp. 134 263 (146) 1703 125 1418 Roseovarius sp. 420 263 (143) 1701 125 1418 Sphingomonas sp. 361 224 (108) 1519 69 1239 Sphingomonas sp. 391 254 (126) 1671 92 1358 415
Table 3: Minimal bacterial consortia predicted by MiSCoTo that enabled the production of 160 algal 416
compounds. See Supporting table S1 for a detailed list of compounds. 417
Solution proposed by MiSCoTo In vivo testing? Marinobacter sp. HK15, Roseovarius sp. 420, Hoeflea sp. 425 Yes
Roseovarius sp. 420, Imperialibacter sp. R6, Hoeflea sp. 425 Yes Marinobacter sp. HK15, Bosea sp. 5a, Roseovarius sp. 420 No Marinobacter HK15, Hoeflea sp. 425, Roseovarius sp. 134 No Imperialibacter sp. R6, Hoeflea sp. 425, Roseovarius sp.134 No Marinobacter sp. HK15, Bosea sp. 5a, Roseovarius sp. 134 No 418
Table 4: Observed abundance of target OTUs after four weeks of co-culture. The table shows 420
number of reads obtained corresponding to each OTU (mean three replicates ± SD). Bold numbers 421
grey background indicate OTUs expected to be present based on the inoculations. 422 MRH RIH Marino-bacter Roseo-varius Hoef-lea Im- periali-bacter Sphing-omonas CTRL w. ATB CT w A Marinobct.O TU00030 82 ± 48 0 ± 0 1103 ± 1068 0 ± 0 0 ± 0 0 ± 0 38 ± 38 0 ± 0 Roseovarius OTU00055 8 ± 7 11 ± 3 1 ± 1 41 ± 10 1 ± 1 0 ± 0 0 ± 0 0 ± 0 Hoeflea OTU00001 10265 ± 1586 7644 ± 889 4483 ± 2777 15635 ± 1349 15321 ± 3515 13426 ± 5338 10216 ± 4345 8899 ± 2811 3 Imperialib. OTU00044 0 ± 0 0 ± 0 0 ± 0 0 ± 0 0 ± 0 0 ± 0 0 ± 0 0 ± 0 Sphingomn. OTU00097 0 ± 0 0 ± 0 0 ± 0 0 ± 0 0 ± 0 1 ± 1 4 ± 4 0 ± 0 Other OTUs* 39403 ± 2138 23458 ± 1828 26223 ± 3187 36374 ± 7810 34190 ± 5508 38076 ± 4292 29066 ± 3302 42323 ± 9670 28 *
see Supplementary Figure S2 for details 423
11 Supplementary Material 424
Supplementary Table S1: Metabolites predicted to become producible by the alga as a result of 425
metabolite exchanges between the alga and bacteria. (uploaded separately) 426
427
Supplementary Figure S1: Number of bacteria detected in the algal culture medium after 28 days 428
co-culture. The graph shows means of 3 replicates ± SD and differences are statistically significant 429
(one-way ANOVA p<0.01). The letters above the columns indicate the results of a TUKEY HSD 430
pairwise comparisons (p<0.05). CTRL = control, ATB = antibiotic treatment. 431 rs on CTRL w./o. ATB 1 ± 1 0 ± 0 3618 ± 1055 0 ± 0 0 ± 0 28009 ± 5897 ys of nt
432
Supplementary Figure S2: Heatmap of relative OTU abundance for all 30 OTUs that made up ove 433
1% of the total number of reads and that were not inoculated (See Table 4 for the latter). This 434
heatmap as generated using the ClustVis service (Metsalu and Vilo 2015) using “correlation” as a 435
distance measure and “average linkage” as clustering method. The color code corresponds to the 436
mean sequence abundance for each OTU in the three replicates a percentage of total reads; uc. = 437
unclassified 438
439
440
12 Data Availability Statement 441
The metabarcoding data generated for this study has been deposited at the European Nucleotide 442
Archive (ENA) under project accession number PRJEB34356. The bacterial genomes have been 443
deposited at the ENA under the sample accessions ERZ1079053-ERZ1079062. 444
13 References 445
Aite M, Chevallier M, Frioux C, et al. 2018. Traceability, reproducibility and wiki-exploration for 446
“à-la-carte” reconstructions of genome-scale metabolic models. PLOS Computational Biology 14: 447
e1006146. 448
Amin SA, Hmelo LR, van Tol HM, et al. 2015. Interaction and signalling between a cosmopolitan 449
phytoplankton and associated bacteria. Nature 522: 98–101. 450
Aziz RK, Bartels D, Best AA, et al. 2008. The RAST Server: rapid annotations using subsystems 451
technology. BMC Genomics 9: 75. 452
Le Bail A, Billoud B, Kowalczyk N, et al. 2010. Auxin metabolism and function in the multicellular 453
brown alga Ectocarpus siliculosus. Plant Physiology 153: 128–44. 454
Bankevich A, Nurk S, Antipov D, et al. 2012. SPAdes: a new genome assembly algorithm and its 455
applications to single-cell sequencing. Journal of Computational Biology 19: 455–77. 456
Bligh EG, Dyer WJ. 1959. A rapid method of total lipid extraction and purification. Canadian 457
Journal of Biochemistry and Physiology 37: 911–917. 458
Bolger AM, Lohse M, Usadel B. 2014. Trimmomatic: a flexible trimmer for Illumina sequence data. 459
Bioinformatics 30: 2114–20. 460
Dittami SM, Barbeyron T, Boyen C, et al. 2014. Genome and metabolic network of “Candidatus 461
Phaeomarinobacter ectocarpi” Ec32, a new candidate genus of Alphaproteobacteria frequently 462
associated with brown algae. Frontiers in Genetics 5: 241. 463
Dittami SM, Eveillard D, Tonon T. 2014. A metabolic approach to study algal-bacterial 464
interactions in changing environments. Molecular ecology 23: 1656–60. 465
Frioux C, Fremy E, Trottier C, Siegel A. 2018. Scalable and exhaustive screening of metabolic 466
functions carried out by microbial consortia. Bioinformatics 34: i934–i943. 467
Goecke F, Labes A, Wiese J, Imhoff J. 2010. Chemical interactions between marine macroalgae 468
and bacteria. Marine Ecology Progress Series 409: 267–299. 469
Hammer Ø, Harper D, Ryan P. 2001. PAST: Paleontological statistics software package for 470
education and data analysis. Palaeontolia Electronica 4. 471
Illumina. 2017. 16S Metagenomic Sequencing Library Preparation. 472
https://support.illumina.com/documents/documentation/chemistry_documentation/16s/16s-473
metagenomic-library-prep-guide-15044223-b.pdf. 474
Karp PD, Latendresse M, Paley SM, et al. 2016. Pathway Tools version 19.0 update: software for 475
pathway/genome informatics and systems biology. Briefings in Bioinformatics 17: 877–890. 476
Kawai H, Müller DG, Fölster E, Häder D-P. 1990. Phototactic responses in the gametes of the 477
brown alga, Ectocarpus siliculosus. Planta 182: 292–7. 478
KleinJan H, Jeanthon C, Boyen C, Dittami SM. 2017. Exploring the cultivable Ectocarpus 479
microbiome. Frontiers in Microbiology 8: 2456. 480
Kozich JJ, Westcott SL, Baxter NT, Highlander SK, Schloss PD. 2013. Development of a dual-481
index sequencing strategy and curation pipeline for analyzing amplicon sequence data on the miseq 482
illumina sequencing platform. Appl. Environ. Microbiol. 79: 5112–5120. 483
Kreimer A, Doron-Faigenboim A, Borenstein E, Freilich S. 2012. NetCmpt: a network-based tool 484
for calculating the metabolic competition between bacterial species. Bioinformatics 28: 2195–2197. 485
Levy R, Carr R, Kreimer A, Freilich S, Borenstein E. 2015. NetCooperate: a network-based tool 486
for inferring host-microbe and microbe-microbe cooperation. BMC Bioinformatics 16: 164. 487
Lindemann SR, Bernstein HC, Song H-S, et al. 2016. Engineering microbial consortia for 488
controllable outputs. The ISME journal 10: 2077–84. 489
Masella AP, Bartram AK, Truszkowski JM, Brown DG, Neufeld JD. 2012. PANDAseq: paired-490
end assembler for illumina sequences. BMC bioinformatics 13: 31. 491
Metsalu T, Vilo J. 2015. ClustVis: a web tool for visualizing clustering of multivariate data using 492
Principal Component Analysis and heatmap. Nucleic Acids Research 43: W566–W570. 493
Prigent S, Collet G, Dittami SM, et al. 2014. The genome-scale metabolic network of Ectocarpus 494
siliculosus (EctoGEM): a resource to study brown algal physiology and beyond. Plant Journal 80: 495
367–381. 496
Prigent S, Frioux C, Dittami SM, et al. 2017. Meneco, a Topology-Based Gap-Filling Tool 497
Applicable to Degraded Genome-Wide Metabolic Networks. PLOS Computational Biology 13: 498
e1005276. 499
Rohwer F, Seguritan V, Azam F, Knowlton N. 2002. Diversity and distribution of coral-associated 500
bacteria. Marine Ecology Progress Series 243: 1–10. 501
Schnoes AM, Brown SD, Dodevski I, Babbitt PC. 2009. Annotation error in public databases: 502
misannotation of molecular dunction in enzyme superfamilies. PLoS Computational Biology 5: 503
e1000605. 504
Spoerner M, Wichard T, Bachhuber T, Stratmann J, Oertel W. 2012. Growth and thallus 505
morphogenesis of Ulva mutabilis (Chlorophyta) depends on a combination of two bacterial species 506
excreting regulatory factors. Journal of Phycology 48: 1433–1447. 507
Tapia JE, González B, Goulitquer S, Potin P, Correa JA. 2016. Microbiota Influences 508
Morphology and Reproduction of the Brown Alga Ectocarpus sp. Frontiers in Microbiology 7: 197. 509
Tetz G, Tetz V. 2017. Introducing the sporobiota and sporobiome. Gut pathogens 9: 38. 510
Thomas F, Dittami SM, Brunet M, et al. Evaluation of a new primer combination to minimize 511
plastid contamination in 16S rDNA metabarcoding analyses of alga-associated bacterial 512
communities. Environmental Microbiology Reports in prep. 513
Vallenet D, Labarre L, Rouy Z, et al. 2006. MaGe: a microbial genome annotation system 514
supported by synteny results. Nucleic Acids Research 34: 53–65. 515
Wahl M, Goecke F, Labes A, Dobretsov S, Weinberger F. 2012. The second skin: ecological role 516
of epibiotic biofilms on marine organisms. Frontiers in Microbiology 3: 292. 517
Wang Q, Garrity GM, Tiedje JM, Cole JR. 2007. Naive Bayesian classifier for rapid assignment 518
of rRNA sequences into the new bacterial taxonomy. Applied and Environmental Microbiology 73: 519
5261–7. 520
Wang Q, Liu J, Zhu H. 2018. Genetic and molecular mechanisms underlying symbiotic specificity 521
in legume-Rhizobium interactions. Frontiers in Plant Science 9: 313. 522
Zhou J, Lyu Y, Richlen ML, Anderson DM, Cai Z. 2016. Quorum sensing is a language of 523
chemical signals and plays an ecological role in algal-bacterial interactions. Critical Reviews in Plant 524
Sciences 35: 81–105. 525